Blog
Orbion Team
Scale-Up Nightmares: When Your 50 mL Protocol Fails at 5 L

Your protein is perfect at the bench. 50 mL cultures in shake flasks, 25°C induction, overnight expression, Ni-NTA purification. You get 5 mg of pure, active, beautiful protein. Then the collaboration requires 500 mg. You scale to 5 L fermenters. Same construct, same strain, same media, same induction conditions. You get inclusion bodies, heterogeneous product, half the specific activity, and an aggregation problem you've never seen before.
Scale-up is where "my protein works" meets reality. The physics of protein expression change fundamentally between a 50 mL shake flask and a 5 L bioreactor, and protocols that work at small scale routinely fail at large scale.
Key Takeaways
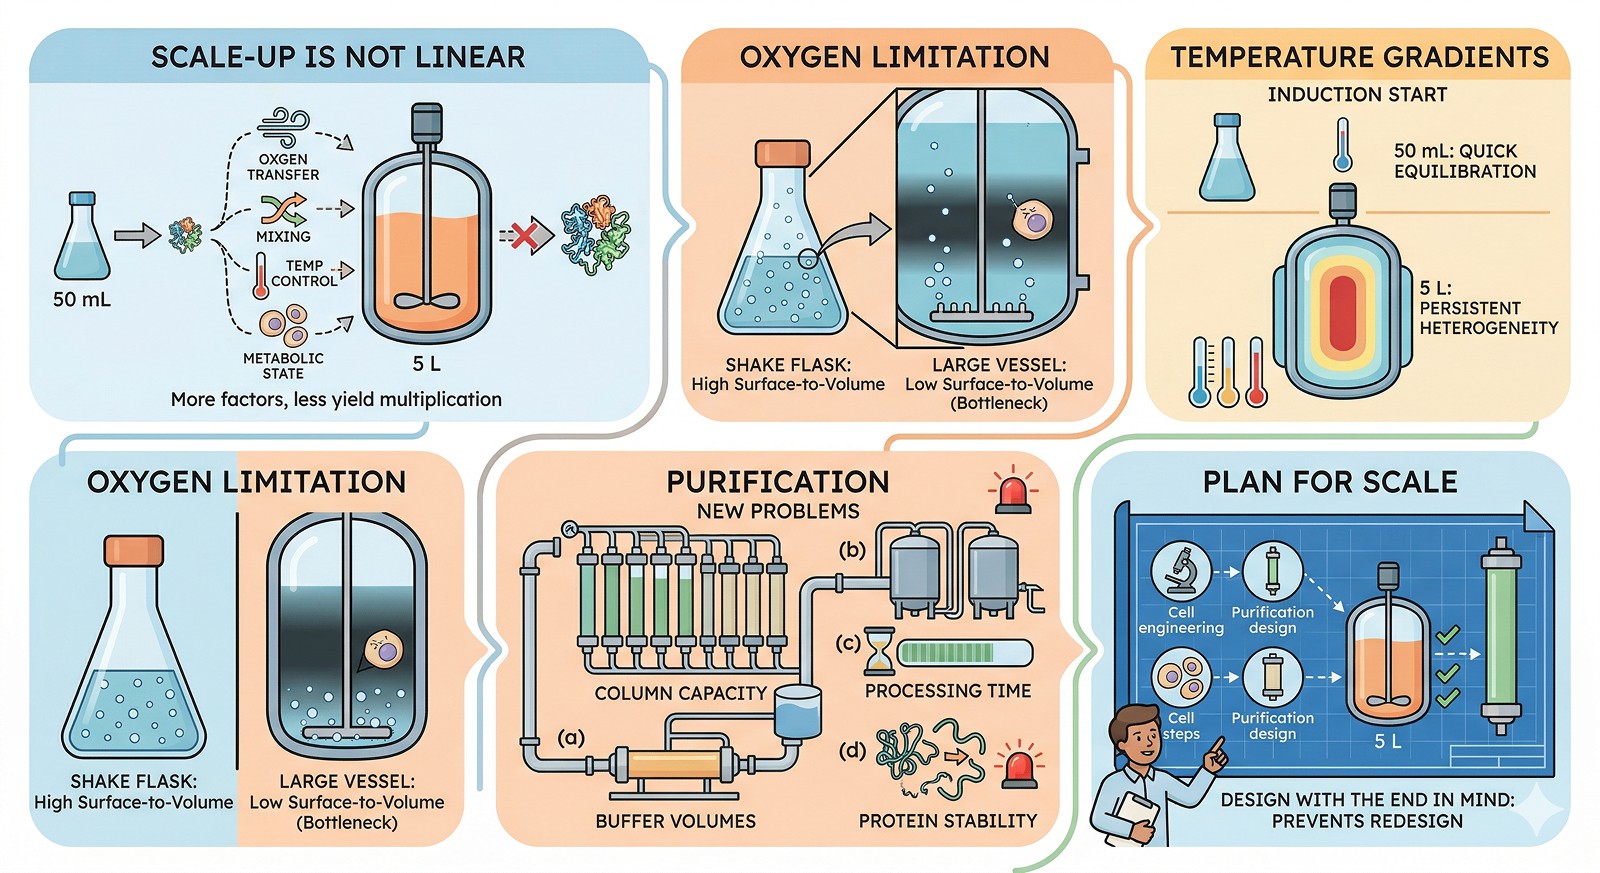
Scale-up is not linear: doubling the culture volume doesn't double the yield—it changes oxygen transfer, mixing, temperature control, and metabolic state
Oxygen limitation is the #1 killer at scale: shake flasks have excellent surface-to-volume ratios; large vessels don't
Temperature gradients matter: 50 mL cultures equilibrate in minutes; 5 L cultures have persistent temperature heterogeneity during induction
Purification at scale introduces new problems: column capacity, buffer volumes, processing time, and protein stability during extended procedures
Plan for scale from the beginning: designing your expression and purification strategy with scale in mind prevents redesigning everything at the 5 L stage
Why Scale Changes Everything
The Physics Are Different
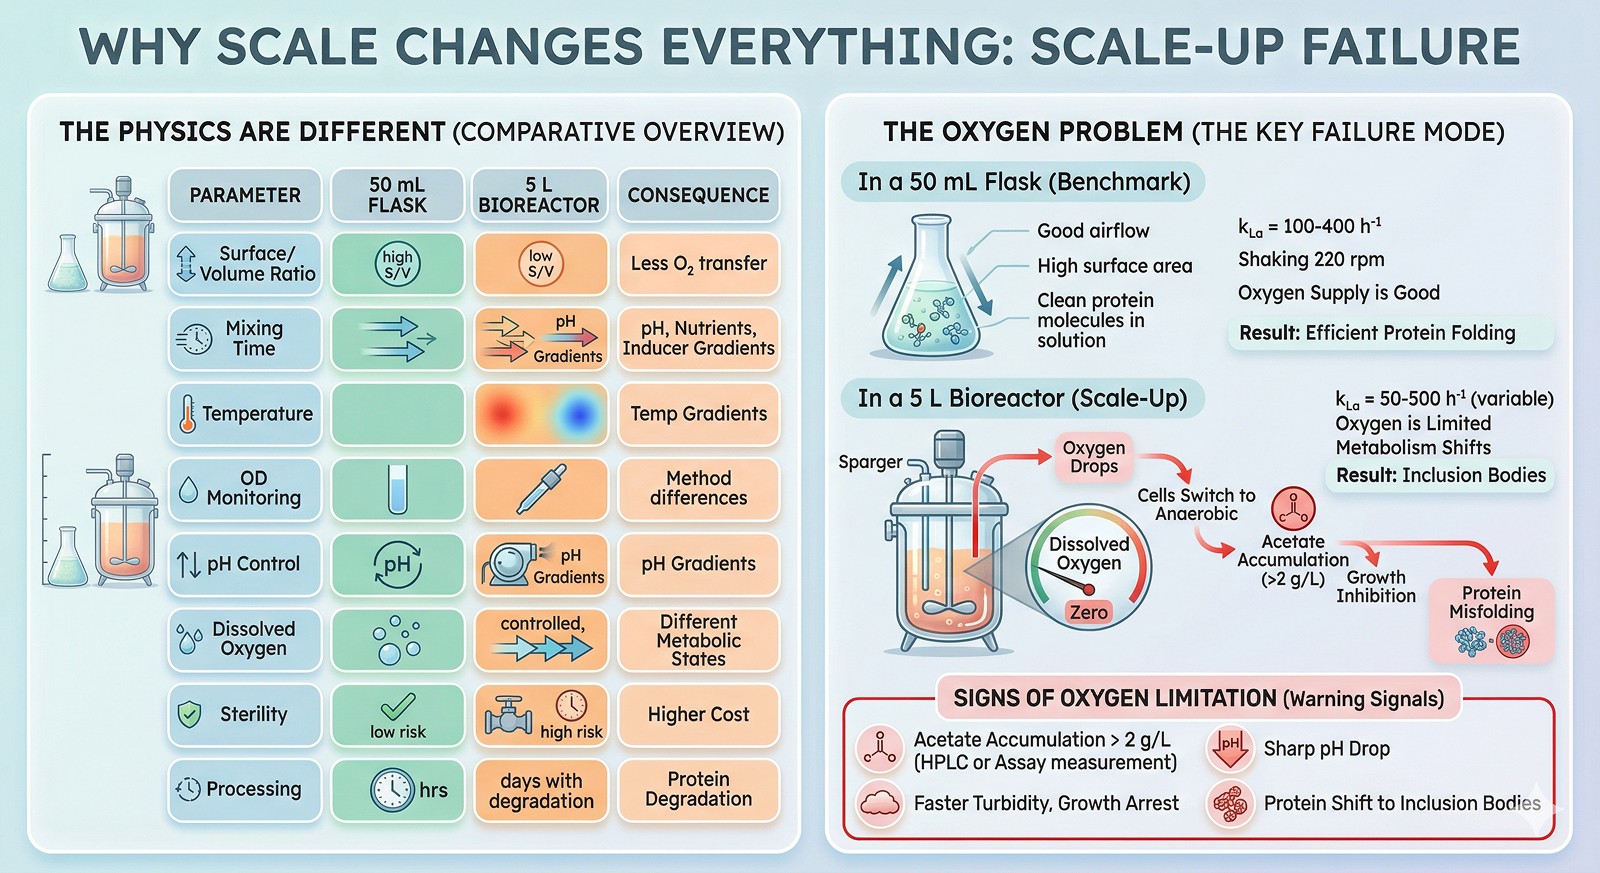
Parameter | 50 mL Shake Flask | 5 L Bioreactor | Consequence |
|---|---|---|---|
Surface/volume ratio | High | Low | Less O₂ transfer per unit volume |
Mixing time | Seconds | 10–60 seconds | Gradients in pH, nutrients, inducer |
Temperature equilibration | Minutes | 10–30 minutes | Cold/hot spots during induction |
OD monitoring | Easy (spectrophotometer) | Often continuous (probe) | Different measurement methods |
pH control | None (buffered media) | Active (acid/base addition) | pH gradients near addition port |
Dissolved oxygen | Uncontrolled | Controlled (cascade) | Different metabolic state |
Sterility risk | Low (small volume, short time) | Higher (large volume, long time) | Contamination more costly |
Processing time | Hours | Days | Protein degrades during longer process |
The Oxygen Problem
Oxygen transfer is the single most important variable that changes with scale, and it's the most common cause of scale-up failure in E. coli expression.
In a shake flask:
kLa (volumetric oxygen transfer coefficient) = 100–400 h⁻¹
At 50 mL in a 250 mL flask, shaking at 220 rpm, oxygen supply is usually sufficient
Cells grow aerobically, produce protein efficiently
In a 5 L bioreactor:
kLa = 50–500 h⁻¹ (depending on agitation and aeration)
Without proper control, dissolved oxygen drops to zero during high-cell-density growth
Cells switch to anaerobic metabolism → acetate accumulation → growth inhibition → protein misfolding
The result: At the bench, your protein folds correctly in well-aerated flasks. In the fermenter, oxygen limitation causes a metabolic shift that changes everything about protein production.
Signs of oxygen limitation:
Acetate accumulation >2 g/L (measure by HPLC or enzyme assay)
pH drops sharply despite buffering
Culture turns turbid faster than expected, then growth arrests
Protein shifts from soluble to inclusion bodies
The Seven Scale-Up Failures
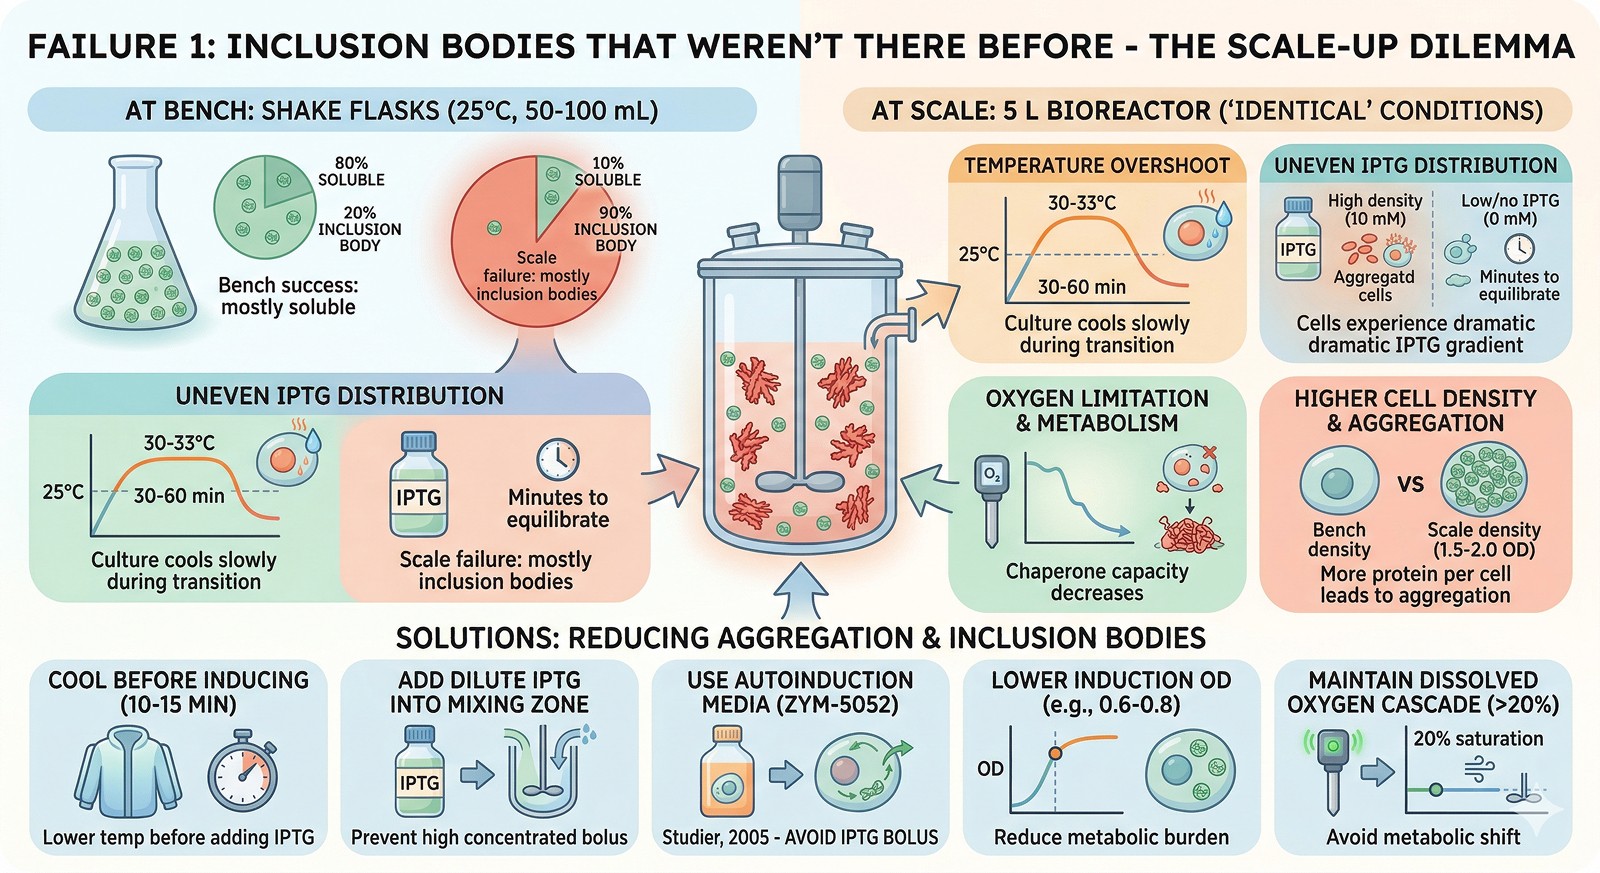
Failure 1: Inclusion Bodies That Weren't There Before
At bench: Protein is 80% soluble at 25°C in shake flasks.
At scale: Protein is 90% in inclusion bodies under "identical" conditions.
Why this happens:
The effective induction conditions are different at scale:
Temperature overshoot during transition from growth (37°C) to induction (25°C)—the culture may spend 30–60 minutes at 30–33°C instead of dropping instantly
Uneven IPTG distribution during addition—cells near the addition port see 10 mM IPTG while distant cells see 0 mM, then equilibration over minutes
Oxygen limitation shifts the metabolic state, reducing chaperone capacity
Higher cell density at induction = more protein per cell = more aggregation pressure
Solutions:
Cool the fermenter to induction temperature BEFORE adding IPTG (10–15 min pre-cooling)
Add IPTG as a dilute solution into the mixing zone, not as a concentrated bolus
Use autoinduction media (ZYM-5052) which avoids the IPTG bolus entirely (Studier, 2005)
Lower the induction OD (induce at OD 0.6–0.8 instead of 1.5–2.0 to reduce metabolic burden)
Implement a dissolved oxygen cascade (maintain >20% saturation)
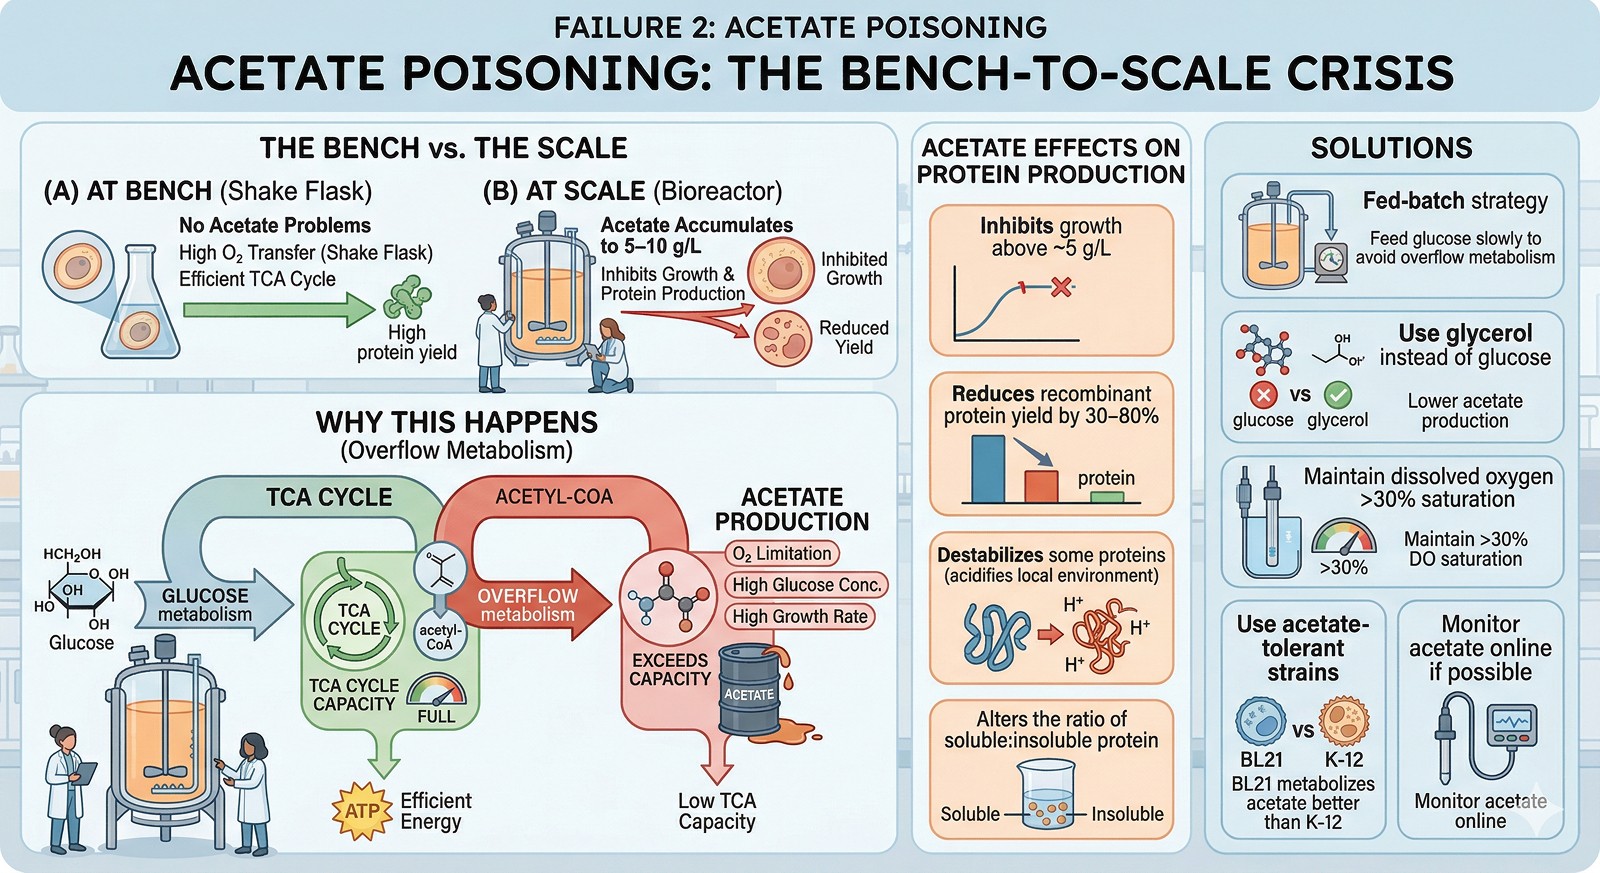
Failure 2: Acetate Poisoning
At bench: No acetate problems.
At scale: Acetate accumulates to 5–10 g/L, inhibiting growth and protein production.
Why this happens:
E. coli produces acetate when glucose metabolism exceeds the capacity of the TCA cycle (Eiteman & Altman, 2006). This happens under:
Oxygen limitation (even transient)
High glucose concentration (overflow metabolism)
High growth rate with insufficient aeration
At bench scale, the excellent oxygen transfer of shake flasks keeps cells aerobic. At scale, even brief oxygen limitation triggers acetate production.
Acetate effects on protein production:
Inhibits growth above ~5 g/L
Reduces recombinant protein yield by 30–80%
Destabilizes some proteins (acidifies the local environment)
Alters the ratio of soluble:insoluble protein
Solutions:
Fed-batch strategy: feed glucose slowly to avoid overflow metabolism
Use glycerol instead of glucose (lower acetate production)
Maintain dissolved oxygen >30% saturation
Use acetate-tolerant strains (BL21 metabolizes acetate better than K-12 strains)
Monitor acetate online if possible
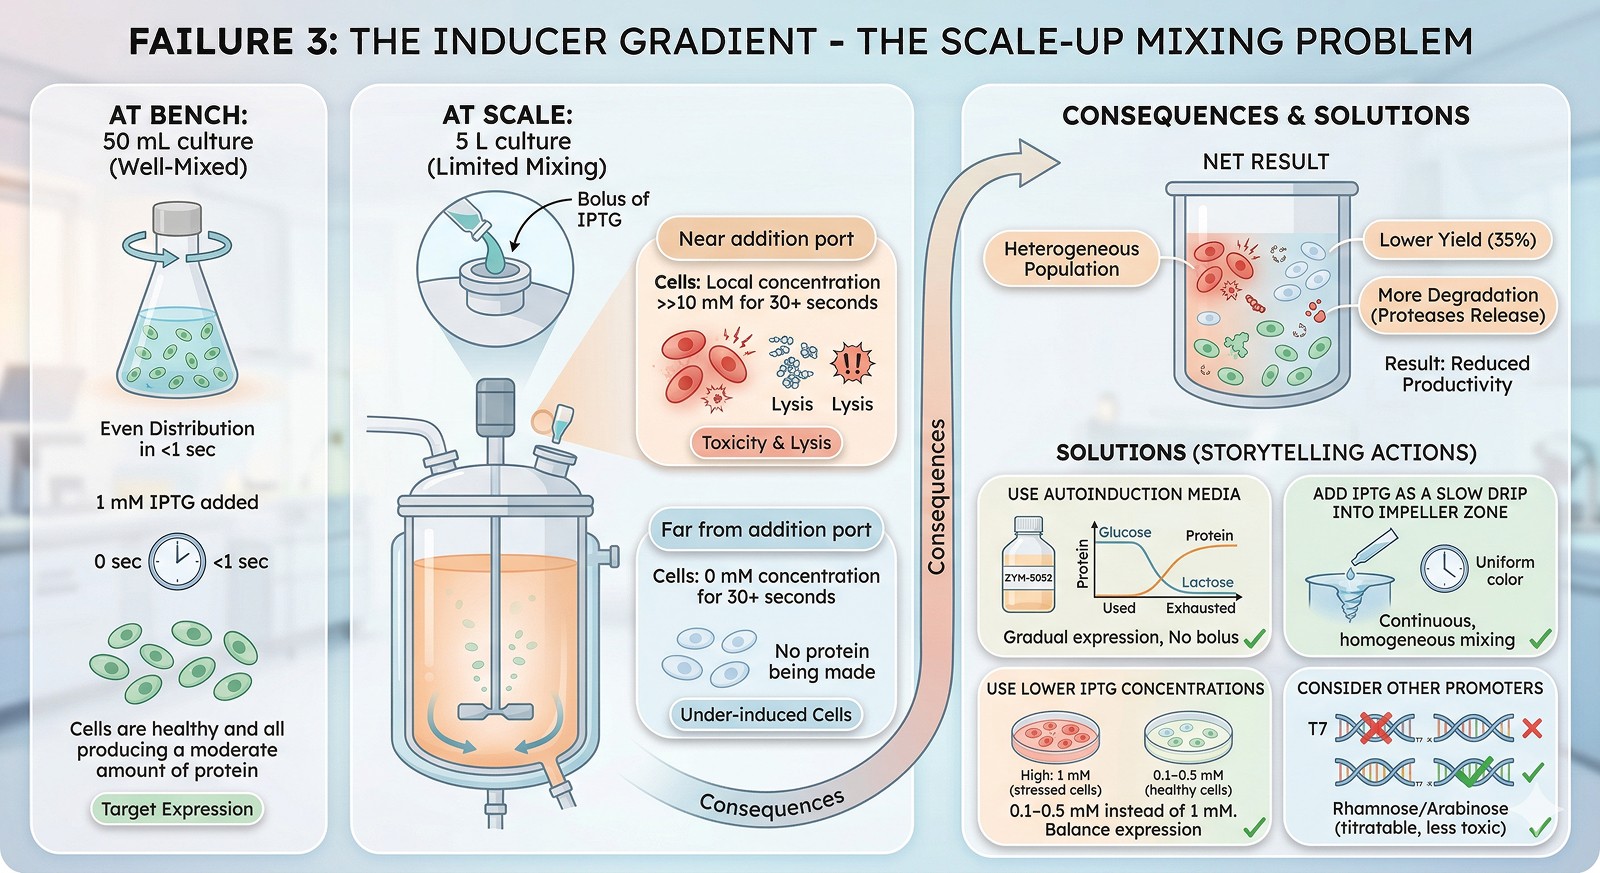
Failure 3: The Inducer Gradient
At bench: 1 mM IPTG added to a well-mixed 50 mL culture. Even distribution in <1 second.
At scale: 1 mM IPTG added to a 5 L culture. Mixing time: 30–60 seconds. Local concentration near the addition port: >>10 mM. Cells far from the port: 0 mM for 30+ seconds.
Consequences:
Cells near the port are over-induced → toxic levels of protein expression → cell lysis → protease release
Cells far from the port are under-induced → no protein production
The net result: heterogeneous population, lower yield, more degradation
Solutions:
Use autoinduction media (glucose represses T7 promoter during growth; lactose gradually induces during stationary phase—no bolus needed)
Add IPTG as a slow drip into the impeller zone
Use lower IPTG concentrations (0.1–0.5 mM instead of 1 mM)
Consider rhamnose or arabinose-inducible promoters (titratable, less toxic)
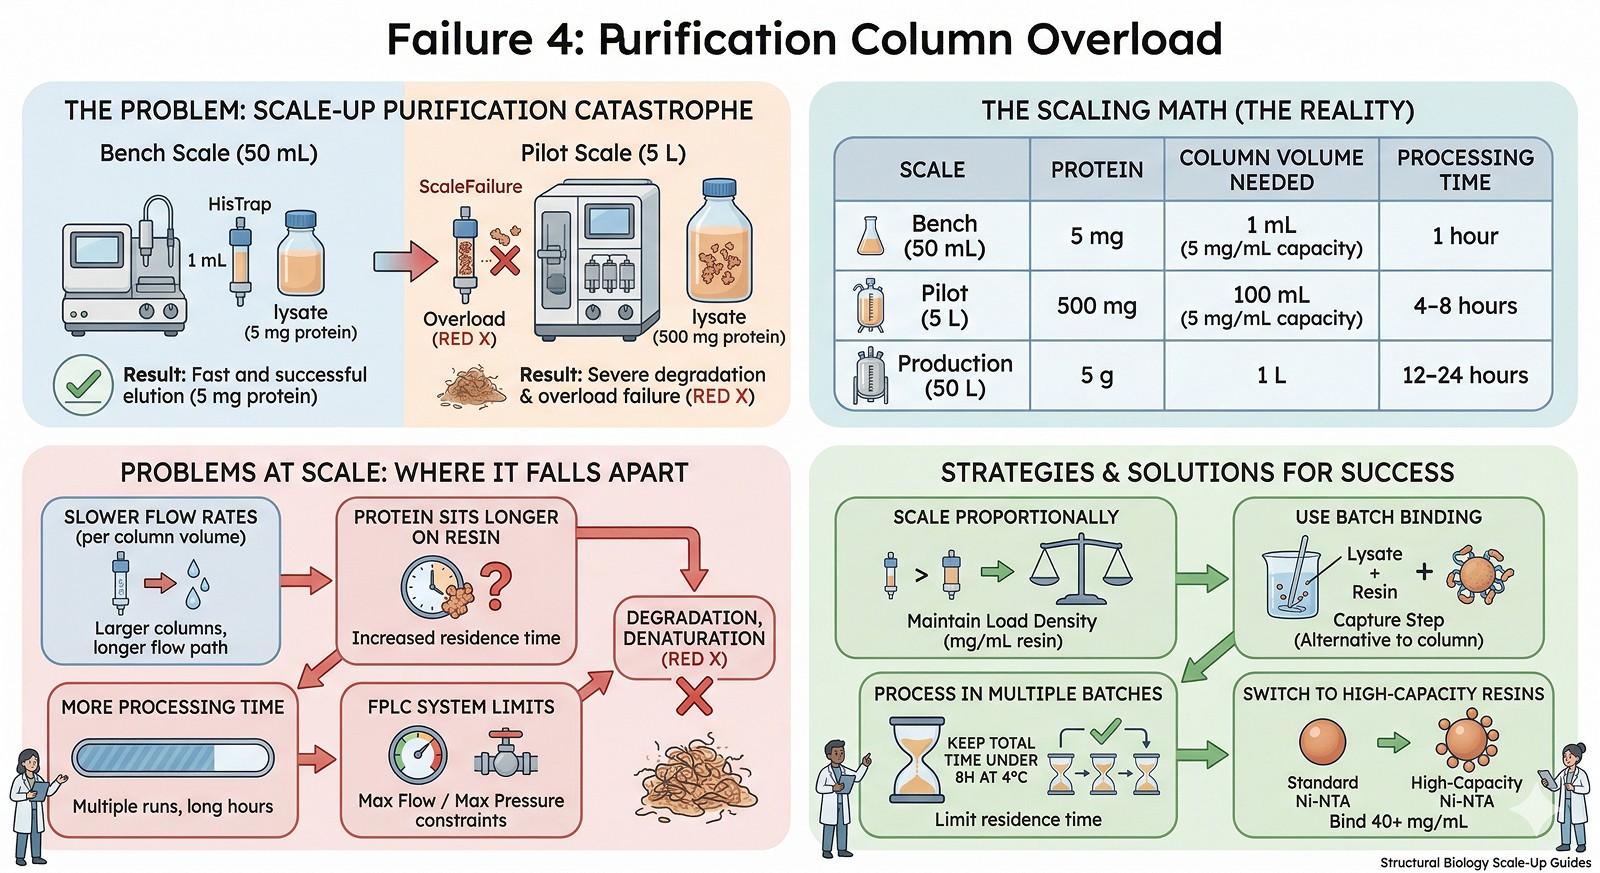
Failure 4: Purification Column Overload
At bench: 1 mL HisTrap column for 5 mg protein. Load, wash, elute in 1 hour.
At scale: Same column for 500 mg protein. Column is overloaded 100x.
The scaling math:
Scale | Protein | Column Volume Needed | Processing Time |
|---|---|---|---|
Bench (50 mL) | 5 mg | 1 mL (5 mg/mL capacity) | 1 hour |
Pilot (5 L) | 500 mg | 100 mL (5 mg/mL capacity) | 4–8 hours |
Production (50 L) | 5 g | 1 L | 12–24 hours |
Problems at scale:
Larger columns have slower flow rates (relative to bed volume)
Protein sits on the column longer → degradation, denaturation
Multiple column runs needed if column is undersized → more processing time
FPLC system limitations (maximum flow rate, maximum pressure)
Solutions:
Scale the column proportionally (maintain load density in mg/mL resin)
Use batch binding (mix resin with lysate) instead of column loading for the capture step
Process in multiple batches if needed—but keep total time under 8 hours at 4°C
Switch to higher-capacity resins (some Ni-NTA resins bind 40+ mg/mL)
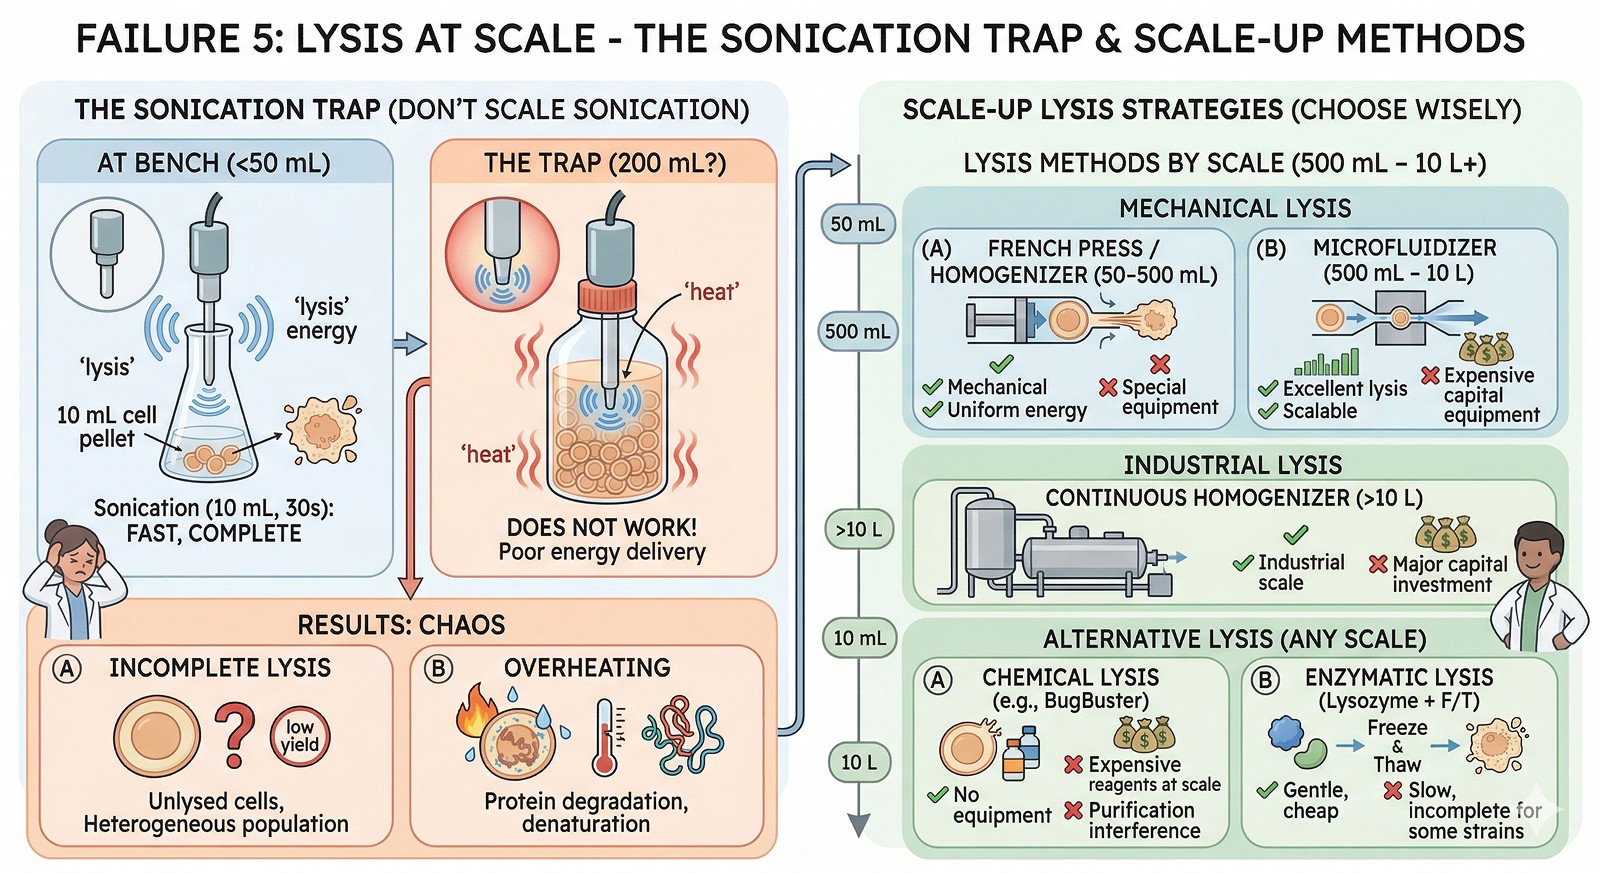
Failure 5: Lysis at Scale
At bench: Sonicate 10 mL cell pellet in 30 seconds. Complete lysis.
At scale: Sonicate 500 mL? No—you need a different lysis method entirely.
Methods by scale:
Scale | Method | Pros | Cons |
|---|---|---|---|
< 50 mL | Sonication | Simple, effective | Not scalable; local heating |
50–500 mL | French press / homogenizer | Mechanical, uniform | Equipment needed |
500 mL – 10 L | Microfluidizer | Excellent lysis, scalable | Expensive equipment |
> 10 L | Continuous homogenizer | Industrial scale | Capital investment |
Any scale | Chemical lysis (BugBuster, B-PER) | No equipment needed | Expensive reagents at scale; may interfere with purification |
Any scale | Enzymatic (lysozyme + freeze-thaw) | Gentle, cheap | Slow; incomplete for some strains |
The sonication trap: Many researchers try to scale sonication from 10 mL to 200 mL. This doesn't work—the probe can't deliver uniform energy to the entire volume. You get incomplete lysis near the walls and overheating near the probe.
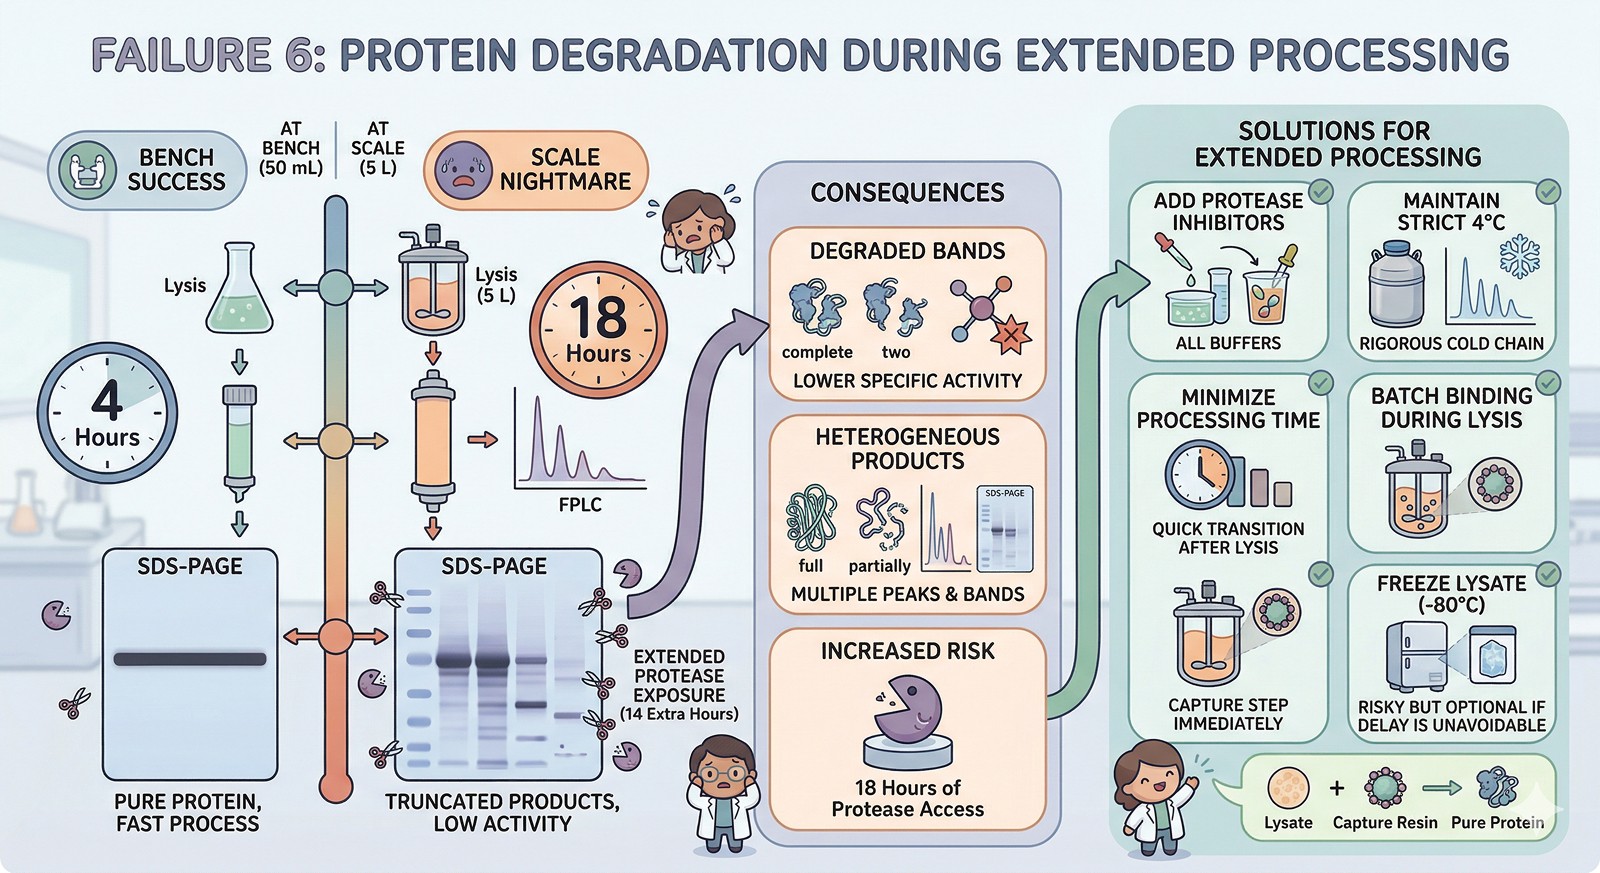
Failure 6: Protein Degradation During Extended Processing
At bench: From lysis to pure protein in 4 hours. Protease exposure is minimal.
At scale: From lysis to pure protein in 18 hours. Proteases have been chewing on your protein for 14 extra hours.
Consequence: Truncated products, lower specific activity, heterogeneous bands on SDS-PAGE that weren't present at bench scale.
Solutions:
Add protease inhibitors to ALL buffers (PMSF, EDTA-free cocktail)
Process at 4°C rigorously—even brief warming to RT accelerates degradation
Minimize time between lysis and the first purification step
Consider adding the capture step directly to the lysate (batch binding during lysis)
If processing time is unavoidable, freeze the lysate at –80°C and process the next day (risky but sometimes necessary)
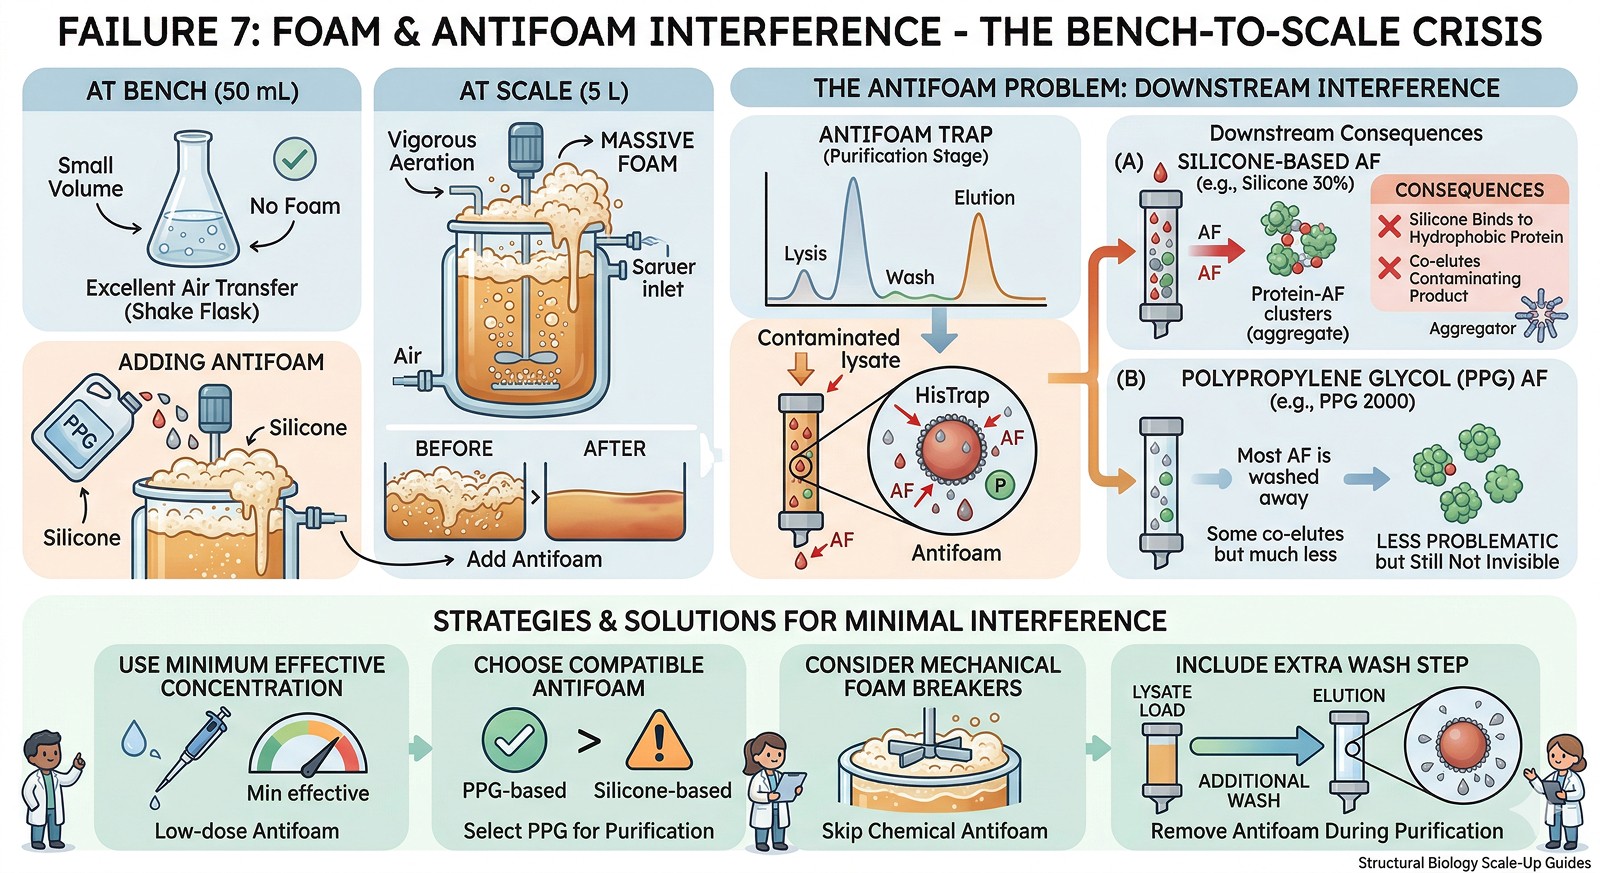
Failure 7: Foam and Antifoam Interference
At bench: No foam (small volume, no sparging).
At scale: Vigorous foam during aeration. You add antifoam. The antifoam interferes with downstream purification.
The antifoam problem:
Silicone-based antifoams can bind to hydrophobic proteins
They co-elute during chromatography, contaminating the product
Some antifoams interfere with detergent-sensitive assays
Polypropylene glycol (PPG)-based antifoams are less problematic but still not invisible
Solutions:
Use the minimum effective antifoam concentration
Choose antifoams compatible with your purification strategy (PPG > silicone for most purposes)
Consider mechanical foam breakers instead of chemical antifoam
Include an extra wash step during purification to remove antifoam
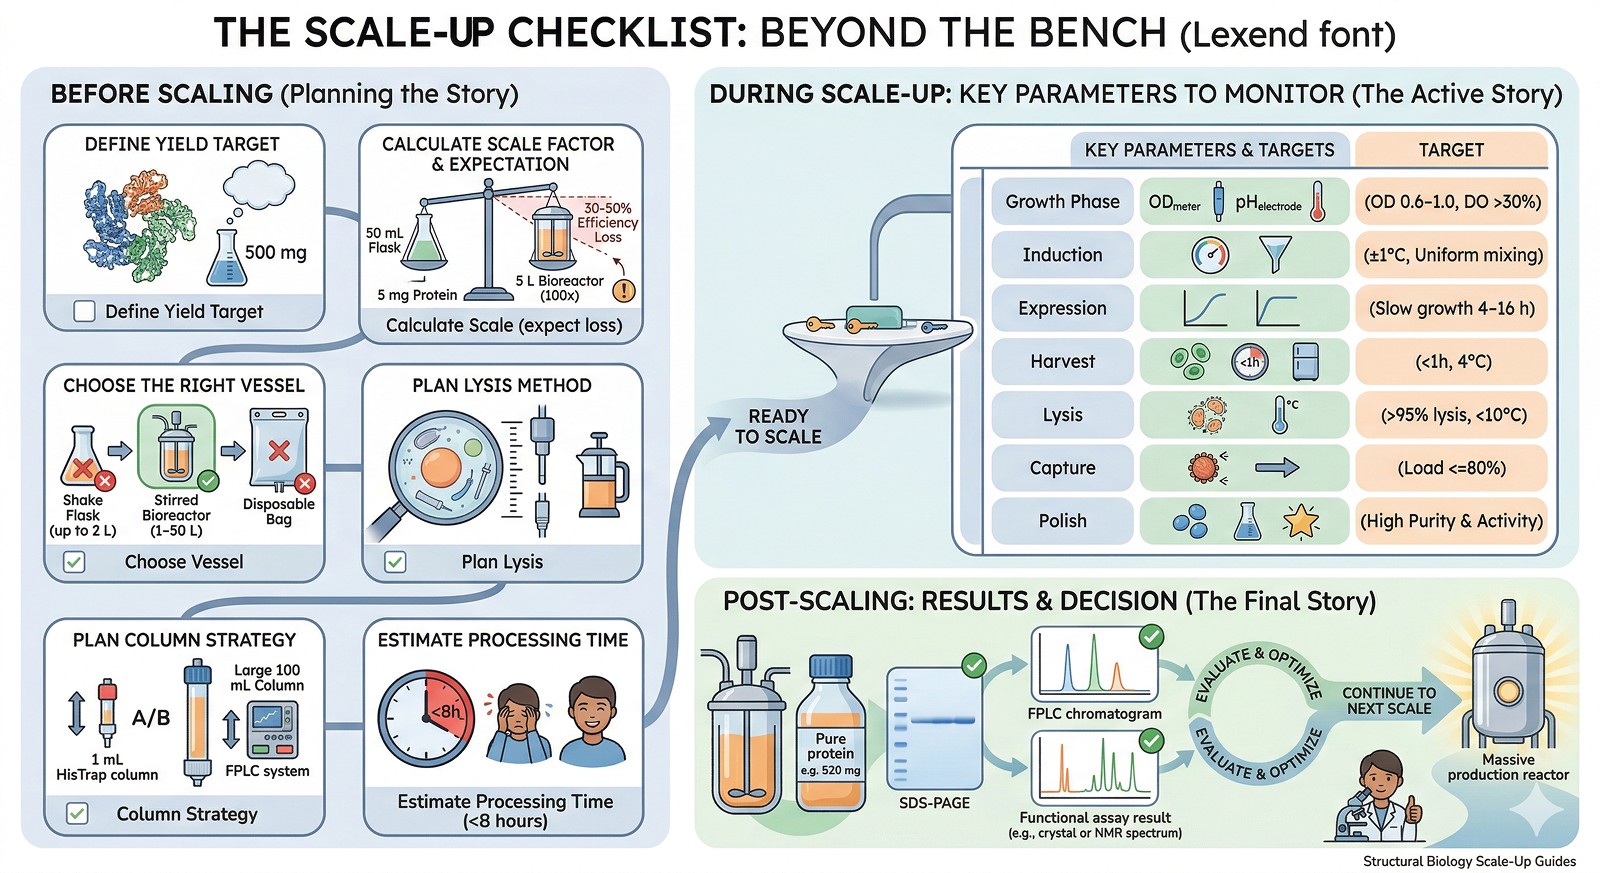
The Scale-Up Checklist
Before Scaling
Define your yield target: How much protein do you actually need?
Calculate the scale factor: If you get 5 mg from 50 mL, you need 100x for 500 mg—but expect 30–50% efficiency loss at scale
Choose the right vessel: Shake flasks (up to 2 L), stirred bioreactors (1–50 L), or disposable bags
Plan lysis method: What works at your target volume?
Plan column strategy: Column size, flow rate, number of runs
Estimate processing time: Can you complete purification in <8 hours?
During Scale-Up
Stage | Key Parameters to Monitor | Target |
|---|---|---|
Growth phase | OD, dissolved oxygen, pH, temperature | OD 0.6–1.0 at induction; DO >30% |
Induction | Temperature stability, inducer distribution | Uniform induction; temperature ±1°C |
Expression | Growth rate post-induction, OD plateau | Continued slow growth for 4–16 h |
Harvest | Cell viability, time to processing | Harvest within 1 h; keep at 4°C |
Lysis | Completeness, temperature control | >95% lysis; <10°C throughout |
Capture | Binding capacity, flow rate | Load ≤80% of column capacity |
Polish | Purity, yield, activity | Target purity before scaling further |
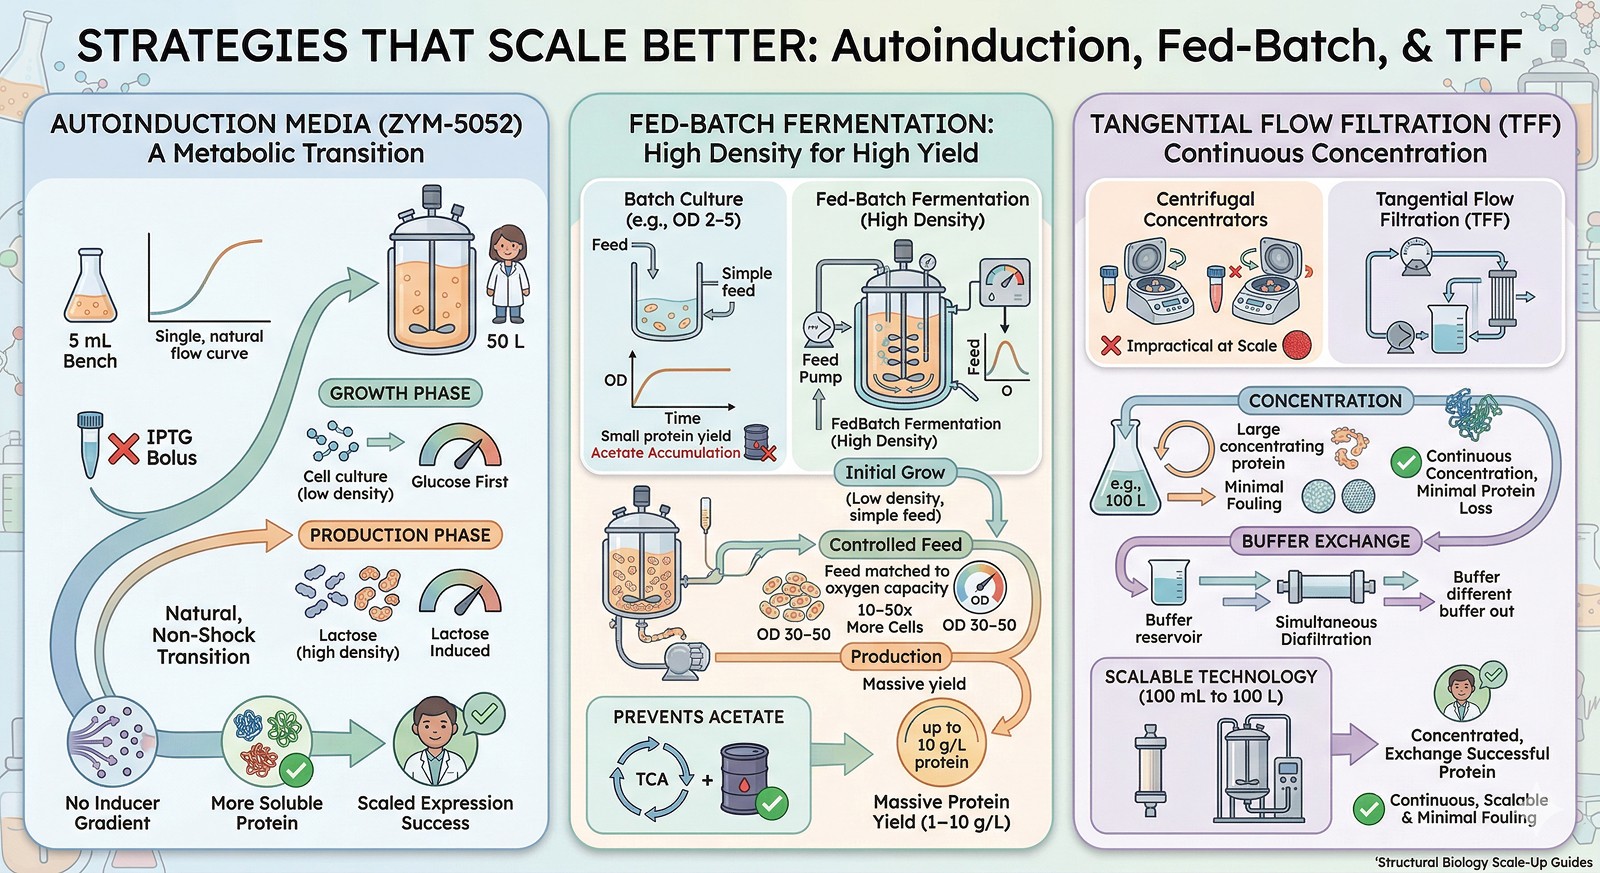
Strategies That Scale Better
Autoinduction Media
Studier's autoinduction media (ZYM-5052) avoid many scale-up problems:
No IPTG bolus → no inducer gradients
Glucose is consumed first (growth phase), then lactose induces expression (production phase)
The transition is metabolically natural, not a shock
Works well from 5 mL to 50 L
Lower per-cell expression rate → more soluble protein
Fed-Batch Fermentation
For high-cell-density cultures:
Grow to OD 30–50 (vs OD 2–5 in batch)
Feed glucose at a rate matched to oxygen transfer capacity
Prevents acetate accumulation
10–50x more cells per liter = 10–50x more protein per liter
Tangential Flow Filtration (TFF) for Concentration
At scale, centrifugal concentrators are impractical. TFF provides:
Continuous concentration with minimal protein loss
Simultaneous buffer exchange (diafiltration mode)
Scalable from 100 mL to 100 L
Less membrane fouling than dead-end filtration
The Bottom Line
Bench Scale (50 mL) | What Changes at 5 L | Solution |
|---|---|---|
Good oxygen transfer in shake flask | Oxygen becomes limiting | DO cascade, fed-batch, lower cell density |
Instant IPTG mixing | Inducer gradients | Autoinduction media, slow addition |
Quick temperature changes | Thermal lag | Pre-cool before induction |
Sonication for lysis | Doesn't scale | Microfluidizer or homogenizer |
1 mL column, 1 hour | Needs 100 mL column, 8 hours | Batch binding, larger columns, parallel processing |
4-hour total processing | 18-hour processing | Protease inhibitors, cold chain, plan for speed |
No foam | Foam + antifoam interference | Mechanical defoaming, compatible antifoams |
The fundamental lesson: Scale-up is a discipline, not just a bigger version of your bench protocol. The proteins that scale successfully are the ones where the researcher anticipated the differences in physics, chemistry, and timing—and designed around them from the start.
Designing for Scale with Orbion
Orbion's Bench module generates experimental protocols that consider practical constraints including expression scale. Protocol generation accounts for protein-specific properties—predicted aggregation propensity (AstraUNFOLD), expression system suitability (AstraSUIT), and construct design—to recommend expression and purification strategies that are more likely to survive scale-up.
The Quick Screening mode provides baseline protocols across categories (expression, purification, crystallization, stabilization), while Custom Design mode generates goal-driven protocols with construct awareness. By identifying potential problems computationally—disorder-driven aggregation, cofactor requirements, suboptimal expression system choice—before scaling, you avoid discovering these issues at the 5 L stage where each failed batch costs thousands in media, time, and researcher frustration.
References
Studier FW. (2005). Protein production by auto-induction in high-density shaking cultures. Protein Expression and Purification, 41(1):207-234. Link
Eiteman MA & Altman E. (2006). Overcoming acetate in Escherichia coli recombinant protein fermentations. Trends in Biotechnology, 24(11):530-536. Link
Rosano GL & Ceccarelli EA. (2014). Recombinant protein expression in Escherichia coli: advances and challenges. Frontiers in Microbiology, 5:172. PMC4029002
Tripathi NK & Shrivastava A. (2019). Recent developments in bioprocessing of recombinant proteins: expression hosts and process development. Frontiers in Bioengineering and Biotechnology, 7:420. PMC6930181
Shiloach J & Fass R. (2005). Growing E. coli to high cell density—a historical perspective on method development. Biotechnology Advances, 23(5):345-357. Link
Garcia-Ochoa F & Gomez E. (2009). Bioreactor scale-up and oxygen transfer rate in microbial processes: an overview. Biotechnology Advances, 27(2):153-176. Link
Wurm FM. (2004). Production of recombinant protein therapeutics in cultivated mammalian cells. Nature Biotechnology, 22:1393-1398. Link
Rathore AS, et al. (2015). Quality by design for biopharmaceuticals. Nature Biotechnology, 27:26-34. Link
Li F, et al. (2010). Cell culture processes for monoclonal antibody production. mAbs, 2(5):466-479. PMC2958569
Gupta SK & Shukla P. (2017). Microbial platform technology for recombinant antibody fragment production: A review. Critical Reviews in Microbiology, 43(1):31-42. Link
Book a 20-Minute Demo
Sign up free for unlimited Overview runs — summary, sequence-based analysis, homology search. For the full Characterization — PTMs, binding sites, stability variants, construct design — book a demo and we'll run your target live.
