Blog
Orbion Team
Why Your Crystal Diffracts to 2 Å But Won't Solve
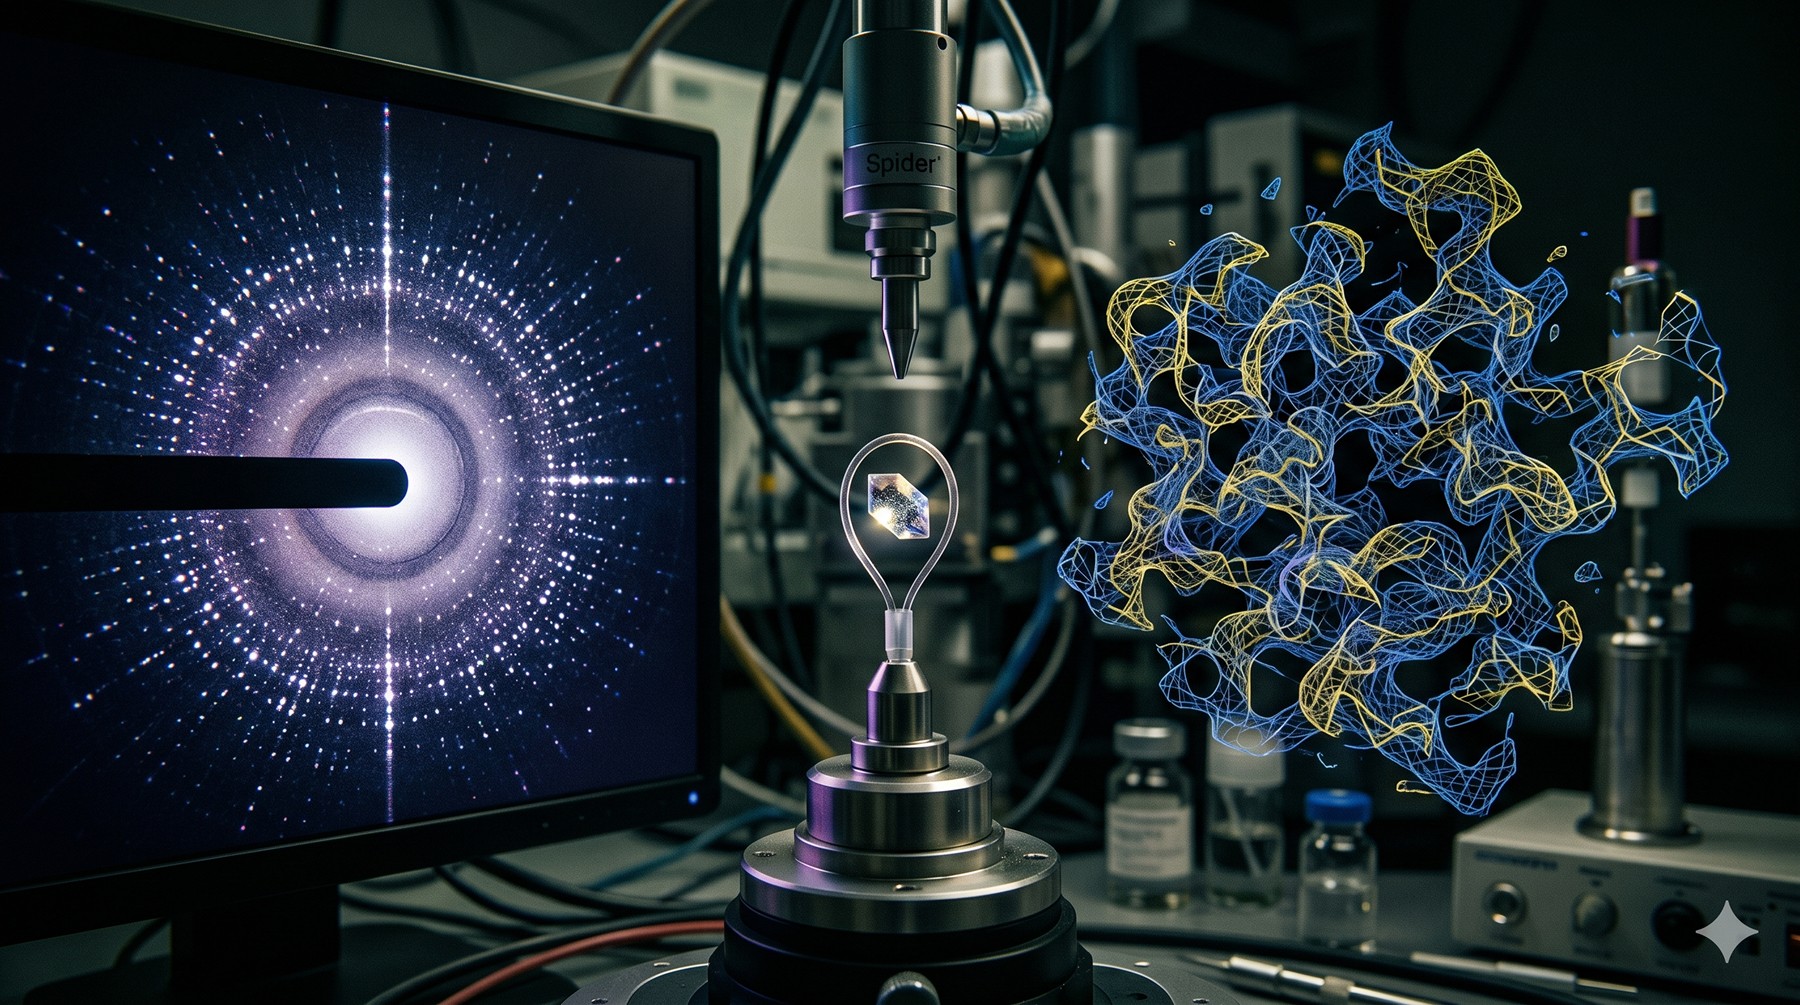
You spent eighteen months crystallizing the target. The hexagonal plates are gorgeous, the synchrotron data scales beautifully, and the merging statistics rival anything in your group's portfolio—2.0 Å resolution, CC₁/₂ above 0.9 in the outer shell, low Rmerge in the inner shells. Then you run Phaser with what should be a sensible search model and get a TFZ of 4.7. You try MOLREP. You try MrBUMP. You try every AlphaFold model variant you can generate. Nothing solves. The map, when you eventually force a solution, is unreadable noise.
This is one of the most demoralizing failure modes in structural biology: the experiment worked, the crystal worked, the beamline worked—and yet there is no structure. Phasing failure is rarely a single problem. It is usually a stacked set of small problems that each erode the signal-to-noise of molecular replacement until the correct solution sinks below the algorithm's detection threshold. Diagnosing which problems are stacked is the difference between solving in a week and abandoning the project.
Key Takeaways
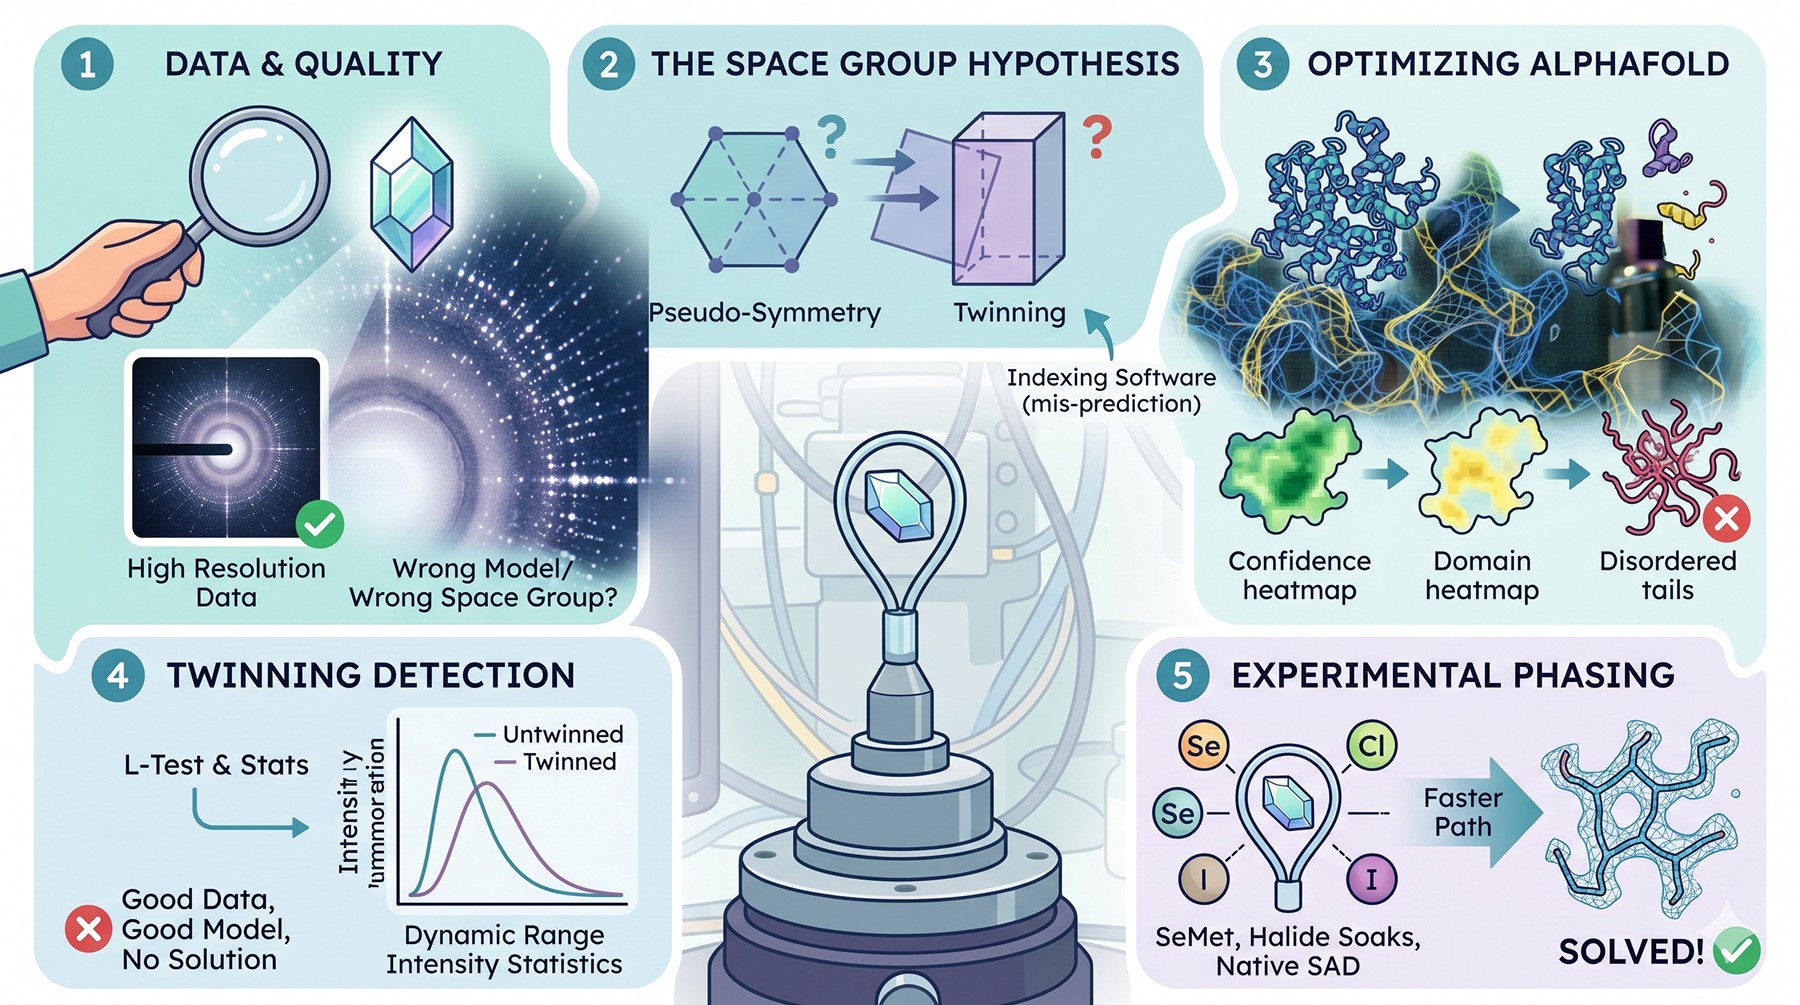
Diffraction quality does not guarantee phasability—good data with the wrong model or wrong space group is unsolvable
The space group is a hypothesis, not a fact: pseudo-symmetry and twinning routinely fool indexing software, and the "right" Laue class can hide multiple candidate point groups
AlphaFold models transformed MR but only when trimmed by pLDDT, split by PAE-defined domain boundaries, and stripped of disordered tails
Twinning is more common than reported—the L-test and intensity statistics catch it; an unsolvable MR with a "good" model is often a twinning problem
When MR truly fails, experimental phasing is not a fallback but a primary route—SeMet, halide soaks, and native SAD are faster than another year of model fiddling
The Anatomy of an MR Failure
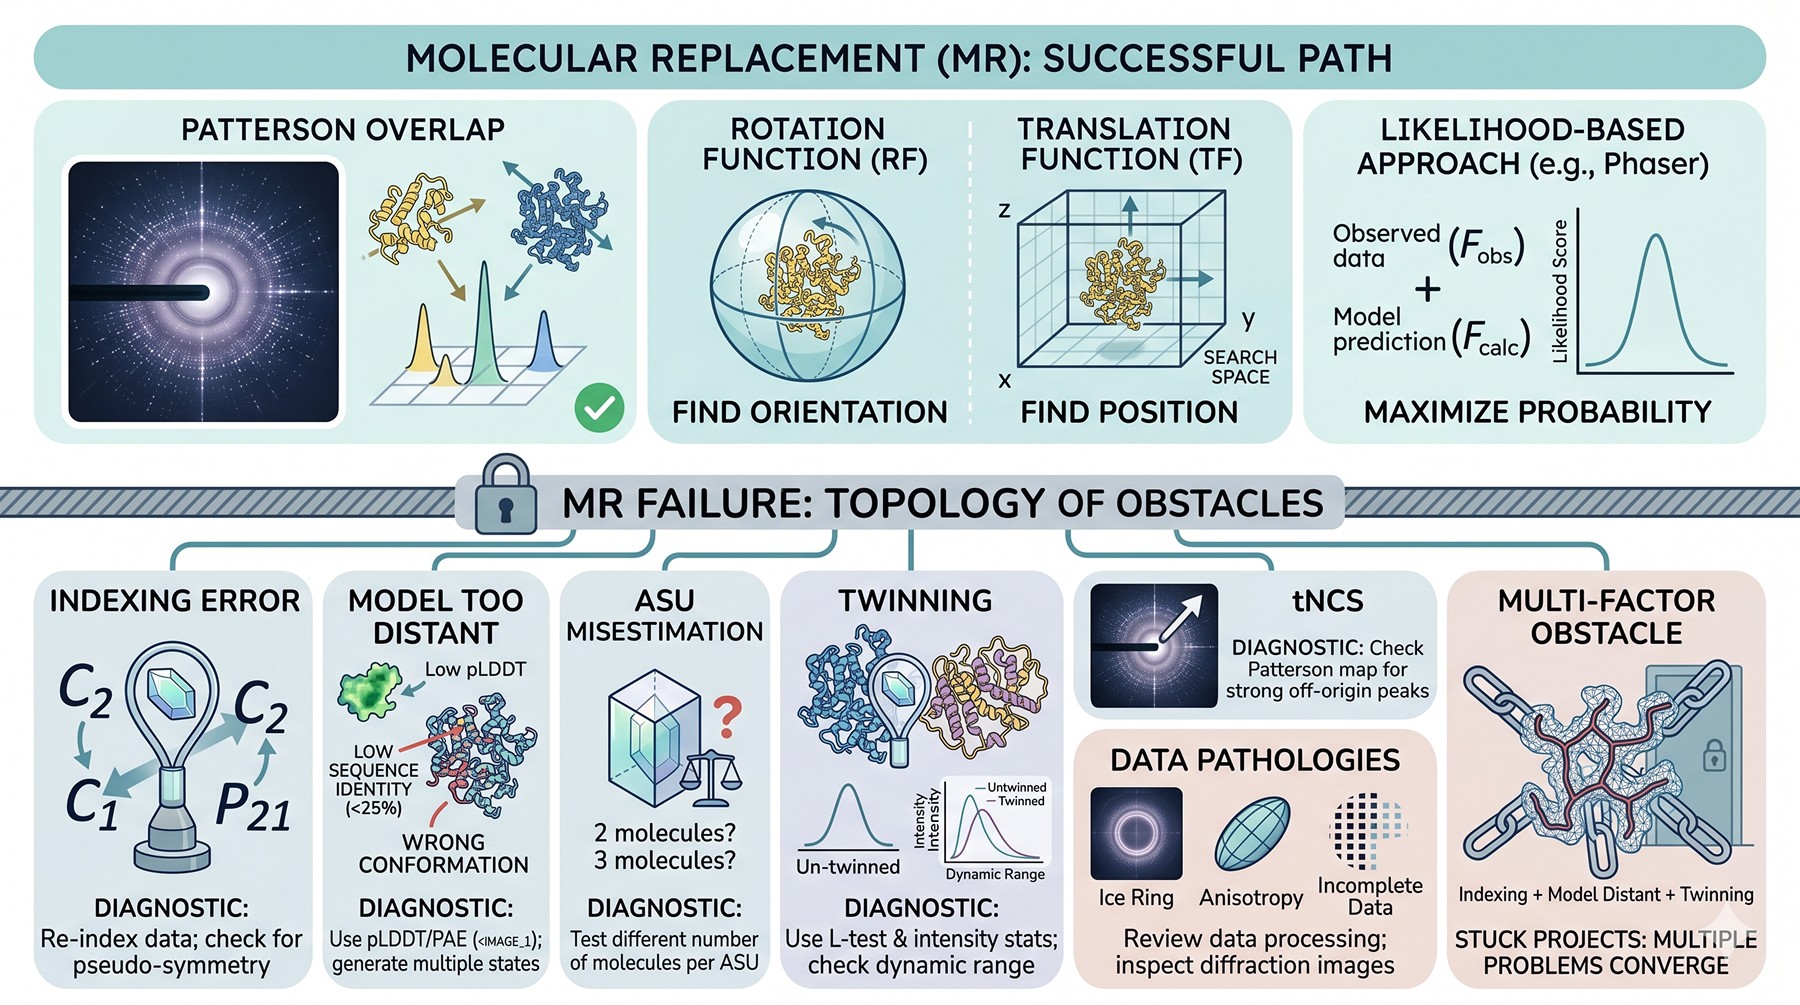
Molecular replacement works because the Patterson function of a correctly placed model overlaps the Patterson function of the true structure. The rotation function identifies the orientation; the translation function identifies the position. Phaser's likelihood-based approach replaced the older Patterson search with a statistical formulation that estimates the probability of the model being correctly placed given the observed structure factors (McCoy et al., 2007).
When this fails, the failure has a topology. Roughly:
Indexing was wrong — the cell or space group is misidentified, so the search space is fundamentally incorrect
The model is too distant — sequence identity below ~25–30 % or a wrong conformational state defeats rotation searches
The asymmetric unit is misestimated — the wrong number of molecules per ASU collapses the translation function
Twinning — the observed intensities are weighted sums of intensities from two lattices, and the model never matches
Translational non-crystallographic symmetry (tNCS) — strong off-origin Patterson peaks distort the rotation function statistics
The data are pathological in a way that statistics didn't catch — ice rings, anisotropy, severely incomplete data, radiation damage
Most stuck projects are not stuck on one of these. They are stuck on two or three simultaneously. Below we work through each, with the diagnostic tests that distinguish them.
Before Anything Else: Verify the Data Are What You Think They Are
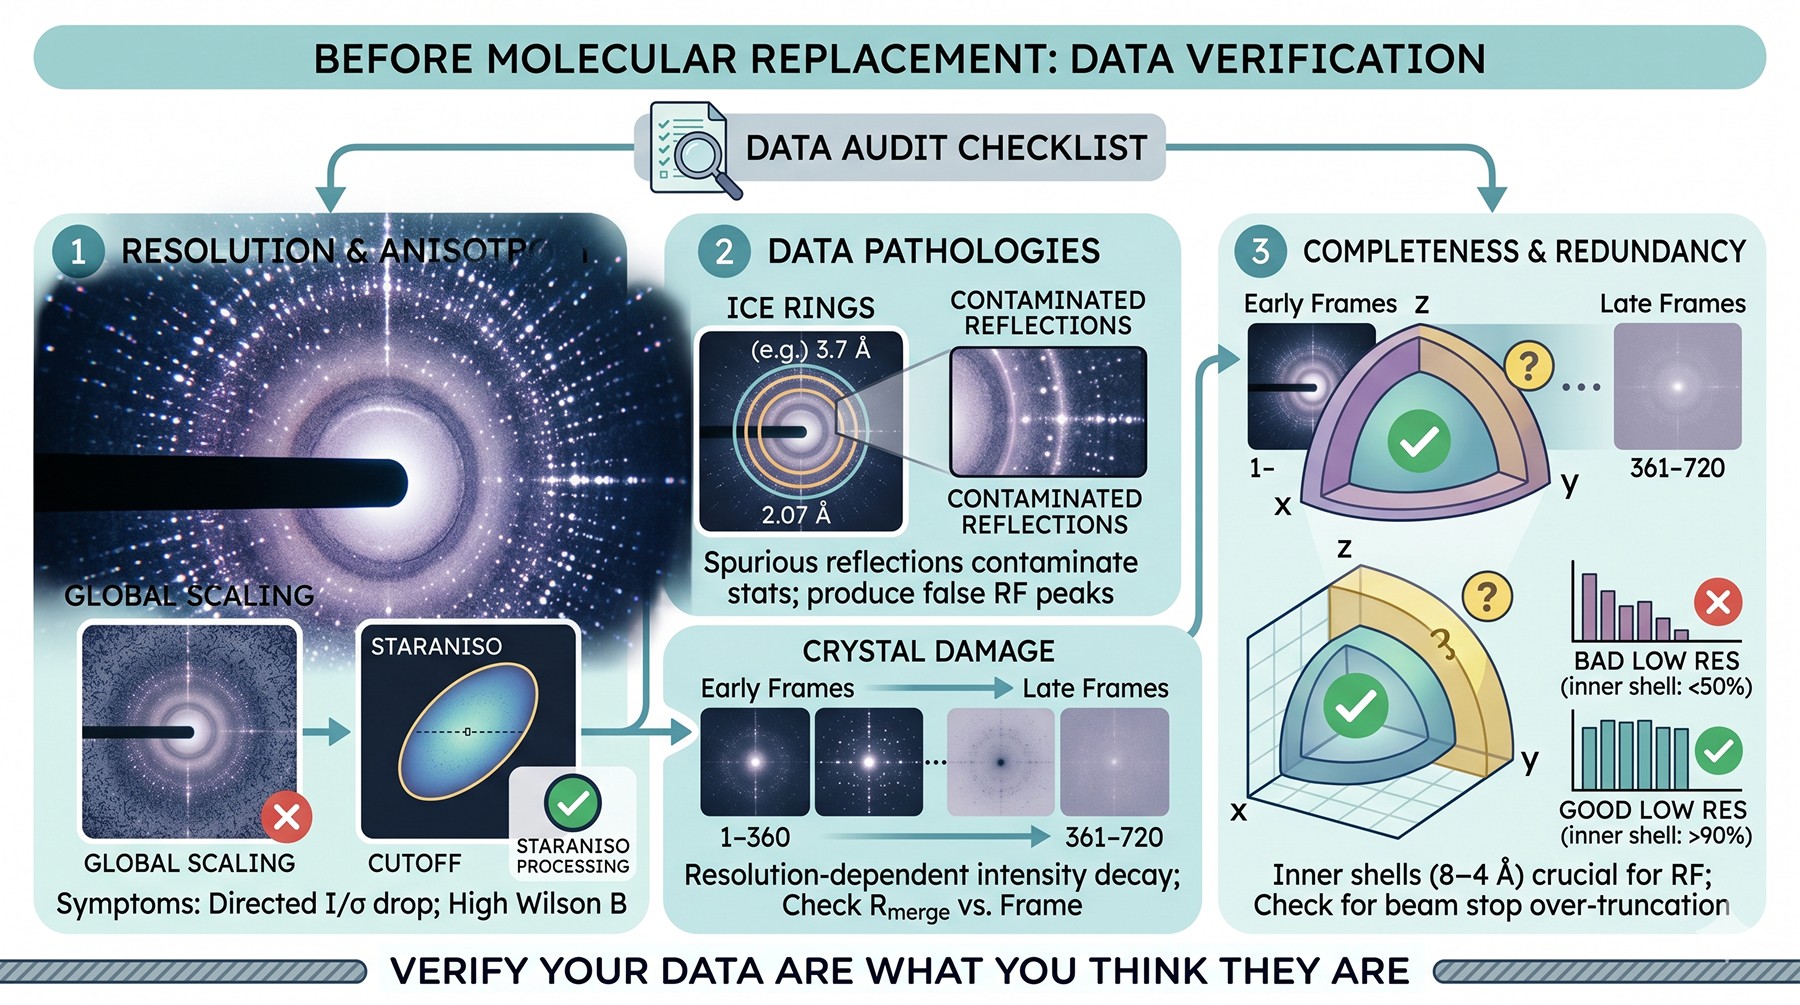
Before exhausting MR strategies, spend an hour verifying the data themselves. A surprising fraction of "unsolvable" datasets have pathologies that no MR strategy will overcome until the data are reprocessed.
Resolution truncation and anisotropy
A nominal 2.0 Å dataset may have 2.0 Å along one axis and 3.2 Å along another. Anisotropic diffraction is common in proteins with elongated domains, flexible loops, or weak crystal packing in one direction. If your data are scaled to 2.0 Å globally but only the strong axis genuinely reaches that resolution, the high-resolution shells along the weak axes are noise.
The STARANISO server (Tickle et al., 2018) detects anisotropy from the diffraction limit surface and applies an ellipsoidal cutoff. Reprocessing with anisotropic truncation often improves MR signal substantially because the rotation function is no longer matching the model against noise reflections.
Symptoms of unrecognized anisotropy:
Mean I/σ(I) varies strongly with direction in reciprocal space
⟨I⟩ falls off faster along one direction than another
Wilson B-factor higher than expected for the apparent resolution
MR rotation function dominated by reflections along the strong axis
Ice rings and crystal damage
Ice rings (around 3.9, 3.7, 3.4, 2.7, 2.25, 2.07 Å) introduce spurious strong reflections that contaminate intensity statistics and can produce false rotation function peaks. Most processing software excludes them by default, but check the exclusion ranges in your log file. Radiation damage manifests as resolution-dependent intensity decay across the dataset—if the later images have noticeably higher Rmerge contributions, truncate or use only the early frames.
Completeness and redundancy
For MR, completeness in the inner shells (8–4 Å) matters more than the high-resolution completeness. A 95 % complete dataset with 50 % completeness below 4 Å will defeat the rotation function even with a perfect model, because the rotation function is driven by low- to mid-resolution data. Many beamline pipelines default to truncating intense low-resolution reflections at the detector beam stop—check that the inner shells are actually present.
Space Group and Indexing: The Hypothesis That Eats Months
XDS, DIALS, and HKL2000 will all give you a space group. They will all be confident. They will sometimes be wrong.
Why indexing gets the space group wrong
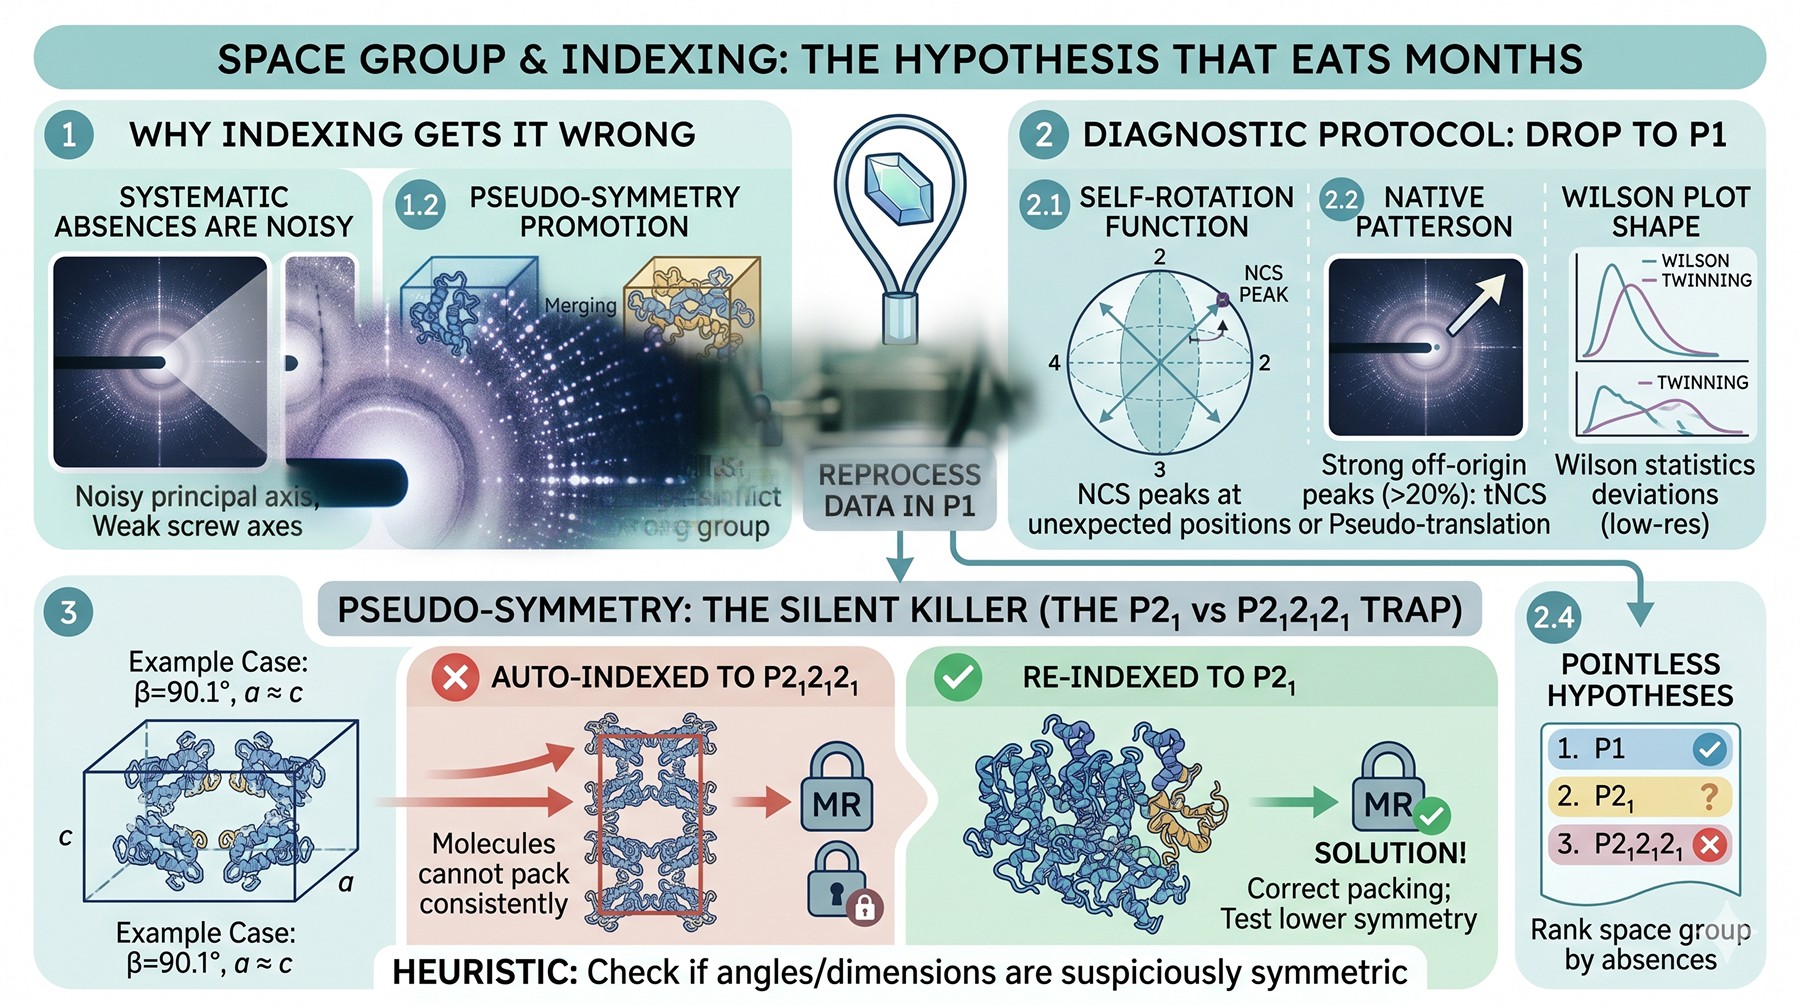
Indexing assigns a Laue class based on intensity correlations between symmetry-equivalent reflections. The Laue class is genuinely determined by the data. The point group within the Laue class, and the screw axes that elevate it to a full space group, are determined by systematic absences along the principal axes—and systematic absences are noisy in real datasets. A weakly populated screw axis with a borderline-significant 2₁ absence pattern can be assigned to the wrong space group.
Worse: pseudo-symmetry can promote a crystal from a true lower-symmetry group (say P2₁) into an apparent higher-symmetry group (P2₁2₁2₁) if the cell dimensions happen to match. The merging statistics look fine. The MR fails because the true asymmetric unit contains more copies than the indexed space group implies.
The diagnostic protocol
When MR fails with a reasonable model, always reprocess in the lowest-symmetry candidate in the Laue class. P1 will always merge—but the question is whether P1 reveals NCS that suggests a higher true symmetry, or whether you find a self-rotation peak at a position the originally assigned space group doesn't predict.
Look at:
Self-rotation function in MOLREP or Phaser. NCS peaks at unexpected positions reveal that your real symmetry is different from your assumed symmetry
Native Patterson (off-origin peaks > 20 % of origin peak indicate tNCS or pseudo-translation)
Wilson plot shape in the low-resolution region (severe deviations from Wilson statistics suggest twinning or tNCS)
Pointless in CCP4 will rank space group hypotheses by their consistency with systematic absences
Pseudo-symmetry: the silent killer
If your true space group is P2₁ but the β angle is very close to 90° and a and c are similar, you may index as P2₁2₁2₁. The MR will fail not because the model is bad, but because there is no solution in that space group—the molecule cannot pack consistently with the imposed symmetry. The fix is to drop to P2₁ and try again.
A useful heuristic: if your unit cell dimensions or angles are suspiciously close to a higher-symmetry value (β = 90.1°, a ≈ c), test the lower symmetry as well.
Model Quality: The Distance Problem
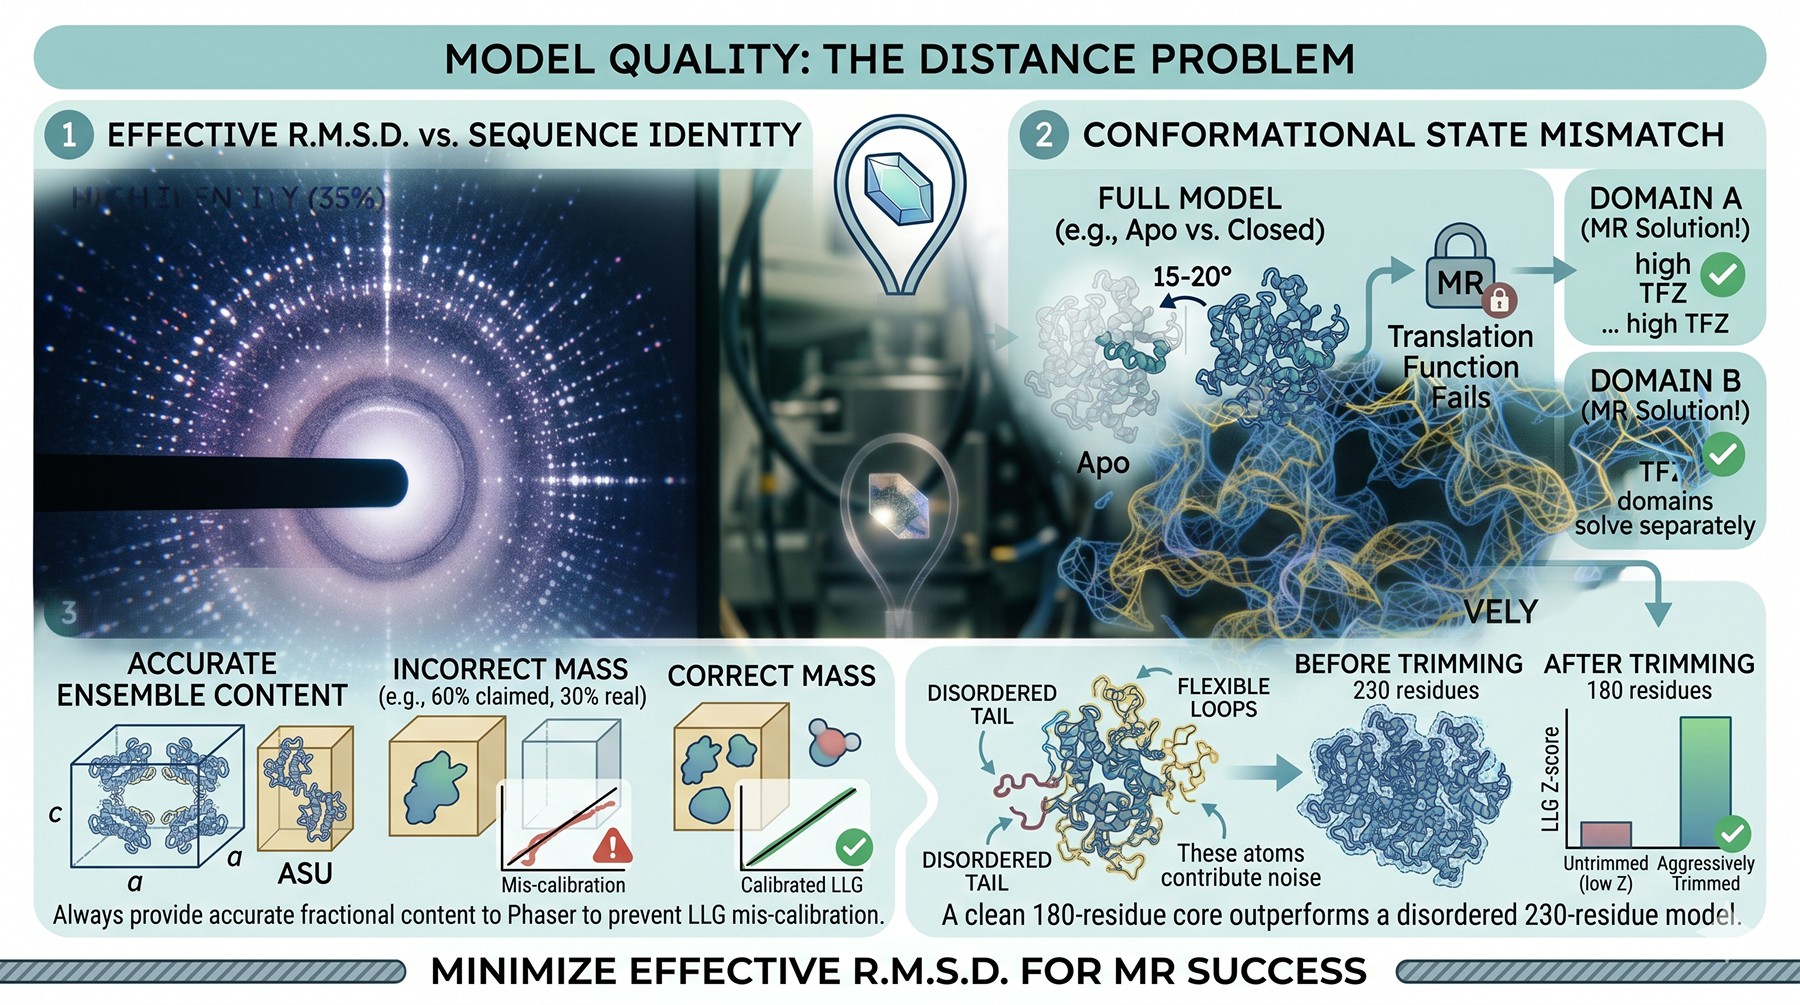
Phaser's effective resolution for MR drops rapidly with sequence identity. A 35 % identity model with the correct fold and conformation often solves at 3.0 Å. A 20 % identity model at the same resolution usually does not. The relationship between identity and rotation function signal is highly nonlinear, and it is dominated by the structural divergence of side chains and surface loops, not the identity itself.
Read's classic analysis (Read, 2001) established the framework: the model's effective r.m.s.d. from the target predicts MR success better than sequence identity, and the contribution of correctly placed atoms grows nonlinearly with rotation Z-score.
Conformational state mismatch
This is the most insidious form of model failure. Your model has the right fold, right family, even high identity—but it is in the apo state and your crystal is in a closed/liganded state. Domain rotations of even 15–20° between states will destroy the translation function for a multi-domain protein.
The diagnostic: try domain decomposition. Split the model into the most rigid sub-units (using DALI, DynDom, or visual inspection) and run MR with each fragment independently. If two domains place well separately but the full protein doesn't place at all, you have a hinge motion that the rigid model couldn't accommodate.
Missing or extra mass
Phaser uses estimated solvent content to calibrate its likelihood. If you tell it the model represents 60 % of the asymmetric unit mass and it actually represents 30 % (because you ran MR with a single domain of a four-domain protein), the LLG numbers are mis-calibrated and TFZ becomes unreliable. Always provide accurate ensemble fractional content to Phaser.
Conversely, if your model contains flexible tails, intrinsically disordered regions, or loops that are not present in the crystallized construct, those atoms contribute noise to the rotation function. Trim aggressively. A 180-residue rigid core typically outperforms a 230-residue model that includes 50 residues of probable disorder.
AlphaFold Models for MR: Use, but Use Properly
AlphaFold has changed the calculus of MR dramatically. In families where no useful template existed, AF2 now provides models that solve crystals routinely (Pereira et al., 2021). But naive use—taking the top-ranked AF2 PDB and feeding it directly to Phaser—still fails frequently, and the failures are often misdiagnosed as "AlphaFold doesn't work for my protein" when the real problem is preparation.
Trim by pLDDT
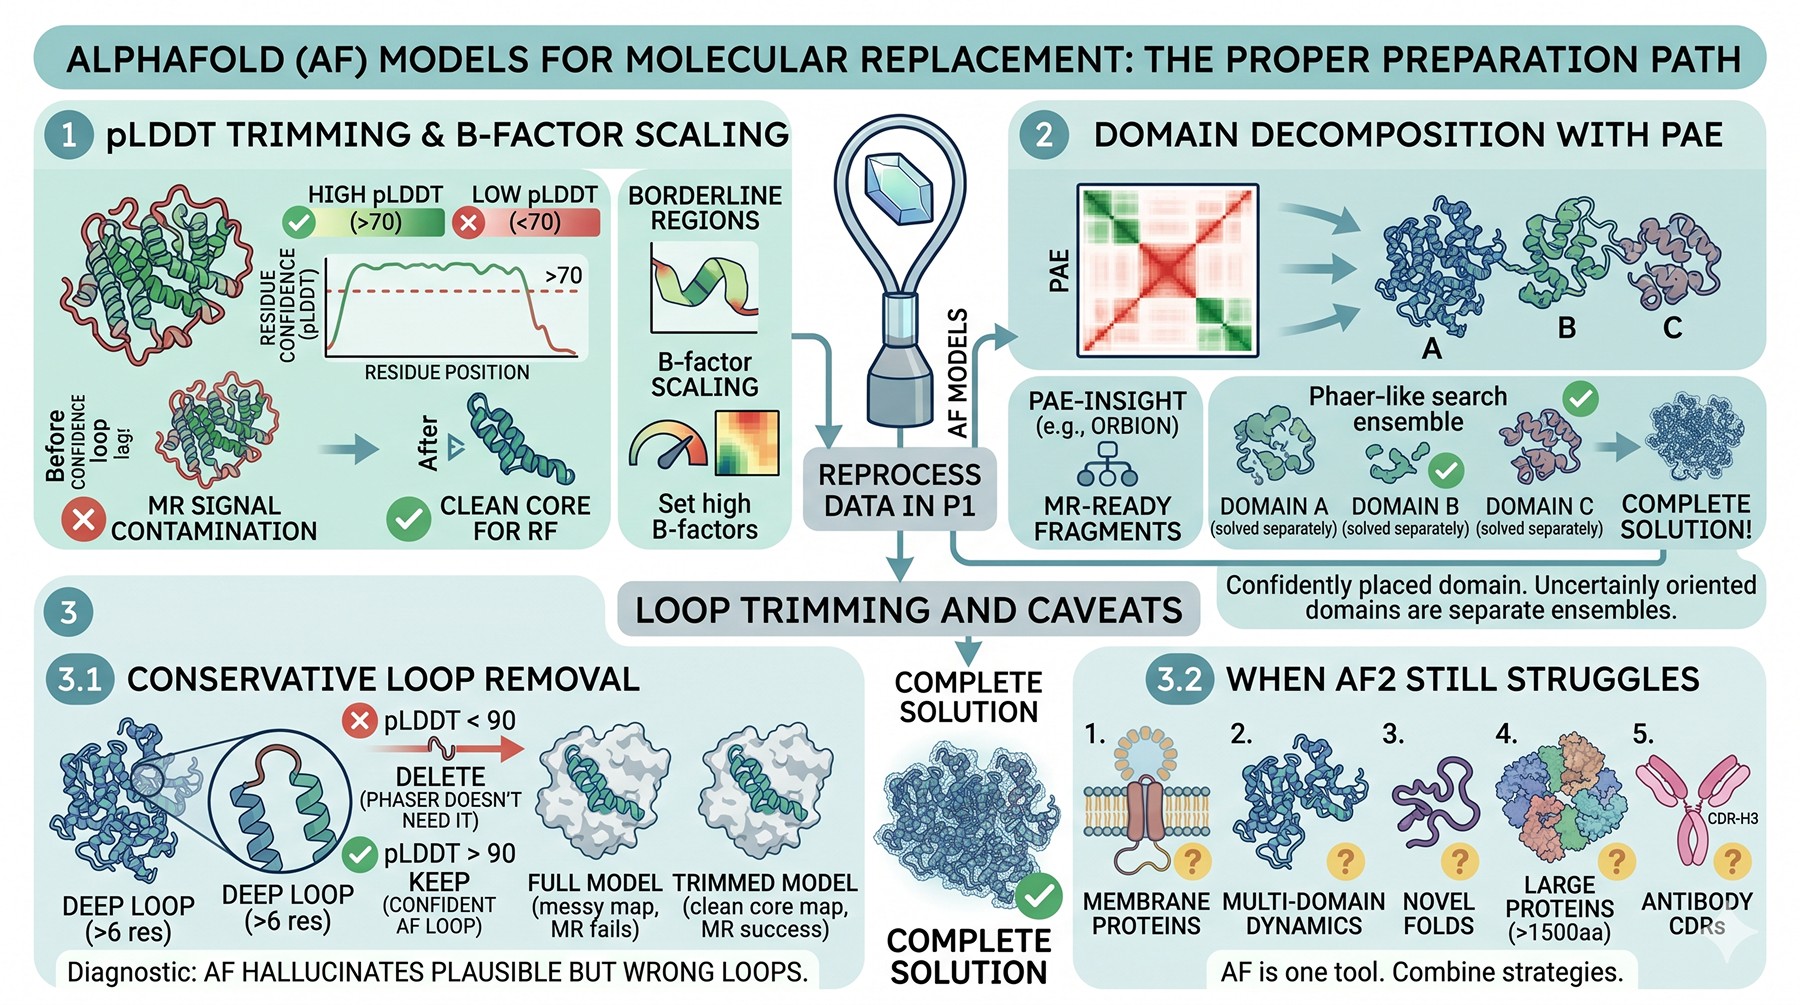
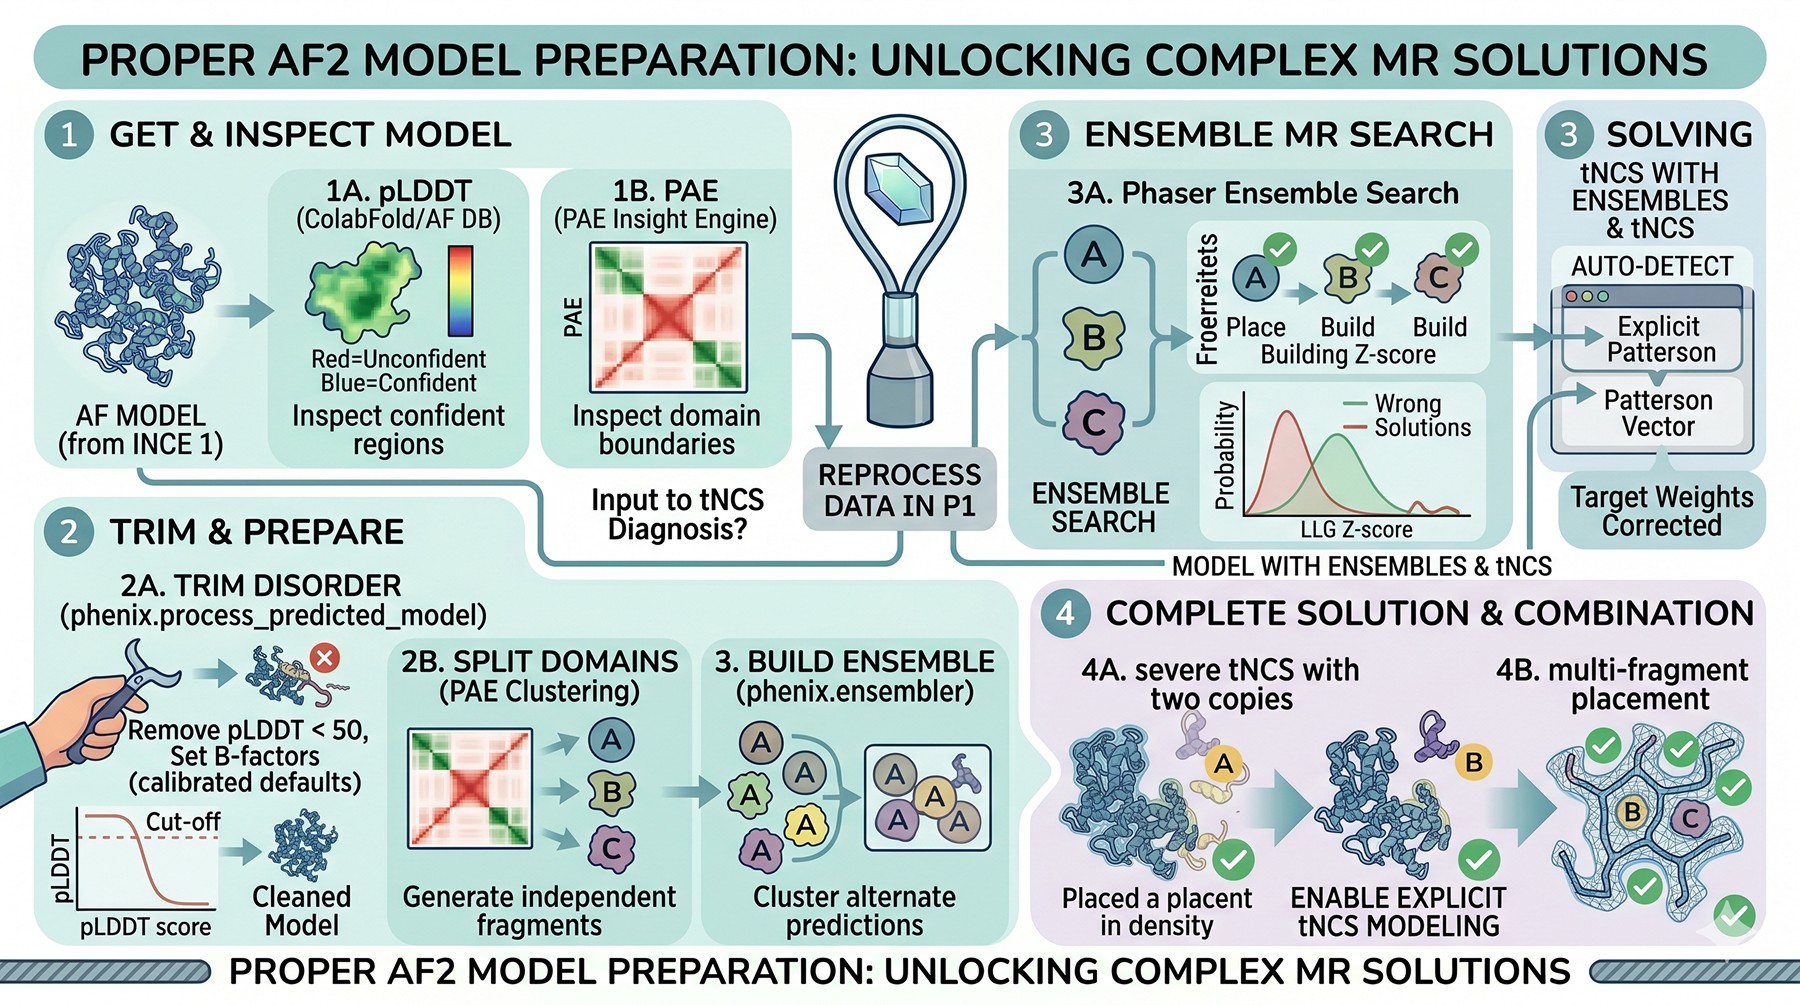
AlphaFold's pLDDT score is the per-residue confidence. Residues with pLDDT < 70 should generally be removed for MR, not because they are wrong, but because they are placed with high uncertainty relative to the rest of the model. A loop with pLDDT = 40 is often nearly random; including it in the search model contaminates the rotation function.
A pragmatic cut: remove residues with pLDDT < 70 entirely. For borderline regions (pLDDT 70–85), set B-factors to a high value (e.g., 50–80 Ų) so they contribute proportionally less to the structure factor calculation. Many groups now use the pLDDT directly as a per-residue B-factor proxy, scaled appropriately.
Split by PAE-defined domain boundaries
The Predicted Aligned Error matrix reveals which parts of an AlphaFold model are confidently placed relative to one another. Two domains with low intra-domain PAE but high inter-domain PAE are individually well-modeled but uncertainly oriented relative to each other. For MR, treat them as separate search ensembles.
This is where Orbion's PAE Insight Engine produces immediately actionable output: domain boundaries derived from PAE clustering are usually better MR fragments than boundaries from sequence-based or pLDDT-based cuts alone. A single AF2 model can yield three or four MR-suitable fragments, each placed independently by Phaser, which then dramatically improves the chance of a complete solution.
Don't trust loops, do trust cores
AF2 hallucinates plausible-looking loops in regions with weak template signal. These loops are often wrong, but pLDDT may not flag them strongly if the surrounding context is high-confidence. The conservative practice for MR is: delete every loop longer than ~6 residues that connects two well-modeled secondary structure elements, unless pLDDT > 90 across the loop. Phaser does not need the loops to solve; you can rebuild them in COOT once you have a map.
When AF2 doesn't help
AF2 still struggles with:
Membrane proteins in detergent or in non-canonical conformational states
Multi-domain proteins where domain orientation varies with binding partner
Proteins with novel folds that aren't represented in the training set
Very large proteins (> 1500 residues) where confidence drops globally
Antibody CDRs, particularly CDR-H3, which AF2 reproduces poorly
For these cases, AF2 is one tool among several—ensemble approaches that combine AF2 with homology models, with truncated AF2 models, and with experimental templates often work where any single model fails.
MR Failure Signatures and Remedies
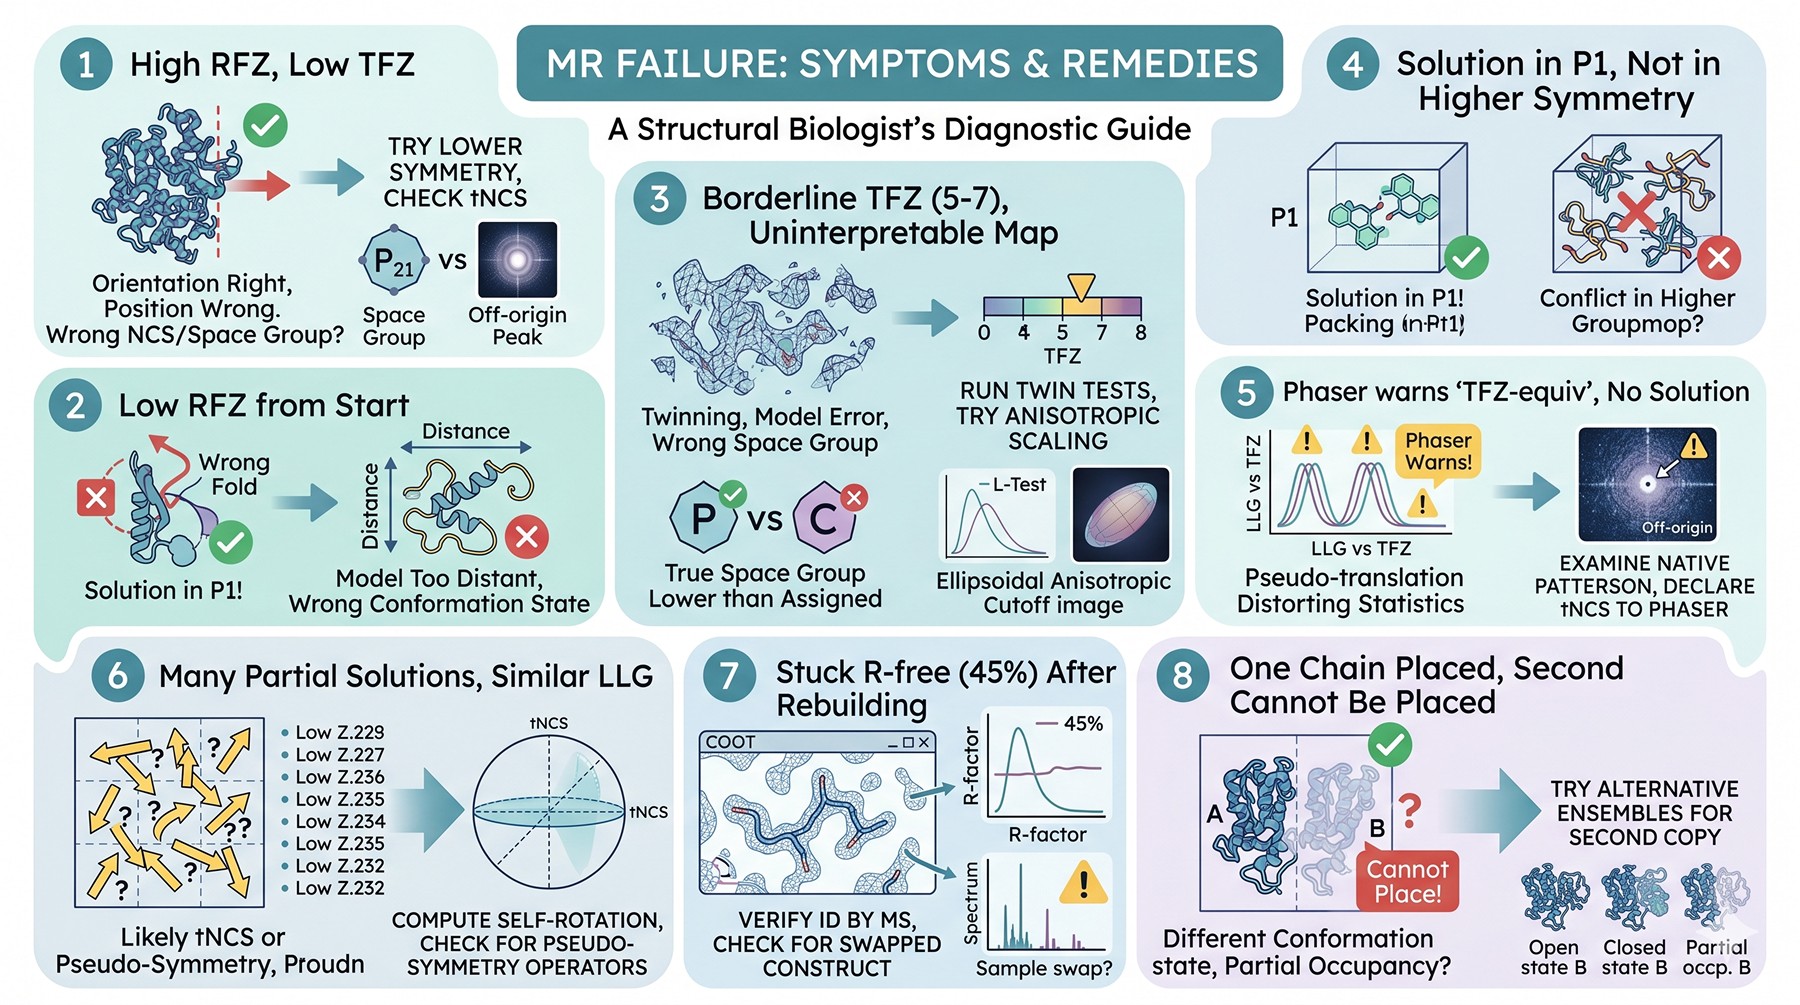
The pattern of failure is diagnostic. Run through this table when your TFZ is too low to trust:
Signature | Likely cause | First action |
|---|---|---|
High RFZ, low TFZ | Orientation right, position wrong; wrong NCS or wrong space group | Try lower symmetry; check tNCS |
Low RFZ from start | Model too distant or wrong conformational state | Trim model; try ensemble; split into domains |
TFZ borderline (5–7) but map is uninterpretable | Twinning, severe model error, or wrong space group | Run twin tests; try anisotropic scaling |
Solution in P1 but not in higher symmetry | True space group is lower than assigned | Reprocess in candidate lower symmetry group |
Phaser warns "TFZ-equiv" but no acceptable solution | Pseudo-translation distorting statistics | Examine native Patterson; declare tNCS to Phaser |
Many partial solutions with similar LLG | Likely tNCS or pseudo-symmetry | Compute self-rotation; check for pseudo-symmetry operators |
Solution found, but R-free stuck at 45 % after rebuilding | Wrong sequence registration or wrong protein | Verify ID by MS; check for swapped construct |
MR finds one chain, can't place the second | Different conformational state for chain B, or partial occupancy | Try alternative ensembles for second copy |
Case Study: When Three Problems Stacked
A group brought us a stuck project. The protein was a 38-kDa enzyme, crystallized in what their pipeline called P3₂21 with cell dimensions a = b = 81.4 Å, c = 110.2 Å. The data extended to 2.1 Å with respectable merging statistics. They had tried MR with eight different AlphaFold variants, three homology models, and combinations of fragments. Phaser's best TFZ was 5.2, which is in the "maybe, maybe not" zone.
The diagnostic walk-through
The first test was the L-test. ⟨|L|⟩ came back at 0.44, well below the expected 0.50 for untwinned data. Twinning was a strong possibility.
The second test was the native Patterson. An off-origin peak at (0, 0.5, 0.5) reached 32 % of the origin peak—unambiguous translational NCS along (b+c)/2.
The third test was a Pointless reanalysis. The space group ranked nearly equally between P3₂21 and P3₂. The systematic absences along the c axis were borderline.
What had been happening
The crystal was actually P3₂, not P3₂21. The twofold axis was approximate (NCS, not crystallographic), creating apparent P3₂21 symmetry that fooled the indexing. Two molecules per ASU in P3₂21 became four molecules per ASU in P3₂, related by a pseudo-translation. The pseudo-twofold and the tNCS together created intensity statistics that mimicked partial twinning.
MR in P3₂ with tNCS declared explicitly, using AF2 fragments split by PAE boundaries, solved in 40 minutes. The R-free dropped from "stuck at 42 %" to refining cleanly through 28 % within two days of rebuilding.
The total time invested in the wrong space group: nine months.
The time it would have cost to run the diagnostics on day one: under two hours.
This is the rule: when you are stuck, the diagnostics are cheap and the stuckness is expensive. Run them.
Twinning: The Diagnostic Checklist
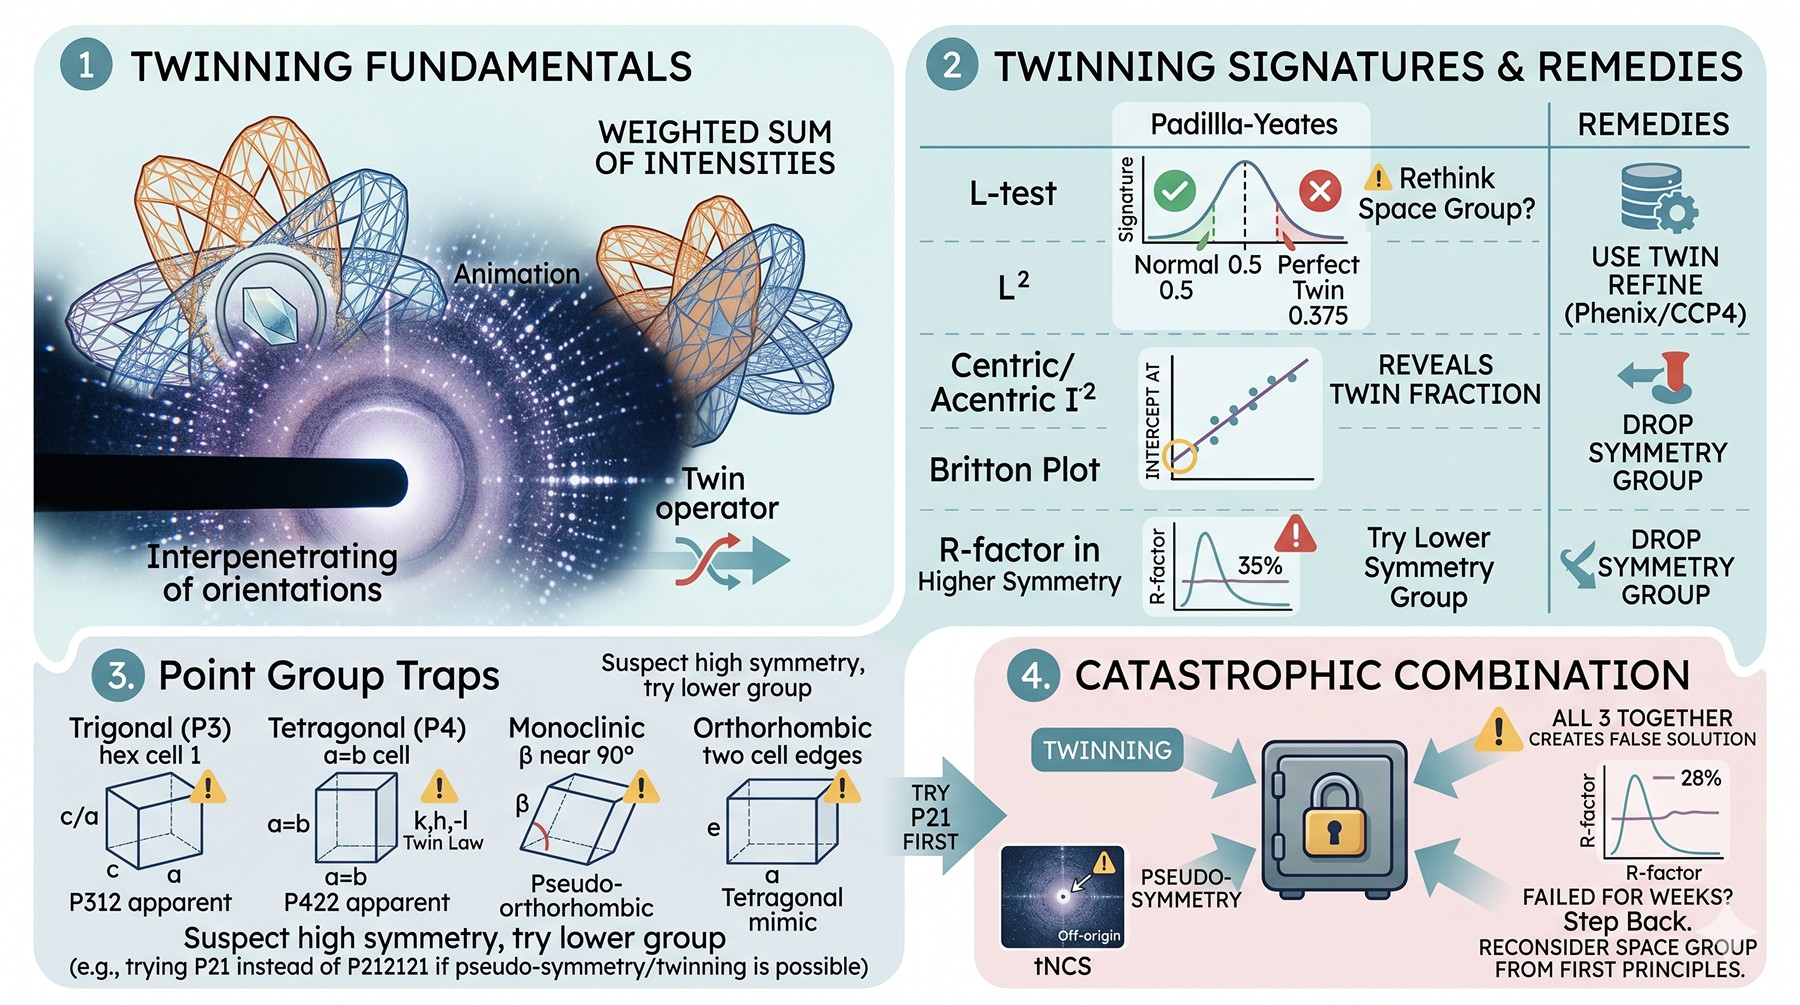
Twinning is when a crystal contains two (or more) crystallographically equivalent domains in different orientations, related by a twin operator that is not a true symmetry of the crystal. The observed intensities are weighted sums of the intensities from each twin domain. Yeates and Fam (1999) introduced the L-test, which detects twinning from intensity statistics without requiring prior knowledge of the twin law (Yeates, 1997).
Signs of twinning
Test | Normal value | Perfect twinning value | What to do |
|---|---|---|---|
⟨|L|⟩ (Padilla–Yeates L-test) | 0.500 | 0.375 | If < 0.45, twinning is likely |
⟨L²⟩ | 0.333 | 0.200 | If < 0.30, twinning is likely |
⟨I²⟩/⟨I⟩² (centric) | 3.0 | 2.0 | Deviation suggests twinning |
⟨I²⟩/⟨I⟩² (acentric) | 2.0 | 1.5 | Deviation suggests twinning |
Britton plot | Linear, intercept at 0 | Linear, intercept at twin fraction | Reveals twin fraction directly |
R-factor in suspect space group | Low | Stuck at 30–40 % | Try lower-symmetry group |
Twin laws by point group
Twinning is possible only when the crystal lattice possesses a higher symmetry than the crystal structure. Common cases:
Trigonal/hexagonal cells with c/a near 1: possible merohedral twinning in P3 (twin law h, -h-k, -l or k, h, -l)
Tetragonal P4 systems: twin law k, h, -l reproduces P422 apparent symmetry
Monoclinic with β near 90°: pseudo-orthorhombic twinning
Orthorhombic with two cell edges nearly equal: tetragonal-mimicking twinning
When the L-test shows twinning and your space group is one of these high-symmetry candidates with suspicious cell dimensions, always try the lower-symmetry group first. Phenix and CCP4 both implement twinned refinement (twin_law parameter); if the true space group is the lower one and twinning is present, MR in the lower group with twin-aware refinement will solve and refine sensibly.
The catastrophic combination
The worst case is twinning plus pseudo-symmetry plus tNCS. Each individually is solvable. All three together creates intensity statistics that look almost normal, MR statistics that look almost promising, and refinement R-factors that look almost reasonable—but the solution is wrong. If you have any two of these and MR has failed for weeks, step back and reconsider whether the assumed space group is correct from first principles.
Translational NCS: The Off-Origin Patterson Peak
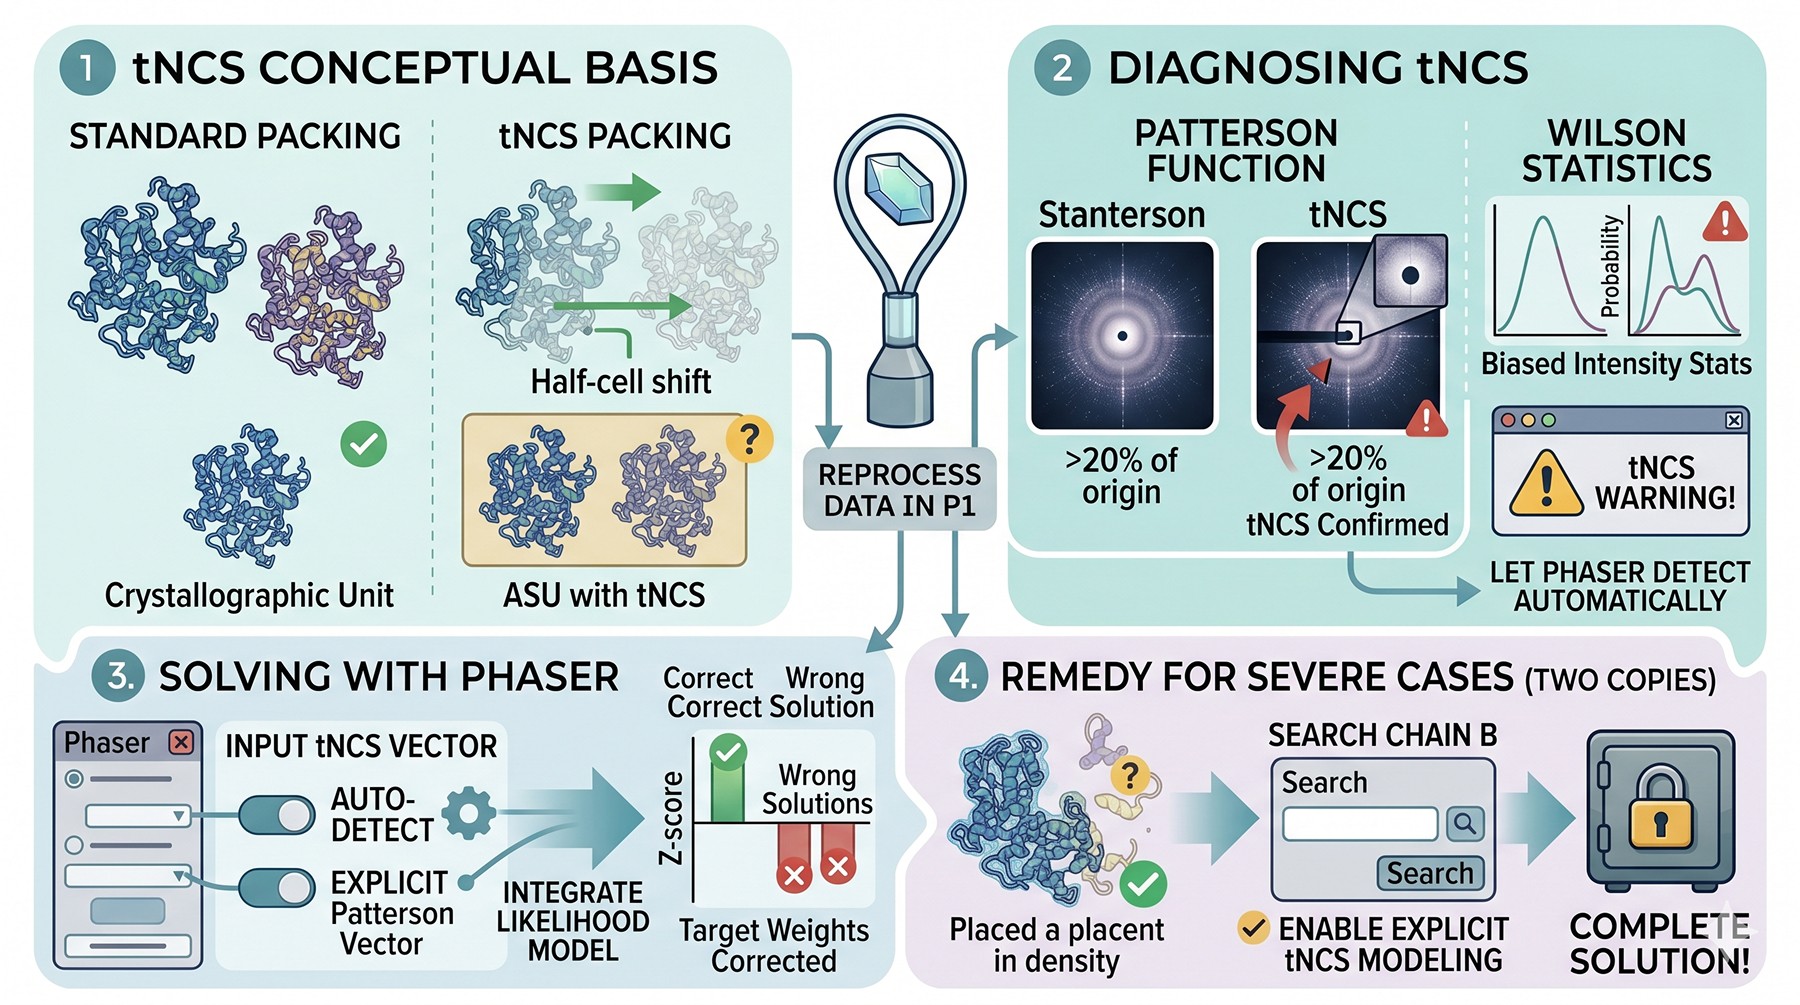
If two molecules in the asymmetric unit are related by a pseudo-translation—say a half-cell shift along one axis—the Patterson function has a strong peak off the origin. This biases intensity statistics: half the reflections become systematically strong, half become systematically weak, breaking the assumption of Wilson statistics.
Diagnosing tNCS
Off-origin Patterson peak > 20 % of origin peak → tNCS confirmed
Wilson plot shows a bimodal intensity distribution at low resolution
Phaser will issue a tNCS warning and incorporate it into the likelihood model automatically if you let it
Solving with tNCS
Phaser's tNCS handling (introduced in 2014 onward, see McCoy et al., 2017) is generally adequate. The key is to let Phaser know about the tNCS vector, either by automatic detection or by feeding it the Patterson vector explicitly. Without the correction, the likelihood targets are mis-weighted and the correct solution may not score above the wrong solutions.
For severe tNCS where two copies of the same protein are nearly translation-related, MR may find one copy easily and then fail to place the second because the second copy's "correct" position is statistically indistinguishable from many wrong positions related by the pseudo-translation. The remedy is to provide the placed first copy as a fixed solution and search for the second copy with explicit tNCS modeling on.
AlphaFold Model Preparation for MR
A practical preparation pipeline for AF2 models:
Step | Tool | What it does |
|---|---|---|
1. Get model | ColabFold / AlphaFold DB | Generate prediction |
2. Inspect pLDDT | PAE Insight Engine / PyMOL | Identify confident regions |
3. Inspect PAE | PAE Insight Engine | Identify domain boundaries |
4. Trim disorder |
| Remove pLDDT < 50, set B-factors |
5. Split domains | Manual / PAE clustering | Generate independent search fragments |
6. Build ensemble |
| Cluster alternate predictions |
7. Run MR | Phaser / MrBUMP / MOLREP | Place each fragment |
8. Combine | Phaser ensemble mode | Multi-fragment search if single-domain fails |
The phenix.process_predicted_model tool (McCoy et al., 2022) automates pLDDT-based trimming and B-factor assignment in a way that is well-calibrated for downstream Phaser likelihood. Use it before manual fiddling—the defaults are usually right.
When MR Truly Fails: Experimental Phasing
If you have exhausted MR strategies—multiple models, all space groups, twin-aware refinement, tNCS handling, every conformational state you can construct—you are in the territory where MR will not solve the structure. Experimental phasing is not a defeat. It is a separate, well-understood pathway, and for many crystals it is the faster route than the next month of MR attempts.
The methods, in order of typical ease
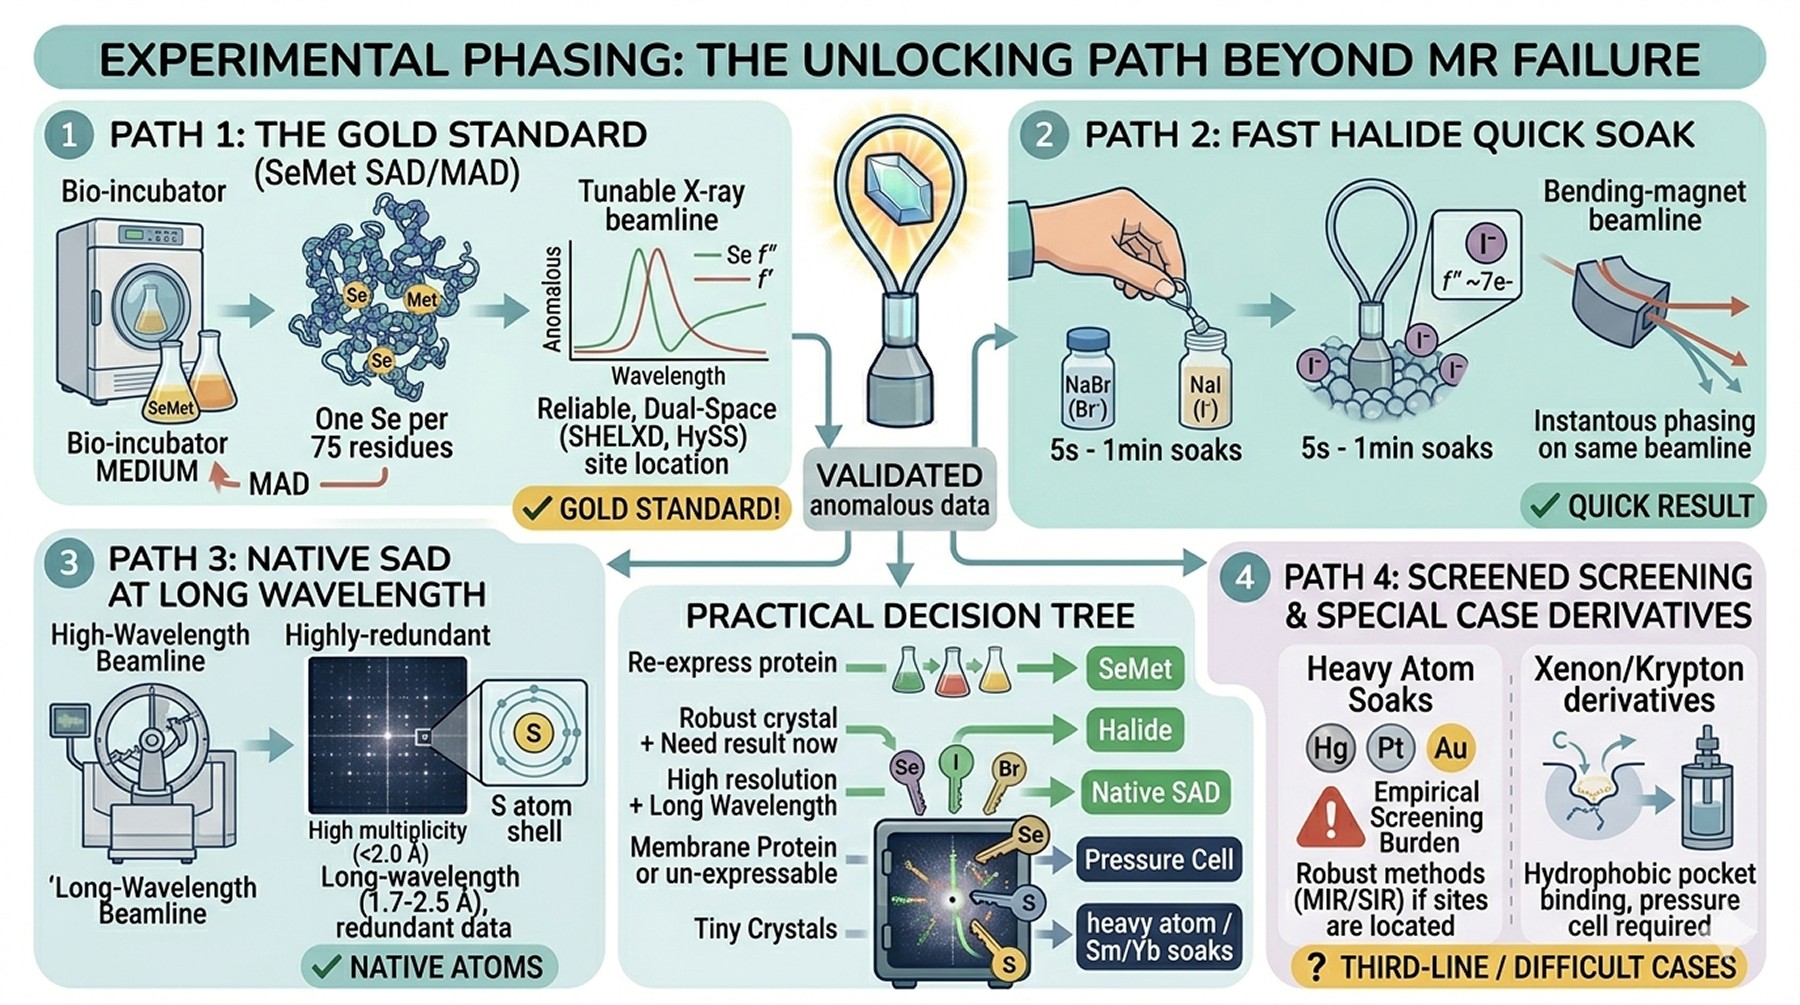
Native SAD (single-wavelength anomalous diffraction from native atoms—mostly sulfur). Requires a long-wavelength beamline (1.7–2.5 Å X-rays), highly redundant data (multiplicity > 20), low-symmetry space groups make this harder. Sulfur f″ at the S K-edge wavelength is ~0.6 e⁻, which is small but sufficient with modern detectors and redundant data collection. Liu et al. (2012) demonstrated routine native SAD on commodity beamlines.
SeMet MAD/SAD (selenomethionine-substituted protein). The gold standard until AlphaFold made MR dominant; still highly reliable when the protein expresses well in SeMet medium. Requires methionine residues (rule of thumb: at least one Met per 75 residues for adequate phasing power) and a tunable beamline. Hauptman's anomalous methods framework (Hauptman, 1997) underlies the dual-space algorithms (SHELXD, HySS) that locate the Se sites.
Halide soaks (Br⁻, I⁻). Soaking crystals briefly in 0.5–1.0 M NaBr or NaI introduces halide ions on the protein surface. Iodide is particularly potent (f″ at the iodine L-edge is ~7 e⁻, accessible at 1.7–1.9 Å on bending-magnet beamlines). Soak times of 5 seconds to 1 minute often suffice. Halide SAD can be performed on the same beamline as native data collection.
Heavy atom soaks. Hg, Pt, Au, Sm, Yb compounds—still useful, but the empirical screening burden makes them a third-line choice today. The original SIR/MIR/SIRAS methods are robust when sites can be located.
Xenon or Krypton derivatives for hydrophobic-pocket binding. Useful for difficult cases; requires pressure cells at the beamline.
A practical decision tree
Situation | Strategy |
|---|---|
> 1 Met per 75 residues, can re-express | SeMet SAD/MAD |
Need fast result, crystals robust to soaking | Halide quick soak |
High resolution (< 2.0 Å), good native data | Native SAD at long wavelength |
Membrane protein, unstable, can't re-express | Halide or Xe derivative |
Crystals tiny, only one form | Sm/Yb/Tb soaks (high f″ over wide range) |
Re-expression possible, willing to invest 3 months | SeMet—still the most reliable single route |
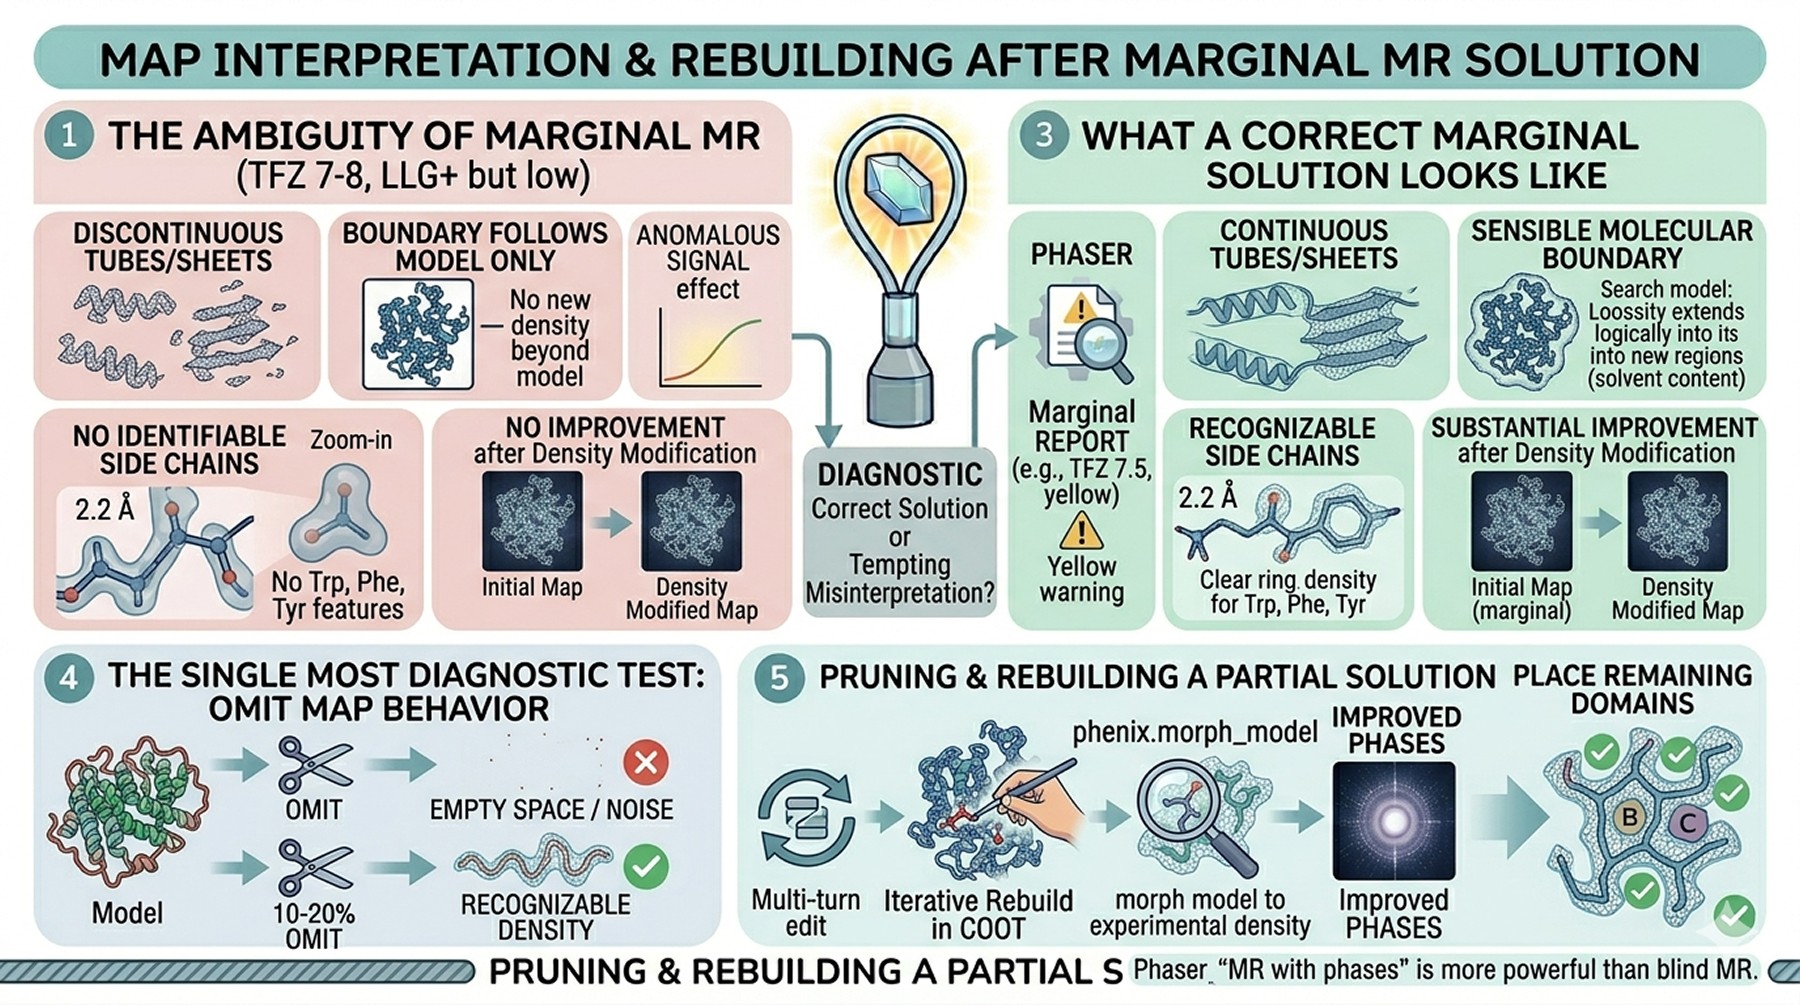
Map Interpretation After a Marginal MR Solution
Sometimes Phaser finds a solution with marginal statistics—TFZ 7–8, LLG positive but not dramatic. The map is partially interpretable but noisy. This is the most ambiguous outcome of MR, and the temptation to over-interpret a wrong solution is real.
What a correct marginal solution looks like
Helices and beta strands are visible as continuous tubes/sheets at appropriate B-factor
The molecular boundary makes sense relative to solvent content
Recognizable side chain density appears for the largest residues (Trp, Phe, Tyr)
The map improves substantially after one cycle of density modification
What a wrong marginal solution looks like
Tubes and sheets are present but discontinuous
The boundary follows the search model exactly, with no density beyond
No identifiable side chain features even at 2.0–2.5 Å resolution
Density modification produces no improvement
The single most diagnostic test is omit map behavior: remove 10–20 % of the model, refine briefly, and look at the omit region. A correct solution will show recognizable density for the omitted residues (sometimes weaker than expected, but recognizable). A wrong solution will show empty space or noise.
Pruning a partial solution into a full one
If MR places one or two domains confidently but leaves regions unmodeled, the right next step is iterative: rebuild the placed regions in COOT, refine, then use the improved phases to search for the remaining components via difference Fourier or by running MR on the resulting map. Phaser supports this "molecular replacement with phases" mode, which is much more powerful than a blind MR search once any correct phasing information is in hand.
The phenix.morph_model tool can also bridge a moderately accurate AF2 model to a refinable structure by morphing it toward the experimental density once a marginal map exists—this can recover partial solutions that would otherwise refine poorly.
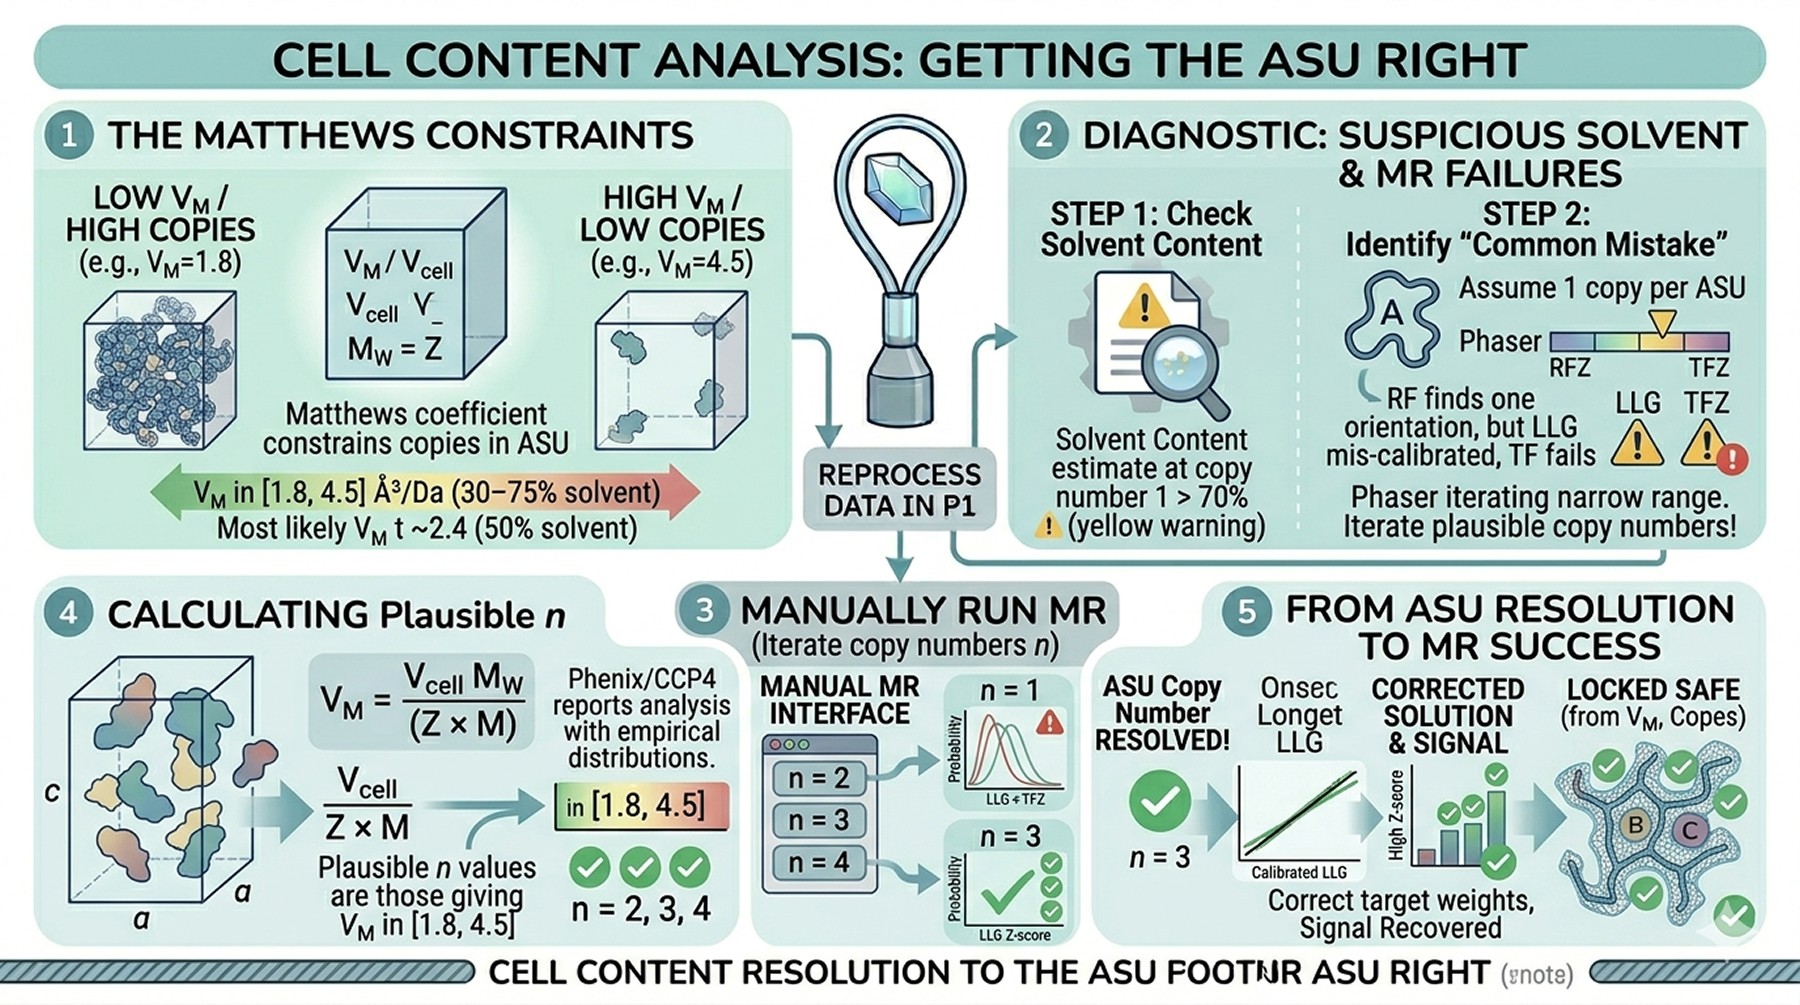
Cell Content Analysis: Getting the ASU Right
The Matthews coefficient (V_M = unit cell volume / molecular weight × Z) constrains the plausible number of copies in the asymmetric unit. Typical proteins have V_M between 1.8 and 4.5 ų/Da, corresponding to solvent content of 30–75 %. Outliers exist but are rare.
Common mistake: wrong copy number assumption
If your unit cell is large and you assume one molecule per ASU when there are actually two, the rotation function may find the orientation of one but the translation function fails because the LLG calculation assumes a different total scattering. Phaser's MR_AUTO and MrBUMP both iterate over plausible copy numbers, but they default to a narrow range. If your protein is small relative to the unit cell, manually run MR with copy numbers of 2, 3, and 4 per ASU—particularly when the solvent content estimate at copy number 1 is suspiciously high (> 70 %).
Calculating V_M and copy number
For a unit cell of volume V_cell, space group multiplicity Z, and protein molecular weight M:
V_M = V_cell / (Z × n × M), where n = copies per ASU
Plausible n values: those giving V_M in [1.8, 4.5]
Most likely n: that giving V_M near 2.4 (50 % solvent) for typical proteins
The phenix.matthews and CCP4's matthews_coef both report this analysis with empirical probability distributions.
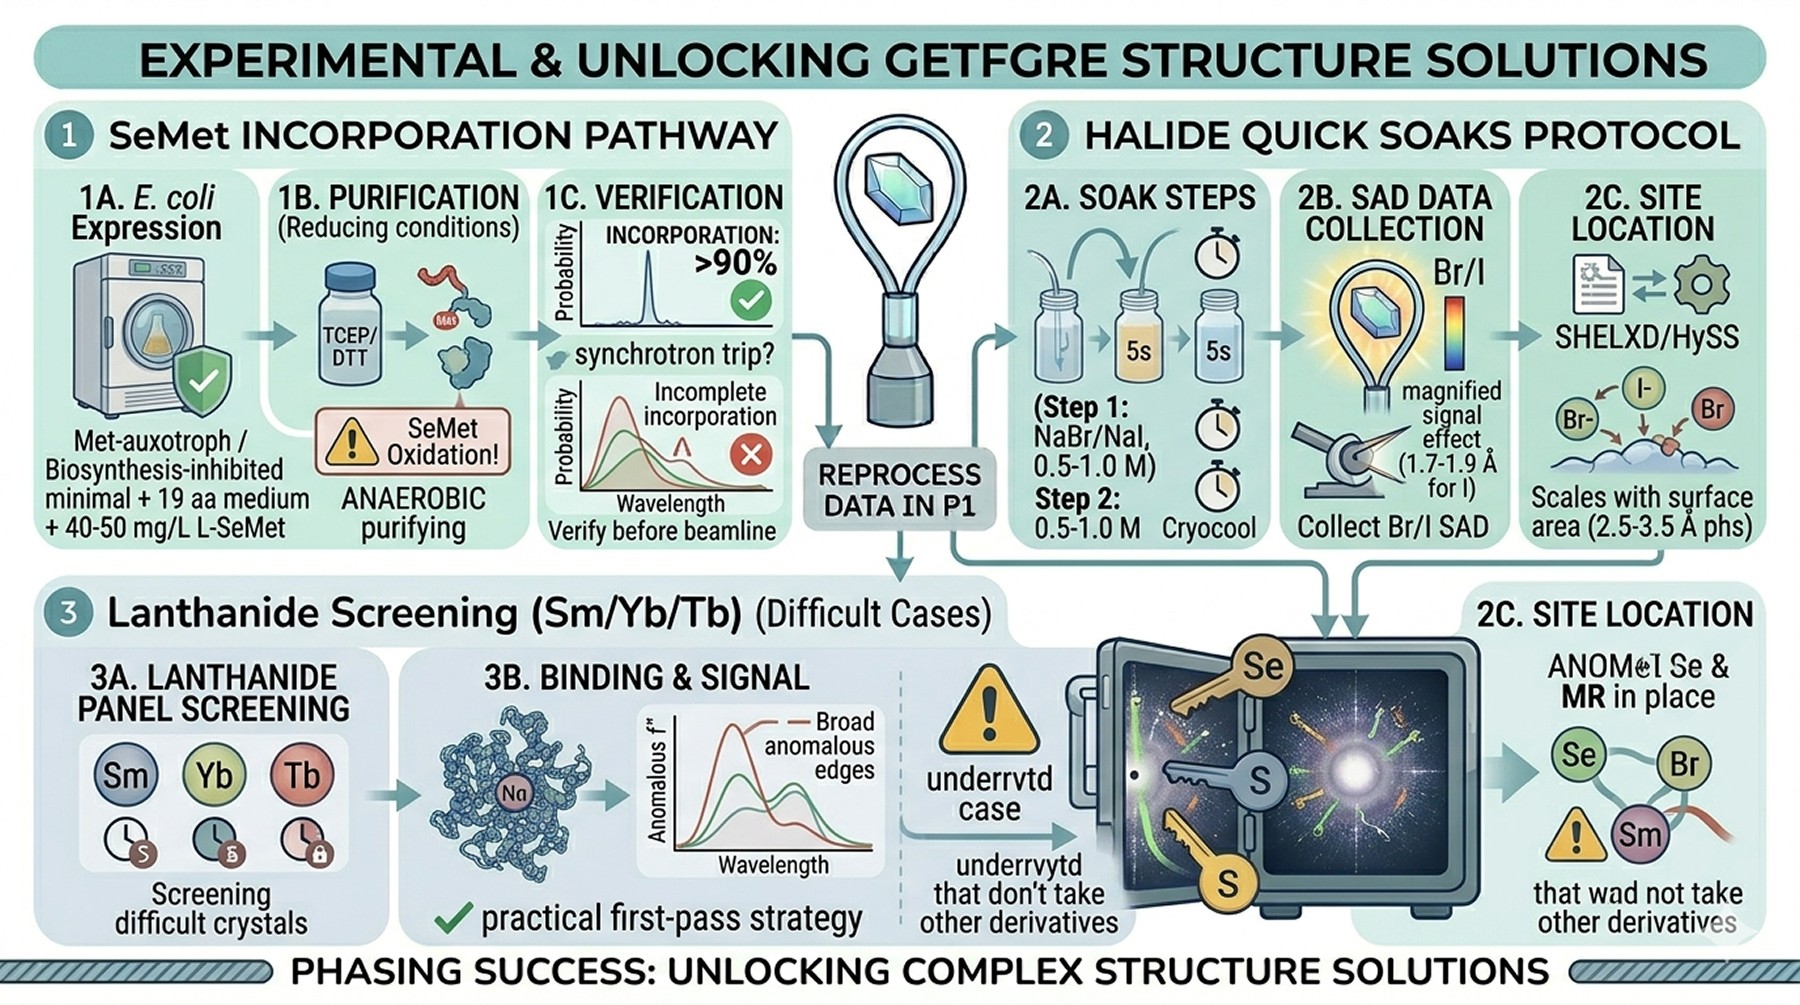
SeMet, Halides, and Ad Hoc Heavy Atom Screens
SeMet incorporation
Expression of SeMet-substituted protein in E. coli requires:
A methionine-auxotrophic strain (B834, or feedback inhibition of Met biosynthesis in standard strains)
SeMet medium (minimal medium + 19 amino acids + L-SeMet at 40–50 mg/L)
Reducing conditions throughout purification (DTT or TCEP at 1–5 mM, anaerobic where possible) to prevent SeMet oxidation
Typically 50–70 % of native yield
Mass spectrometry should confirm > 90 % SeMet incorporation before you commit to a synchrotron trip. Incomplete incorporation degrades the anomalous signal proportionally.
Halide quick soaks
The Dauter et al. protocol (Dauter et al., 2000) remains the standard:
Equilibrate crystals briefly in cryoprotectant containing 0.5–1.0 M NaBr or NaI
Soak for 5 s to 1 min
Cryocool immediately
Collect SAD data at the Br or I edge (or simply at 1.7–1.9 Å for I)
Locate halide sites with SHELXD or HySS
Halides bind to ordered surface waters and protein–protein contacts. The number of bound sites scales roughly with surface area and is usually adequate for phasing in the 2.5–3.5 Å resolution range.
Sm/Yb/Tb screening for difficult cases
Lanthanides have broad anomalous edges, multiple f″ peaks, and bind ordered carboxylate-rich sites. Screening a panel of 3–5 lanthanide salts at varying soak times has become a practical first-pass strategy for difficult crystals that don't take other derivatives.
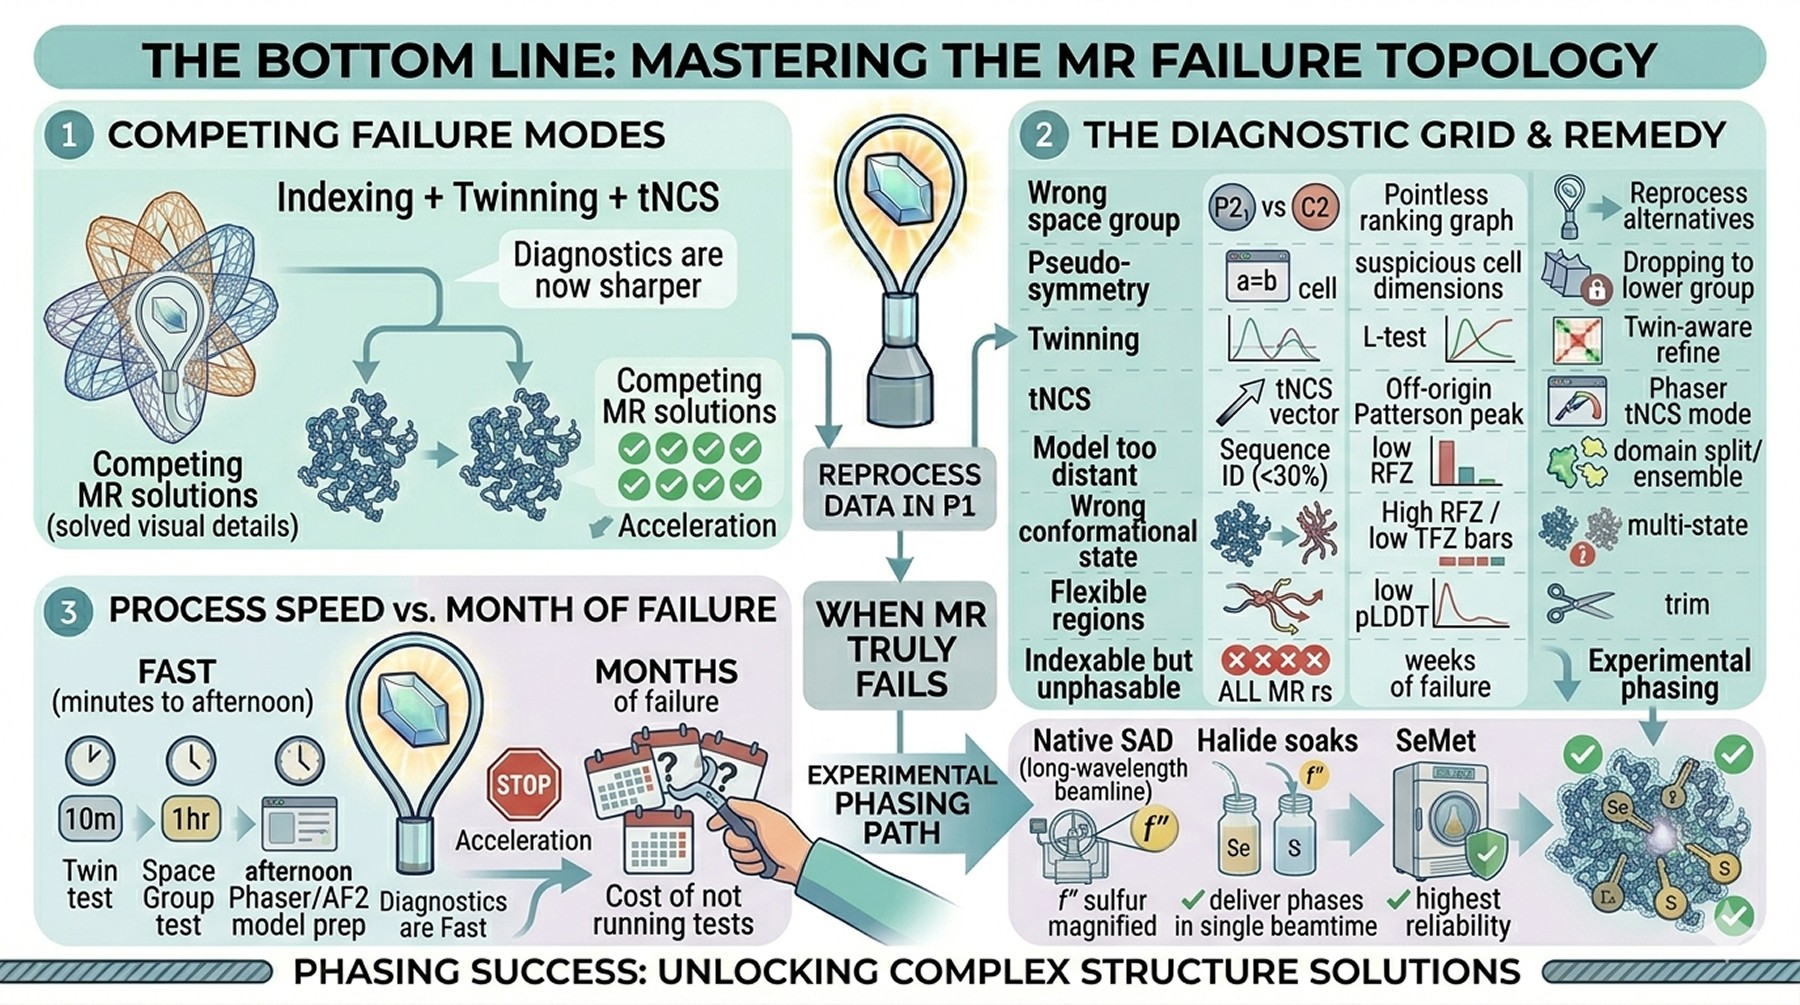
The Bottom Line
Failure mode | Diagnosis | Primary remedy |
|---|---|---|
Wrong space group | Pointless ranking, self-rotation peaks | Reprocess in candidate alternatives |
Pseudo-symmetry | Suspicious cell dimensions, MR fails | Drop to lower-symmetry group |
Twinning | L-test, intensity statistics | Try lower symmetry; twin-aware refinement |
tNCS | Off-origin Patterson peak | Phaser tNCS mode; explicit vector |
Model too distant | Sequence ID < 30 %, low RFZ | AF2 model; ensemble; domain split |
Wrong conformational state | High RFZ, low TFZ; map noise | Domain decomposition; multiple states |
Flexible/disordered model regions | Noise in rotation function | Trim by pLDDT and by chain B-factor |
Indexable but unphasable | All MR fails after weeks | Experimental phasing |
The pattern matters more than any single test. A crystal that diffracts beautifully but won't solve is almost never failing for a single, identifiable reason—it is usually failing for two or three reasons that compound. Running the diagnostics is fast. The space group hypothesis test costs an hour. The twin tests cost ten minutes. A run of phenix.process_predicted_model followed by Phaser with domain-split AF2 ensembles costs an afternoon. The cost of not running them is months.
If after exhaustive MR work you remain unsolved, experimental phasing is the right answer, not a confession of defeat. Native SAD and halide soaks can deliver phases in a single beamtime trip. SeMet, while slower, has the highest reliability of any phasing method ever developed. The structural biology workflow has not been replaced by AlphaFold; AlphaFold has accelerated the MR pathway and made the experimental pathway a faster choice when MR fails, because the diagnostics are now sharper.
Integrating Model Preparation into the MR Workflow
A practical bottleneck in modern crystallography is the gap between "I have an AlphaFold prediction" and "I have an MR-ready ensemble of fragments with per-residue B-factors derived from pLDDT and domain boundaries derived from PAE." Done manually, this is tedious; done badly, it produces models that quietly underperform.
Orbion automates the relevant steps. AlphaFold2 integration generates the predictions and surfaces the raw confidence outputs. The PAE Insight Engine then converts the PAE matrix into domain assignments—the same information a crystallographer would extract by inspecting PAE manually, but at scale and reproducibly. Each domain emerges as an independent search fragment with its own pLDDT-derived B-factors, ready to feed into Phaser as separate ensembles. AstraUNFOLD flags intrinsically disordered regions that should be removed before MR—because they are not just low-confidence in AF2, they are biologically expected to be invisible in the crystal map and will only add noise to the rotation function.
The aim is not to replace the crystallographer's judgment but to remove the manual preparation steps that consume hours and are easy to do inconsistently, so the time is spent on the parts that actually need a human—choosing the right space group hypothesis, deciding when to switch to experimental phasing, and interpreting the map.
References
McCoy AJ, Grosse-Kunstleve RW, Adams PD, Winn MD, Storoni LC, Read RJ. (2007). Phaser crystallographic software. Journal of Applied Crystallography, 40(4):658–674. PMC2483472
Yeates TO. (1997). Detecting and overcoming crystal twinning. Methods in Enzymology, 276:344–358. Link
Read RJ. (2001). Pushing the boundaries of molecular replacement with maximum likelihood. Acta Crystallographica Section D, 57(10):1373–1382. Link
Hauptman HA. (1997). Phasing methods for protein crystallography. Methods in Enzymology, 277:3–13. Link
Dauter Z, Dauter M, Rajashankar KR. (2000). Novel approach to phasing proteins: derivatization by short cryo-soaking with halides. Acta Crystallographica Section D, 56(2):232–237. Link
Pereira J, Simpkin AJ, Hartmann MD, Rigden DJ, Keegan RM, Lupas AN. (2021). High-accuracy protein structure prediction in CASP14. Proteins, 89(12):1687–1699. PMC8489223
McCoy AJ, Sammito MD, Read RJ. (2022). Implications of AlphaFold2 for crystallographic phasing by molecular replacement. Acta Crystallographica Section D, 78(1):1–13. Link
Book a 20-Minute Demo
Sign up free for unlimited Overview runs — summary, sequence-based analysis, homology search. For the full Characterization — PTMs, binding sites, stability variants, construct design — book a demo and we'll run your target live.
