Blog
Orbion Team
Intrinsically Disordered Regions: Why They Break Your Protein Pipeline

Your protein expresses well. It purifies to apparent homogeneity—a single peak on size exclusion, a clean band on SDS-PAGE. You set up 2,000 crystallization conditions. Nothing. Not a single crystal. You switch to cryo-EM. The 2D classes are fuzzy, the 3D reconstruction looks like a blob, and the resolution stalls at 8 Å. Your protein is doing everything right—except it won't give you a structure. Then you look at the AlphaFold model. A 130-residue stretch at the C-terminus is orange and red—pLDDT below 40. You've been dragging an intrinsically disordered tail through your entire pipeline.
Intrinsically disordered regions aren't "unstructured noise." They're active saboteurs of standard structural biology workflows, and ignoring them is one of the most expensive mistakes in protein science.
Key Takeaways
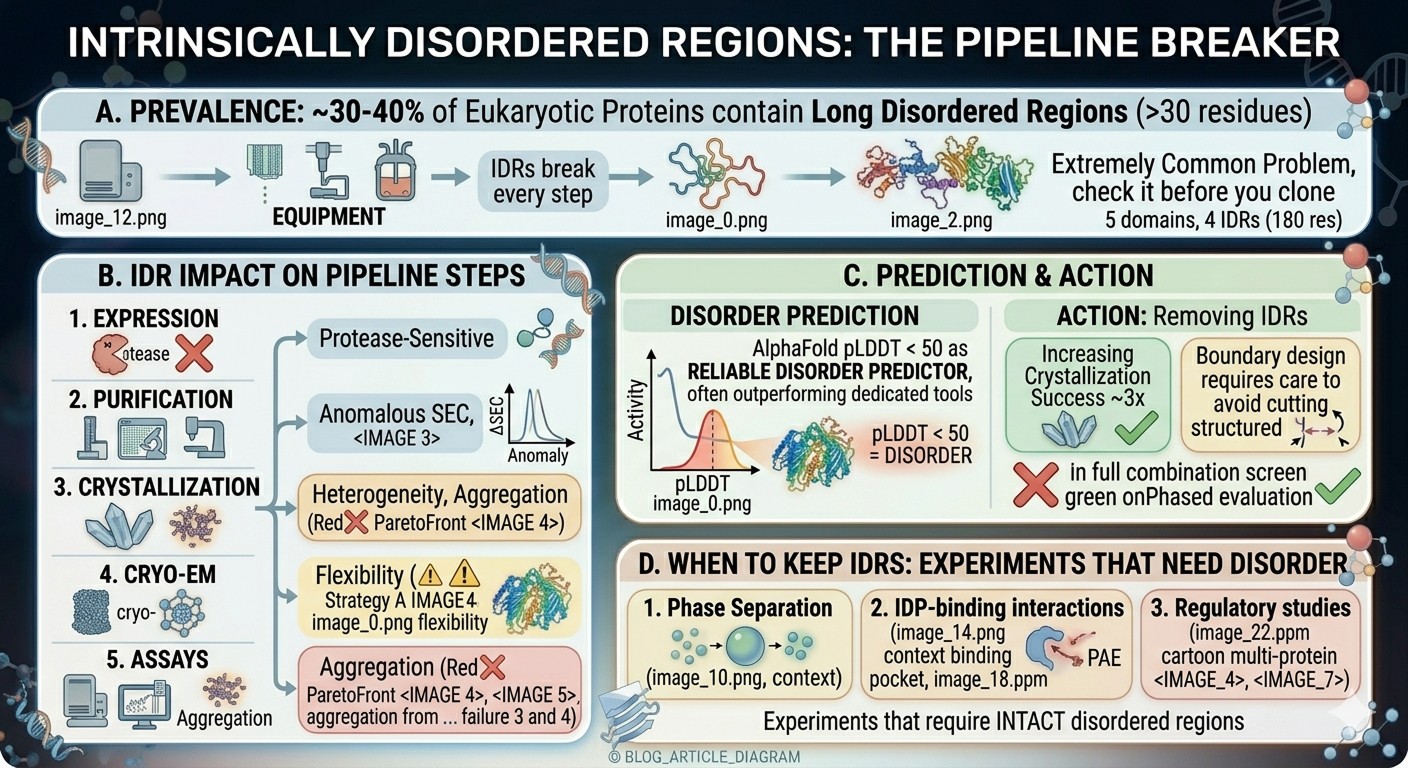
~30–40% of eukaryotic proteins contain long disordered regions (>30 residues), making this an extremely common problem
IDRs break every step of the pipeline: expression (protease-sensitive), purification (anomalous SEC), crystallization (heterogeneity), cryo-EM (flexibility), assays (aggregation)
AlphaFold pLDDT < 50 is a reliable disorder predictor, often outperforming dedicated tools—check it before you clone
Removing IDRs increases crystallization success ~3x, but boundary design requires care to avoid cutting into structured regions
Some experiments NEED the disorder: phase separation, IDP-binding interactions, and regulatory studies require intact disordered regions
How Common Are Intrinsically Disordered Regions?
The Numbers
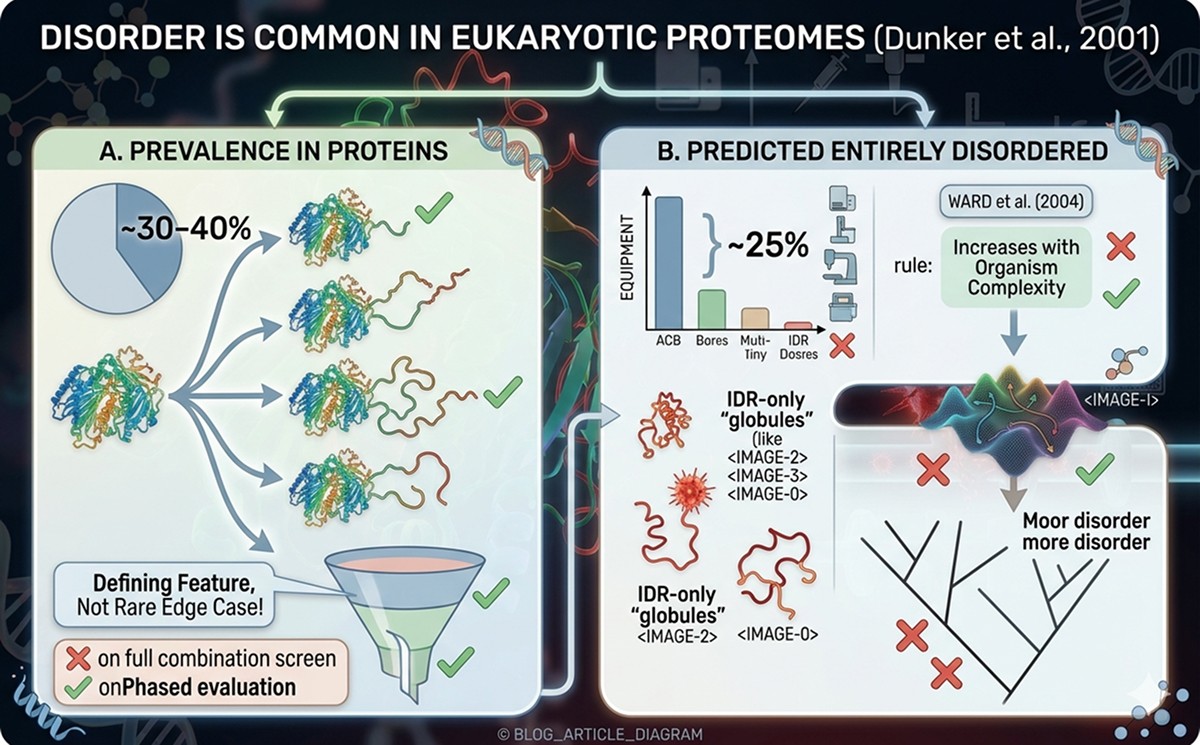
Disorder is not a rare edge case. It's a defining feature of eukaryotic proteomes:
~30–40% of eukaryotic proteins contain disordered regions longer than 30 residues (Dunker et al., 2001)
~25% of eukaryotic proteins are predicted to be entirely disordered (>90% of residues in disorder)
~10% of bacterial proteins contain long disordered regions (much less common in prokaryotes)
Ward et al. (2004) found that disorder length and frequency increase with organism complexity
By protein class:
Protein Class | % With Long IDRs (>30 aa) | Examples |
|---|---|---|
Transcription factors | ~70–80% | p53, c-Myc, CREB |
Signaling proteins | ~50–60% | BRCA1, Rb, p27 |
Scaffold proteins | ~40–50% | Axin, APC |
Enzymes | ~15–20% | Often in regulatory regions |
Structural proteins | ~20–30% | Titin (spring regions), elastin |
If you work with eukaryotic signaling or regulatory proteins, you will encounter disorder. It's a question of when, not if.
What Are IDRs, Biologically?
Not Broken—Functional
The old view was that disorder meant "unfolded and nonfunctional." This is wrong. IDRs are often the most functionally important parts of a protein (Wright & Dyson, 2015):
Functional roles of disorder:
Molecular recognition: Disordered regions mediate many protein-protein interactions. They fold upon binding ("coupled folding and binding"), enabling specificity with moderate affinity.
Post-translational modification: PTM sites are overwhelmingly located in disordered regions. Disorder provides accessibility to kinases, acetyltransferases, and other modifying enzymes.
Regulation: Disordered linkers and tails often contain regulatory motifs (degrons, nuclear localization signals, phospho-switches).
Phase separation: IDRs drive liquid-liquid phase separation (LLPS), forming membraneless organelles like stress granules and P-bodies (Banani et al., 2017).
Entropic effects: Disordered tethers can modulate effective local concentration of interacting domains.
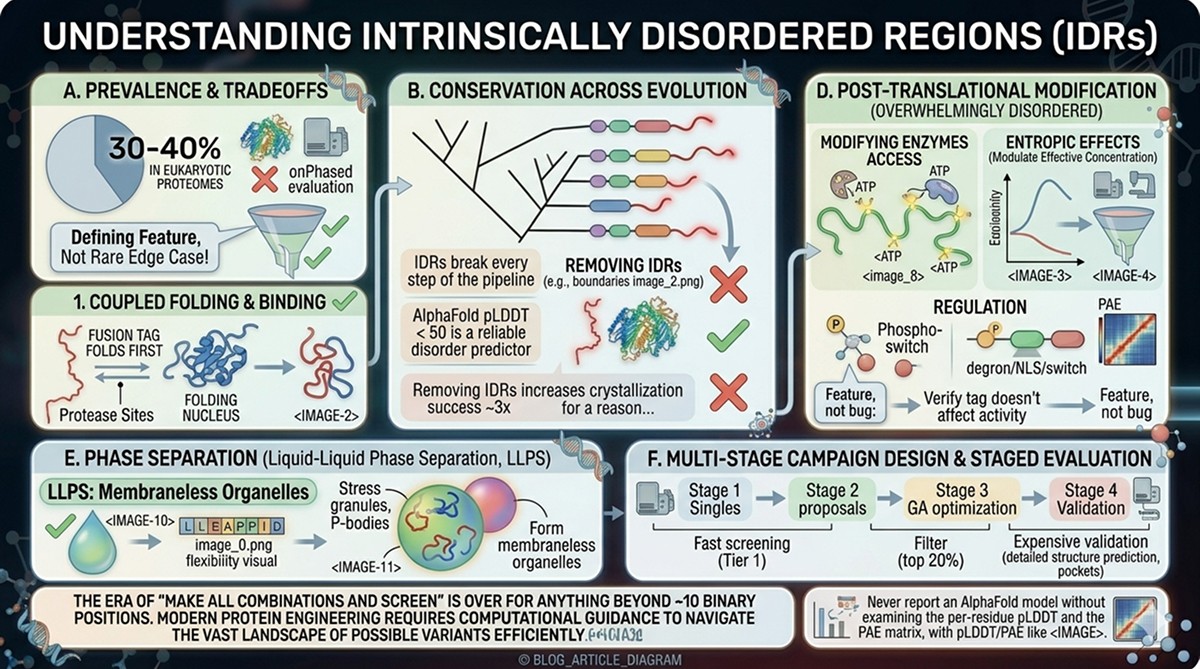
The key insight: Disorder is evolutionarily conserved. If a region has been disordered across 500 million years of evolution, it's disordered for a reason.
AlphaFold and Disorder Detection
pLDDT as a Disorder Predictor
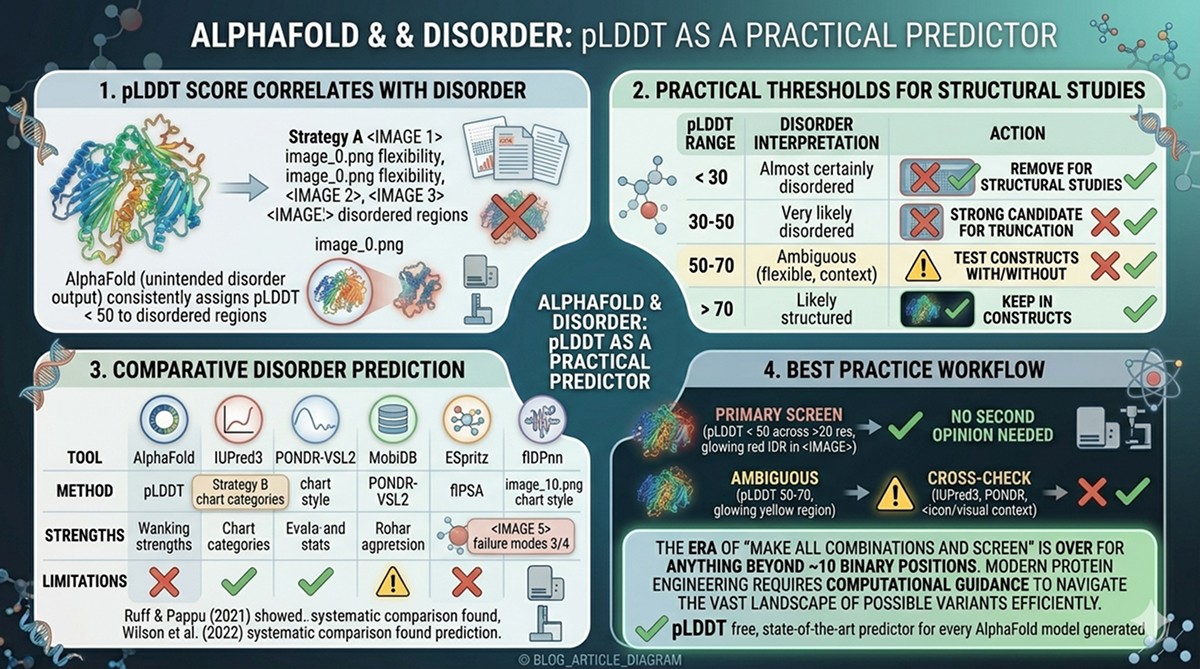
One of AlphaFold's most practically useful (and unintended) outputs is disorder prediction. Low pLDDT scores correlate strongly with intrinsic disorder:
Ruff & Pappu (2021) demonstrated that AlphaFold consistently assigns pLDDT < 50 to experimentally validated disordered regions
Wilson et al. (2022) systematically compared AlphaFold pLDDT against dedicated disorder predictors (IUPred2, PONDR-VSL2, ESpritz) and found comparable or superior performance for long disordered regions
AlphaFold effectively provides a free, state-of-the-art disorder prediction for every model it generates
Practical thresholds:
pLDDT Range | Disorder Interpretation | Action |
|---|---|---|
< 30 | Almost certainly disordered | Remove for structural studies |
30–50 | Very likely disordered | Strong candidate for truncation |
50–70 | Ambiguous: partially ordered, context-dependent, or flexible | Test constructs with and without |
> 70 | Likely structured | Keep in constructs |
Beyond pLDDT: Dedicated Disorder Predictors
Tool | Method | Strengths | Limitations |
|---|---|---|---|
AlphaFold pLDDT | Structure prediction byproduct | Free with any AF model, high accuracy for long IDRs | Not designed for disorder; misses short flexible loops |
IUPred3 | Energy-based estimation | Fast, no MSA needed, web server | Conservative; misses some IDRs |
PONDR-VSL2 | Neural network ensemble | Good sensitivity for short and long disorder | Can overpredict |
MobiDB | Database aggregating multiple predictors | Consensus approach, literature integration | Depends on component predictors |
ESpritz | Neural network, multiple flavors | Separate models for different disorder types | Less widely used |
flDPnn | Deep learning | High accuracy on recent benchmarks | Newer, less validation in practice |
Best practice: Use AlphaFold pLDDT as your primary screen. If a region is pLDDT < 50 across >20 residues, it's disordered—you don't need a second opinion. For ambiguous regions (pLDDT 50–70), cross-check with IUPred3 or PONDR.
How IDRs Break Each Pipeline Step
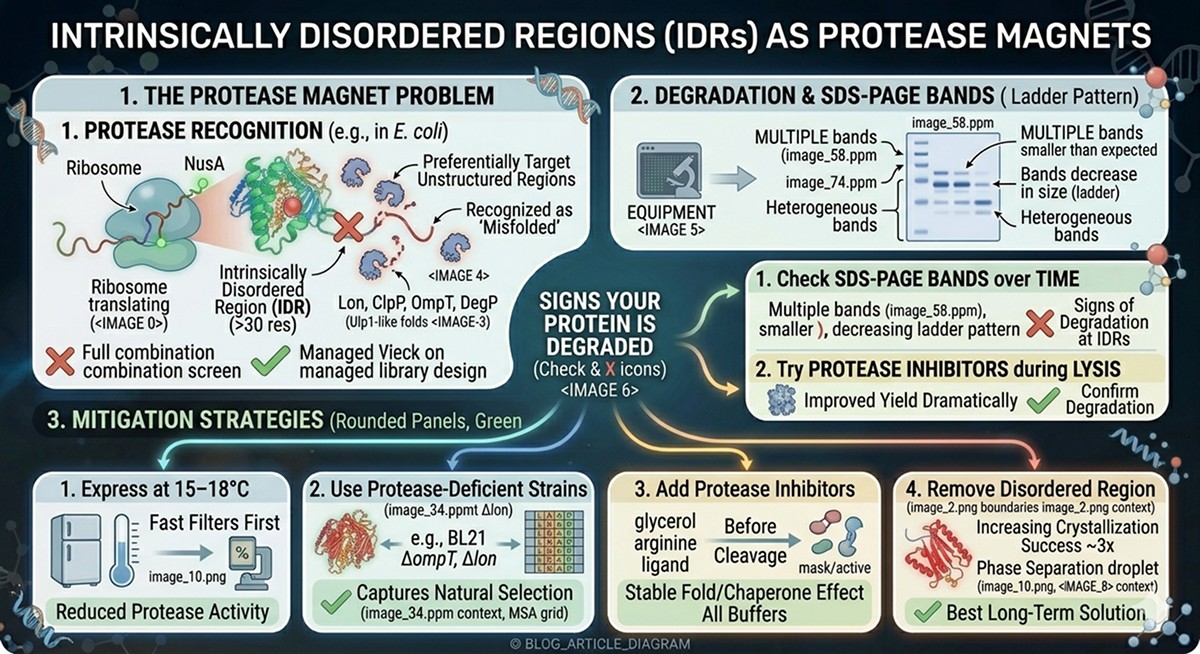
Expression: The Protease Magnet
Disordered regions are highly susceptible to proteolysis:
E. coli proteases (Lon, ClpP, OmpT, DegP) preferentially target unstructured regions
Extended, flexible sequences are recognized as "misfolded" by the quality control machinery
Result: degradation during expression, truncated products, heterogeneous bands on SDS-PAGE
Signs your protein is being degraded at IDRs:
Multiple bands on SDS-PAGE, all smaller than expected
Bands decrease in size over time (ladder pattern)
Protease inhibitors during lysis improve yield dramatically
Mitigation strategies:
Express at 15–18°C (reduces protease activity)
Use protease-deficient strains (BL21 ΔompT, Δlon)
Add protease inhibitors to all buffers
Remove the disordered region (best long-term solution)
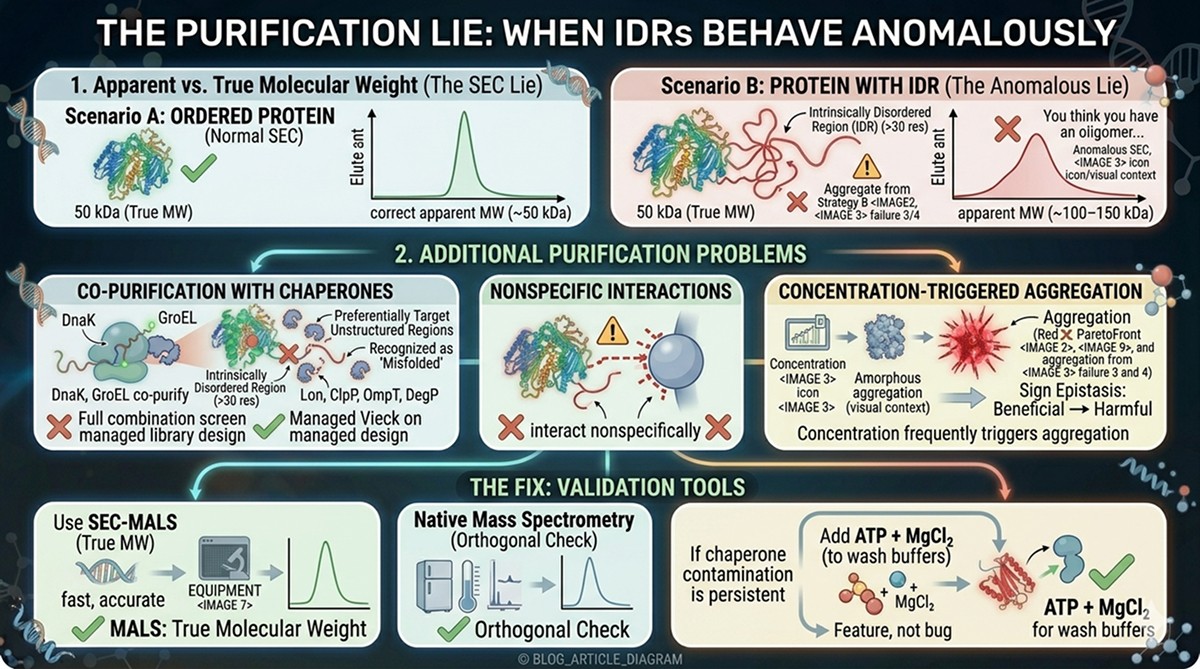
Purification: The SEC Lie
Disordered proteins behave anomalously on size exclusion chromatography:
Apparent molecular weight is inflated by 1.5–3x because IDRs adopt extended conformations
A 50 kDa protein with a 100-residue IDR may elute at an apparent MW of 100–150 kDa
You think you have an oligomer. You actually have a monomer with a floppy tail.
Additional purification problems:
IDRs co-purify with chaperones (DnaK, GroEL) that bind to exposed hydrophobic stretches
Disordered regions can interact nonspecifically with chromatography matrices
Concentration of proteins with IDRs often triggers aggregation (increased local concentration of aggregation-prone sequences)
The fix:
Use SEC-MALS (multi-angle light scattering) to get true molecular weight, not apparent
Native mass spectrometry as an orthogonal check
If chaperone contamination is persistent, add ATP + MgCl₂ to wash buffers to release DnaK
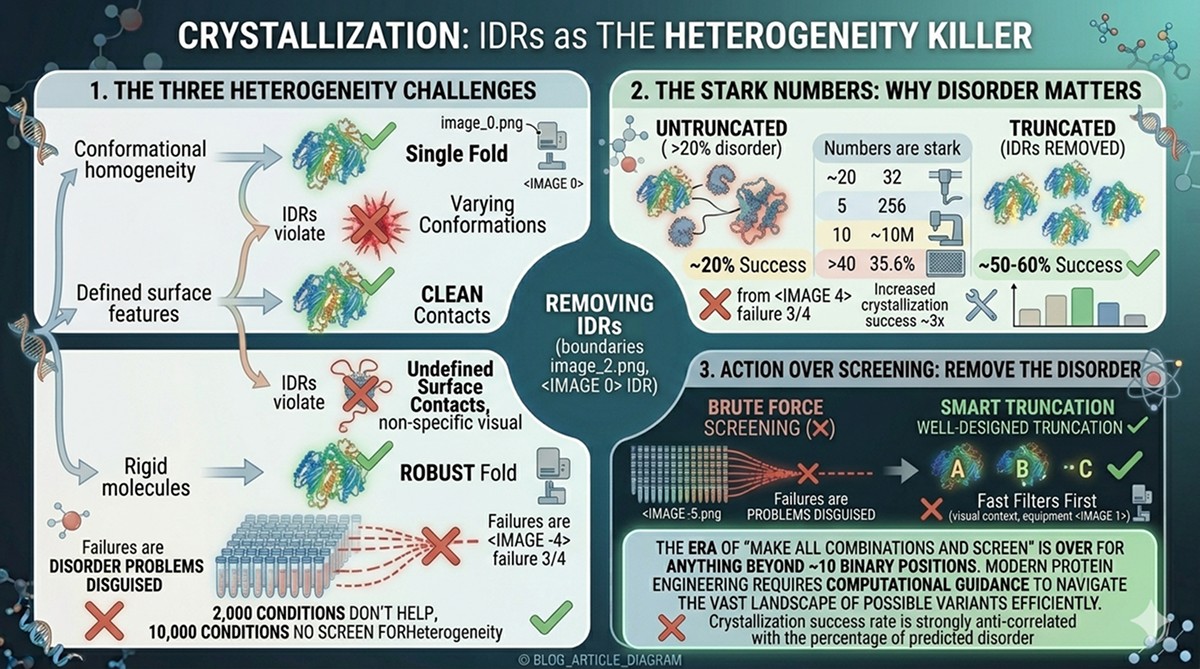
Crystallization: The Heterogeneity Killer
This is where IDRs do the most damage. Crystallization requires:
Conformational homogeneity
Defined surface features for crystal contacts
Rigid molecules that can pack into a lattice
IDRs violate all three requirements.
The numbers are stark:
Analysis of structural genomics projects shows that removing predicted disordered regions increases crystallization success from ~20% to ~50–60%
Proteins with >20% predicted disorder crystallize at roughly one-third the rate of fully ordered proteins
Many crystallization "failures" are actually disorder problems disguised as optimization problems
Why 2,000 conditions don't help:
No crystallization condition can force a genuinely disordered region into a lattice. You can screen 10,000 conditions—if conformational heterogeneity is the problem, none will work.
The solution: Remove the disordered region. A well-designed truncation is worth more than 10,000 crystallization conditions.
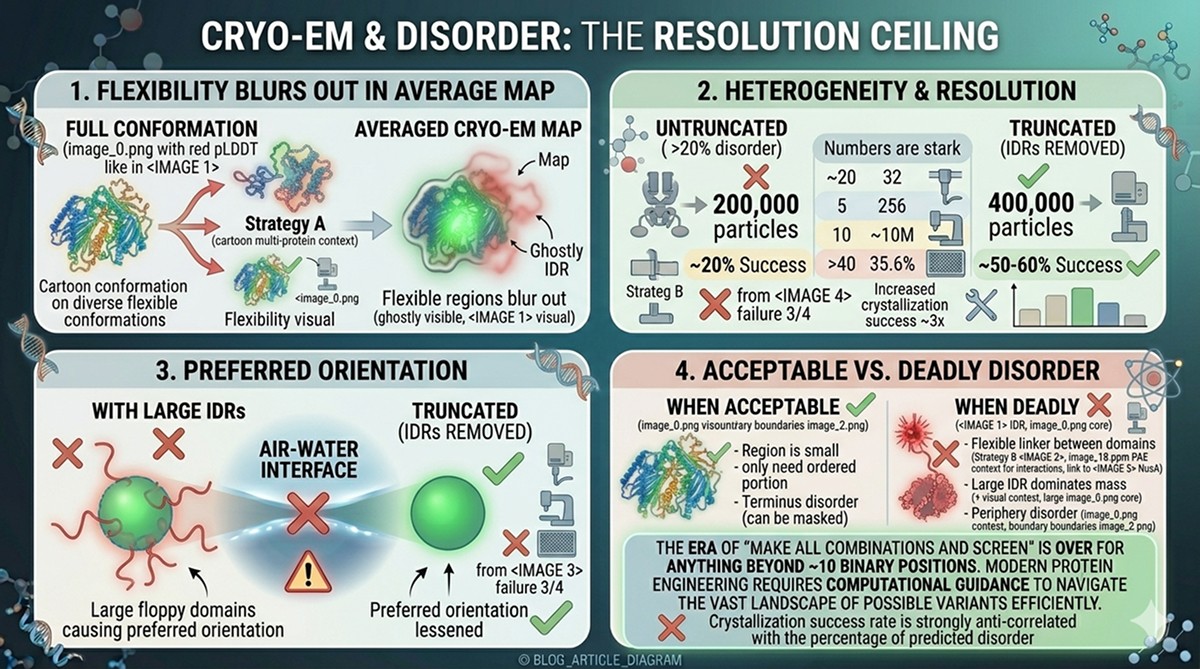
Cryo-EM: The Resolution Ceiling
Cryo-EM is more tolerant of disorder than crystallography, but IDRs still cause problems:
Flexible regions blur out during averaging—they're present in the particles but invisible in the map
Conformational heterogeneity reduces the number of particles in each 3D class, lowering resolution
Preferred orientation can be worsened by floppy domains that interact with the air-water interface
Overall resolution is dragged down by flexible portions: a 2.5 Å core might be reported as 4 Å overall because the disordered tails are at 10+ Å
When disorder is acceptable in cryo-EM:
If the disordered region is small relative to the structured core
If you only need the structure of the ordered portion
If the disorder is at a terminus (can be masked during refinement)
When disorder kills the experiment:
Disordered linker between two domains of interest (flexible arrangement)
Large IDR that dominates the mass of the particle
Disorder at the periphery causing preferred orientation via surface interactions
Assay Development: The Nonspecific Binder
IDRs cause problems in biochemical and biophysical assays:
Surface plasmon resonance (SPR): Disordered regions stick nonspecifically to sensor chips, creating false positives
Isothermal titration calorimetry (ITC): Conformational heterogeneity creates complex thermodynamic signatures
Activity assays: IDRs can aggregate during the assay, causing time-dependent artifacts
Pull-downs: Disordered regions bind nonspecifically to beads, resins, and other proteins
The Construct Design Solution
How to Identify Where to Cut
Method 1: AlphaFold pLDDT profile
Plot pLDDT per residue
Domain boundaries are where pLDDT drops from >70 to <50
Cut at the transition point, leaving 3–5 residues of "buffer"
Method 2: PAE domain blocks
The PAE matrix shows rigid domains as blue blocks
The edges of these blocks define domain boundaries
Red/yellow between blocks = flexible linkers (good cutting points)
Method 3: Limited proteolysis
Digest your full-length protein with low concentrations of trypsin or chymotrypsin
Analyze fragments by mass spectrometry
Stable fragments correspond to folded domains; cut sites map to disordered linkers
This is the gold standard but requires purified protein first
Method 4: Secondary structure prediction
Cut between the last secondary structure element of one domain and the first of the next
Avoid cutting in the middle of helices or strands
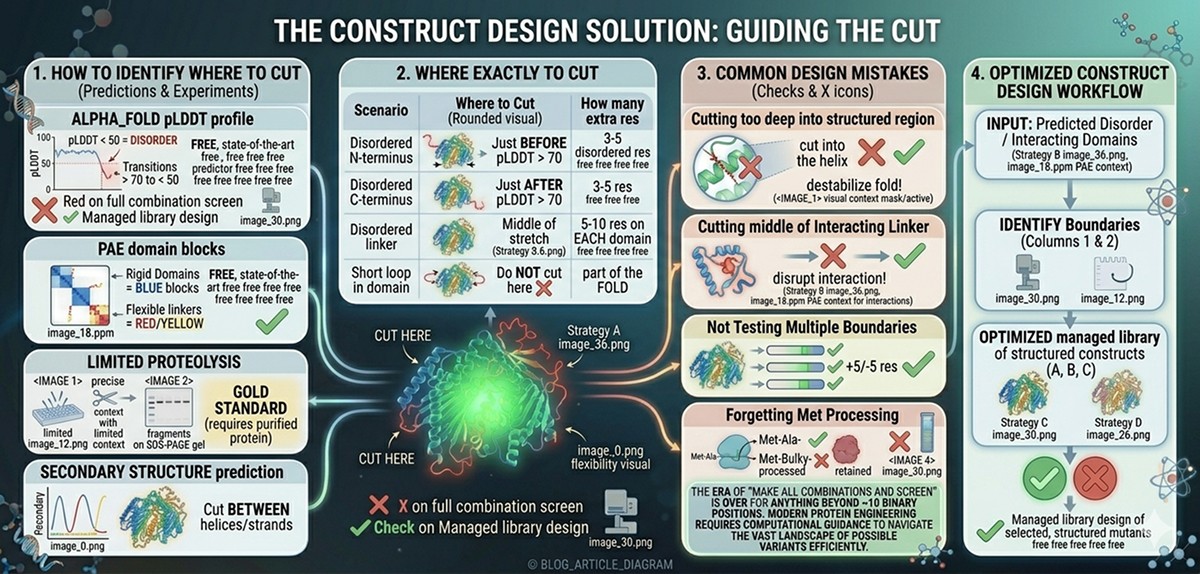
Where Exactly to Cut
Scenario | Where to Cut | How Many Extra Residues |
|---|---|---|
Disordered N-terminus | Just before first residue with pLDDT > 70 | Leave 3–5 disordered residues as "stub" |
Disordered C-terminus | Just after last residue with pLDDT > 70 | Leave 3–5 residues |
Disordered linker between domains | Middle of the disordered stretch | Leave 5–10 residues on each domain side |
Short flexible loop in a domain | Do NOT cut here | Loops within domains are part of the fold |
Common Construct Design Mistakes
Mistake 1: Cutting too deep into the structured region
If you cut 10 residues into the folded domain to "make sure" you removed all disorder, you may destabilize the fold
The last helix or strand before the disordered region is often critical for domain stability
Mistake 2: Cutting in the middle of a disordered linker between two interacting domains
If two domains interact through the linker, cutting it may disrupt the interaction
Check inter-domain PAE: if it's low (<10 Å), the domains have a fixed relationship and the linker matters
Mistake 3: Not testing multiple construct boundaries
Always design 2–3 constructs with slightly different boundaries (+5/–5 residues)
The optimal boundary is often not obvious from prediction alone
Mistake 4: Forgetting that the first Met will be processed
E. coli removes the initiator Met when the second residue is small (Ala, Cys, Gly, Pro, Ser, Thr, Val)
If your new N-terminal residue after truncation has a bulky side chain, Met will be retained
This is usually harmless but can affect crystallization
When You NEED the Disorder
Phase Separation Studies
Liquid-liquid phase separation (LLPS) is driven by multivalent, weak interactions in disordered regions. If you're studying:
Stress granule formation
Nucleolar assembly
Transcriptional condensates
You need the IDRs intact. Removing them removes the biology.
IDP Binding Interactions
Many protein-protein interactions are mediated by disordered motifs that fold upon binding:
p53 transactivation domain binding to MDM2
CREB KID domain binding to CBP KIX domain
Disordered tails of histones binding to chromatin remodelers
For these studies, you need the disordered region—it IS the binding interface.
Regulatory and Signaling Studies
Post-translational modifications in disordered regions often serve as molecular switches:
Phosphorylation of disordered activation loops
Ubiquitination of disordered degrons
SUMOylation of disordered regulatory regions
Removing the IDR removes the regulation.
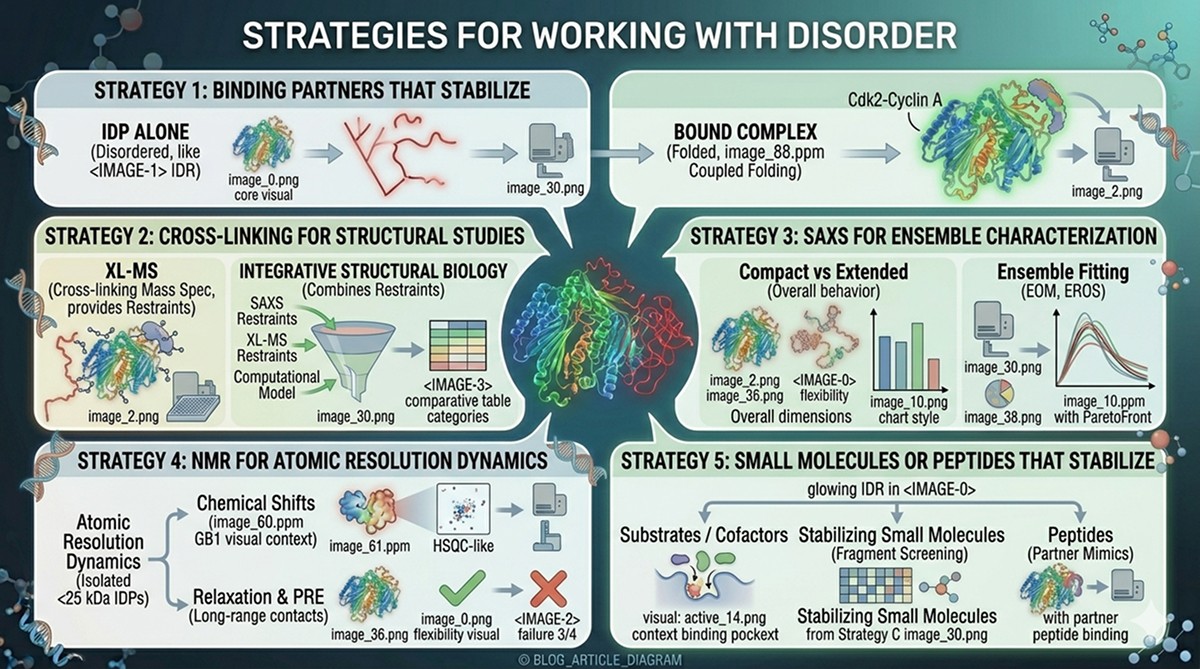
Strategies for Working WITH Disorder
When you can't remove the disordered region, use strategies to manage it:
Strategy 1: Binding Partners That Stabilize
Some disordered regions become ordered upon binding their natural partner:
Co-express or co-purify with the binding partner
The bound complex may be suitable for crystallization or cryo-EM
Example: p27Kip1 is disordered alone but folds when bound to Cdk2-Cyclin A (Russo et al., 1996)
Strategy 2: Cross-Linking for Structural Studies
Chemical cross-linking captures transient contacts in disordered regions:
XL-MS (cross-linking mass spectrometry) provides distance restraints
Integrative structural biology combines XL-MS with SAXS and computational modeling
This approach works well for proteins with extensive disorder
Strategy 3: SAXS for Ensemble Characterization
Small-angle X-ray scattering doesn't require a single conformation:
Provides overall shape and dimensions
Can distinguish compact vs extended conformations
Ensemble fitting methods (EOM, EROS) model the distribution of conformations
Ideal for characterizing the overall behavior of disordered regions
Strategy 4: NMR for Residue-Level Dynamics
NMR is the method of choice for studying disordered regions at atomic resolution:
Chemical shifts report on secondary structure propensity
Relaxation measurements quantify dynamics on multiple timescales
PRE (paramagnetic relaxation enhancement) reports on transient long-range contacts
Size limit: works best for isolated disordered domains (<25 kDa)
Strategy 5: Small Molecules or Peptides That Stabilize
Some disordered regions can be stabilized by:
Substrate analogs or cofactors
Stabilizing small molecules identified by fragment screening
Peptides that mimic binding partners
Classic Examples
p53: The Most Studied Disordered Protein
Full-length p53 (393 residues) is ~30% disordered
The N-terminal transactivation domain (residues 1–61) is fully disordered
The C-terminal regulatory domain (residues 364–393) is disordered
Only the DNA-binding domain (residues 94–292) has a stable fold
Thousands of crystallization attempts on full-length p53 have failed
All p53 crystal structures are of isolated domains or domain complexes
Tau: Natively Unfolded, Pathologically Structured
Tau (441 residues in the longest isoform) is entirely disordered in its native state
No crystal structure of full-length monomeric tau exists
Upon aggregation in Alzheimer's disease, portions of tau form ordered amyloid fibrils
Cryo-EM structures of tau filaments reveal ordered cores surrounded by disordered "fuzzy coats"
Studying tau requires IDR-tolerant methods (NMR, SAXS, single-molecule techniques)
BRCA1: The Construct Design Success Story
BRCA1 (1,863 residues) is largely disordered
The BRCT domains (residues ~1,646–1,859) are the only well-structured region
Crystal structures of BRCA1 BRCT were obtained only after decades of construct optimization
Success required identifying exact domain boundaries and removing all disordered flanking regions
The difference between a construct that crystallizes and one that doesn't can be as few as 5 residues
The Bottom Line
Pipeline Step | How Disorder Hurts | Solution |
|---|---|---|
Expression | Protease degradation, heterogeneity | Low temperature, protease-deficient strains, truncation |
Purification | Anomalous SEC, chaperone contamination | SEC-MALS for true MW, ATP washes |
Crystallization | Conformational heterogeneity blocks lattice formation | Remove disordered regions (3x improvement in success rate) |
Cryo-EM | Flexible regions blur out, lower resolution | Mask flexible regions, binding partners to stabilize |
Assays | Nonspecific binding, aggregation, artifacts | Use truncated constructs, add stabilizers |
The most important habit: Check the AlphaFold model BEFORE you clone. A 60-second look at the pLDDT profile can save you 6 months of failed crystallization trials.
Identifying and Designing Around Disorder with Orbion
Orbion provides multiple tools for handling disorder before it becomes a problem. AstraUNFOLD predicts per-residue disorder probability and amyloidogenicity directly from sequence, flagging regions likely to cause problems in expression, purification, and structural studies. The PAE Insight Engine automatically identifies domain boundaries and hinge regions from AlphaFold confidence data, so you can see exactly where rigid domains end and flexible linkers begin.
The Construct Design module translates these predictions into action: select expression construct boundaries based on predicted disorder-to-structure transitions, add appropriate tags and fusion partners, and generate codon-optimized sequences—all within the same workflow. Combined with AlphaFold2 pLDDT visualization in the 3D viewer, you can go from "my protein has disorder" to "here's the construct that will work" before ordering a single primer.
References
Dunker AK, et al. (2001). Intrinsically disordered protein. Journal of Molecular Graphics and Modelling, 19(1):26-59. PMC2373533
Ward JJ, et al. (2004). Prediction and functional analysis of native disorder in proteins from the three kingdoms of life. Journal of Molecular Biology, 337(3):635-645. Link
Wright PE & Dyson HJ. (2015). Intrinsically disordered proteins in cellular signalling and regulation. Nature Reviews Molecular Cell Biology, 16:18-29. Link
Banani SF, et al. (2017). Biomolecular condensates: organizers of cellular biochemistry. Nature Reviews Molecular Cell Biology, 18:285-298. Link
Ruff KM & Pappu RV. (2021). AlphaFold and implications for intrinsically disordered proteins. Journal of Molecular Biology, 433(20):167208. Link
Wilson CJ, et al. (2022). AlphaFold2 and disorder: Are predicted confidence scores a good substitute for disorder predictors? Proteins, 90(12):2109-2118. Link
Derewenda ZS. (2004). The use of recombinant methods and molecular engineering in protein crystallization. Methods, 34(3):354-363. PMC2238902
Russo AA, et al. (1996). Crystal structure of the p27Kip1 cyclin-dependent-kinase inhibitor bound to the cyclin A-Cdk2 complex. Nature, 382:461-464. Link
Fitzpatrick AWP, et al. (2017). Cryo-EM structures of tau filaments from Alzheimer's disease. Nature, 547:185-190. Link
Williams RS, et al. (2001). Crystal structure of the BRCT repeat region from the breast cancer-associated protein BRCA1. Nature Structural Biology, 8:838-842. PMC2737721
Oldfield CJ & Dunker AK. (2014). Intrinsically disordered proteins and intrinsically disordered protein regions. Annual Review of Biochemistry, 83:553-584. Link
Tompa P. (2012). Intrinsically disordered proteins: a 10-year recap. Trends in Biochemical Sciences, 37(12):509-516. Link
Book a 20-Minute Demo
Sign up free for unlimited Overview runs — summary, sequence-based analysis, homology search. For the full Characterization — PTMs, binding sites, stability variants, construct design — book a demo and we'll run your target live.
