You screened 50 buffer conditions by differential scanning fluorimetry. Found one that shifts the Tm from 52°C to 67°C. Fifteen degrees—amazing. You switch your entire purification to that buffer. The protein still aggregates during concentration. It still loses activity after two days at 4°C. The Tm went up, but the protein didn't actually get more stable where it matters.
Thermal shift assays (DSF, ThermoFluor) are the most common stability measurement in protein science. They're fast, cheap, and high-throughput. They're also frequently misleading—not because the measurement is wrong, but because what they measure isn't always what you need.
Key Takeaways
-
Tm measures thermodynamic unfolding temperature, not shelf-life, aggregation resistance, or functional stability at working temperature
-
A higher Tm doesn't guarantee a better protein: some stabilizing conditions shift Tm but increase aggregation propensity at physiological temperature
-
Multi-state unfolders break the assay: proteins with multiple domains or intermediates give complex, uninterpretable melt curves
-
The dye matters: SYPRO Orange binds hydrophobic surfaces and can be quenched by detergents, lipids, and some buffer components, creating artifacts
-
Tm is one data point in a stability assessment—pair it with aggregation kinetics, functional assays, and accelerated stability studies for real decisions
What Thermal Shift Actually Measures
The Experiment
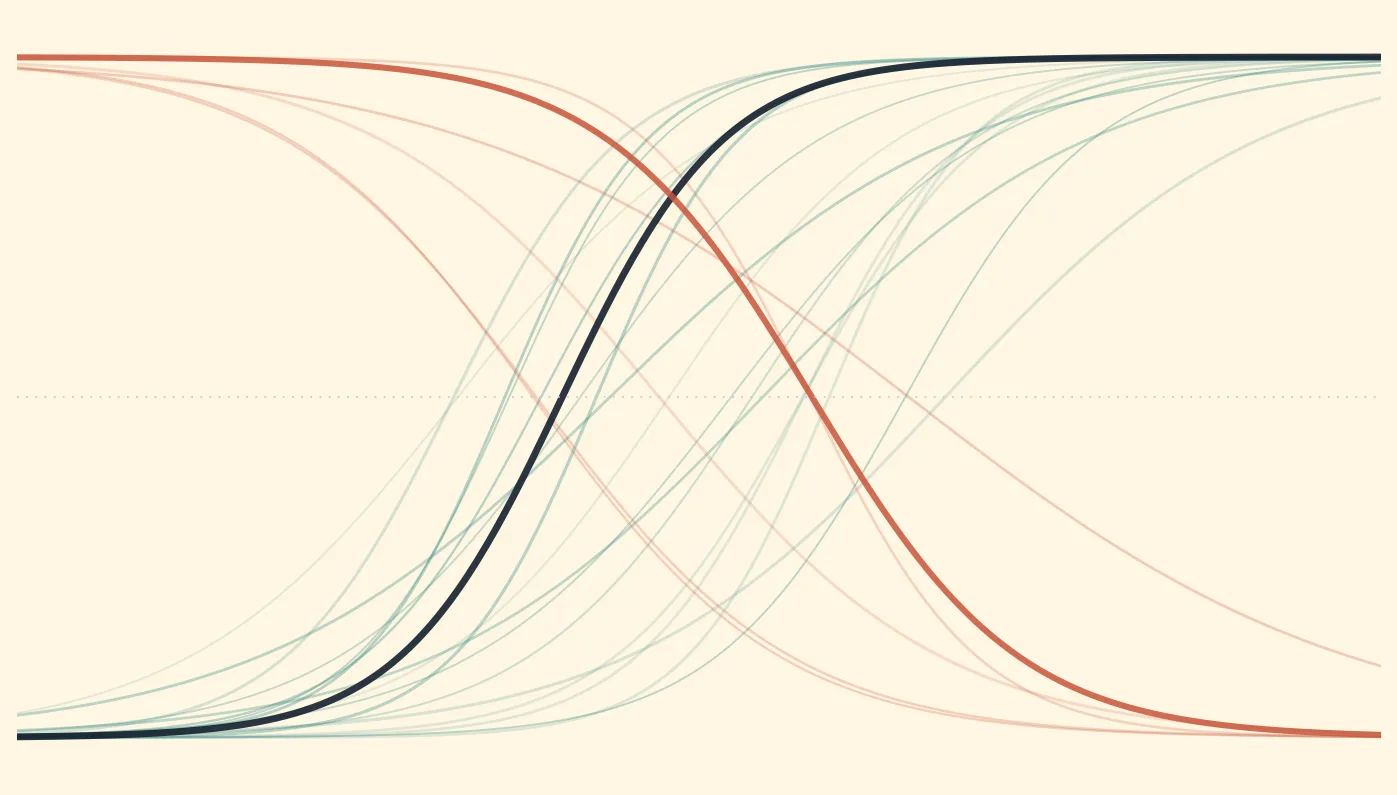
Differential scanning fluorimetry (DSF), also called ThermoFluor, measures protein unfolding by monitoring the fluorescence of an environmentally sensitive dye as temperature increases (Niesen et al., 2007):
-
Mix protein (1–10 µM) with SYPRO Orange dye
-
Heat from 20°C to 95°C at ~1°C/min in a qPCR machine
-
Monitor fluorescence (dye fluoresces when bound to exposed hydrophobic surfaces)
-
The inflection point of the sigmoid curve = Tm (melting temperature)
What Tm Actually Means
Tm is the temperature at which 50% of the protein population is unfolded. It reflects the thermodynamic stability of the folded state—specifically, the temperature at which ΔG_unfolding = 0.
What Tm tells you:
-
The temperature at which the protein unfolds cooperatively
-
Relative comparisons: Condition A (Tm = 55°C) is more thermodynamically stabilizing than Condition B (Tm = 48°C) for unfolding
-
Ligand binding: if a compound shifts Tm, it likely binds to the folded state
What Tm does NOT tell you:
-
How stable the protein is at 4°C, 25°C, or 37°C
-
Whether the protein will aggregate
-
How long the protein retains activity
-
Whether the protein is kinetically stable (resistant to unfolding at working temperature)
The Critical Distinction: Thermodynamic vs Kinetic vs Colloidal Stability
| Type | Definition | Measured By | Relevant For |
|---|---|---|---|
| Thermodynamic | Resistance to unfolding | Tm, ΔG_unfolding | Understanding folding energy landscape |
| Kinetic | Rate of unfolding at a given temperature | Unfolding half-life | Shelf-life, storage |
| Colloidal | Resistance to aggregation in solution | DLS, SEC over time | Formulation, concentration |
| Conformational | Resistance to local structural changes | HDX-MS, NMR | Functional stability |
DSF measures only thermodynamic stability. The other three types are often more relevant to practical applications.
Five Ways Tm Misleads You
Misleading Scenario 1: High Tm, Rapid Aggregation
The situation: Your variant has Tm = 72°C (wild-type: 58°C). Fourteen degrees improvement. But at 37°C, the variant aggregates 3x faster than wild-type.
Why this happens:
Tm measures the temperature of cooperative unfolding. It says nothing about the protein's behavior at temperatures below the Tm. A protein can have:
-
High Tm but exposed aggregation-prone regions on the native-state surface
-
High Tm but poor colloidal stability (low net charge, hydrophobic patches)
-
High Tm but conformational breathing that exposes aggregation hotspots transiently
Studies on antibody stability show that Tm and aggregation rate at 37°C have surprisingly weak correlation (R² ~ 0.2–0.4 across diverse antibody panels). Some antibodies with modest Tm values (60°C) have excellent colloidal stability, while others with high Tm (75°C) aggregate readily.
The fix: Measure aggregation directly. Incubate at your working temperature for 7–14 days. Run SEC weekly. The SEC profile tells you what DSF can't.
Misleading Scenario 2: Tm Shift from Ligand Binding Confused with Stabilization
The situation: You screen a fragment library against your protein by DSF. Compound X shifts Tm by +6°C. You celebrate a hit. But in the activity assay, Compound X is inactive—it doesn't bind in the functional site.
Why this happens:
Thermal shift assays detect ligand binding to the native state—any binding that stabilizes the folded form will shift Tm. This includes:
-
Active site binders (desired)
-
Allosteric site binders (sometimes desired)
-
Crystal contact-mediating molecules (not useful)
-
Nonspecific hydrophobic binders (artifact)
-
Colloidal aggregators that sequester the protein (Cimmperman et al., 2008)
Shoichet and colleagues showed that colloidal aggregators—a major source of false positives in biochemical screening—can produce apparent Tm shifts in DSF by sequestering the protein and preventing dye access.
The fix: Always validate Tm shifts with orthogonal binding assays (SPR, ITC, or functional assays). A Tm shift alone does not confirm meaningful binding.
Misleading Scenario 3: Multi-Domain Proteins Give Uninterpretable Curves
The situation: Your three-domain protein gives a broad, asymmetric melt curve. You fit a single Tm of 56°C. But the curve clearly isn't a two-state sigmoid—it has a shoulder. What's the real stability?
Why this happens:
DSF assumes two-state unfolding (folded ↔ unfolded). Multi-domain proteins often unfold in steps:
Domain 1 unfolds at 48°C → Domain 2 unfolds at 58°C → Domain 3 unfolds at 72°C
The DSF curve is the sum of these transitions. Fitting a single Tm to a multi-transition curve gives a meaningless number somewhere in the middle.
How to recognize it:
-
Melt curve is asymmetric or has shoulders
-
First derivative plot shows multiple peaks
-
Fitted Tm changes depending on the fitting window
The fix:
-
Use nanoDSF (label-free, intrinsic tryptophan fluorescence)—often resolves transitions better
-
Use DSC (differential scanning calorimetry) for proper thermodynamic analysis of multi-state unfolding
-
Fit individual transitions if they're resolved
-
Report all transitions, not just a single Tm
Misleading Scenario 4: Buffer Artifacts Shift Tm Without Changing Real Stability
The situation: Your protein in Tris pH 8.0 has Tm = 52°C. In phosphate pH 7.5, Tm = 60°C. You switch to phosphate. But the protein's functional half-life at 37°C is the same in both buffers.
Why this happens:
Some buffer components interact with the unfolded state differently than the folded state, shifting the apparent Tm without meaningfully changing stability at physiological temperature:
-
Tris has a large ΔpKa/ΔT (pH drops ~0.03 units per °C increase). At 70°C, your "pH 8.0" Tris buffer is actually pH ~6.5. If your protein is destabilized at pH 6.5, the apparent Tm is lower—but that's a buffer artifact, not a protein property.
-
Phosphate has minimal ΔpKa/ΔT, so the pH is stable across the temperature ramp.
-
High salt can stabilize the unfolded state (more hydrophobic surface exposed = more solvation by ions), which shifts Tm in complex ways.
The fix: For DSF screening, use buffers with low temperature coefficients (HEPES, MOPS, phosphate). For comparing conditions, ensure pH is matched at the relevant temperature, not just at room temperature. And always validate with functional stability at your working temperature.
Misleading Scenario 5: Mutations Increase Tm but Decrease Activity
The situation: Your stabilizing mutation increases Tm by +8°C. But kcat drops by 50%. The protein is more thermostable but less active.
Why this happens:
The stability-activity tradeoff is one of the most fundamental tensions in protein engineering (Shoichet et al., 1995). Many enzymes require conformational flexibility for catalysis:
-
Substrate binding may require loop opening
-
Transition state stabilization may involve conformational changes
-
Product release often requires domain movements
Stabilizing mutations that rigidify these dynamic elements increase Tm but reduce catalytic function. The protein is "more stable" by the thermodynamic definition but less useful by any practical definition.
The numbers: A systematic study of 162 stabilizing mutations in enzymes found that ~30% reduced activity by >2-fold. The more the mutation rigidified the active site region, the greater the activity loss.
The fix: Always measure activity alongside stability. The goal isn't maximum Tm—it's maximum useful stability (stable enough + sufficiently active). Report Tm AND kcat/Km together.
When DSF IS Reliable
DSF is genuinely useful for:
Buffer Screening
Comparing the same protein across buffer conditions (pH, salt, additives) by Tm is valid. Relative rankings are usually reliable even if absolute Tm values don't predict real-world stability perfectly.
Best practice: Use Tm for initial screening, then validate top conditions with accelerated stability (37°C for 7 days, measure activity + SEC).
Ligand Binding Confirmation
If you already have evidence of binding (from SPR, ITC, or functional assays), a DSF thermal shift confirms that the ligand stabilizes the native state. The magnitude of the shift correlates roughly with binding affinity (Pantoliano et al., 2001).
Purification QC
Monitoring Tm across purification batches detects protein quality problems:
-
Batch 1: Tm = 55°C
-
Batch 2: Tm = 48°C → Something went wrong in purification
-
Batch 3: Tm = 54°C → Back to normal
Tm as a QC metric for batch consistency is excellent.
Ranking Stabilizing Mutations
For comparing variants of the same protein, DSF ranking is generally reliable:
-
Variant A (Tm +5°C) is likely more stable than Variant B (Tm +2°C) in most conditions
-
But verify that the most stable variant retains function
Better Stability Assessments
The Comprehensive Stability Panel
| Assay | What It Measures | Time/Cost | When to Use |
|---|---|---|---|
| DSF (Tm) | Thermodynamic unfolding temperature | 2 hours, cheap | Initial screening, QC |
| nanoDSF | Same as DSF, label-free | 2 hours, moderate | Multi-domain proteins, detergent-containing samples |
| DSC | Full thermodynamic profile (ΔH, ΔCp, multiple transitions) | 4–8 hours, expensive | Detailed characterization of top candidates |
| Accelerated stability (37°C) | Real-world stability over days/weeks | 1–4 weeks, cheap | Formulation development |
| SEC over time | Aggregation kinetics | 1–4 weeks, moderate | Colloidal stability |
| DLS | Particle size and polydispersity | 30 min, moderate | Quick aggregation check |
| Activity retention | Functional stability | Variable | The metric that actually matters |
The Minimum Viable Stability Assessment
If you can only do two things:
-
DSF for thermodynamic stability ranking
-
Activity retention at working temperature over 7 days for functional stability
If these agree (variant with higher Tm also retains more activity), you're in good shape. If they disagree, trust the activity measurement.
Computational Alternatives and Complements to DSF
Predicting ΔTm from Sequence
Machine learning models can predict the effect of mutations on Tm without running experiments:
-
Trained on thousands of experimental ΔTm measurements
-
Use protein language model embeddings + structural features as input
-
Can scan all possible mutations in minutes
-
Accuracy is sufficient for ranking (Spearman ρ ~0.5–0.6 with experimental values)
Best use: Pre-screen hundreds of candidate mutations computationally, then measure the top 20–50 by DSF. This inverts the workflow: compute first, experiment to validate.
Predicting ΔΔG from Structure
Physics-based methods (FoldX, Rosetta) and ML-based methods predict folding free energy changes:
-
ΔΔG < 0: stabilizing mutation
-
ΔΔG > 0: destabilizing mutation
-
Complements ΔTm predictions by capturing the energetic basis of stability
Combining ΔTm and ΔΔG predictions gives a more complete picture than either alone—a mutation that scores well on both metrics is more likely to genuinely stabilize the protein.
The Bottom Line
| Tm Observation | What It Means | What It Doesn't Mean |
|---|---|---|
| Tm increased by +10°C | Folded state is more thermodynamically stable | Protein won't aggregate at 37°C |
| Tm decreased by –5°C | Folded state is less stable | Protein is necessarily non-functional |
| Compound shifts Tm by +6°C | Compound binds to the native state | Compound is a functional ligand |
| Tm is 72°C | Protein is thermostable | Protein is suitable for your application |
| Two variants: Tm 60°C vs 55°C | The first is thermodynamically more stable | The first is a better candidate overall |
The core message: Tm is the beginning of a stability assessment, not the end. Use it for screening and ranking. Validate with functional and colloidal stability measurements. Never make final decisions based on Tm alone.
Predicting Stability Beyond Tm with Orbion
Orbion's Stabilize module goes beyond single-metric stability assessment. AstraDTM predicts ΔTm for any mutation, while AstraDDG predicts ΔΔG—giving you both the thermodynamic and energetic perspectives on stability changes. AstraUNFOLD adds per-residue disorder and amyloidogenicity predictions, flagging variants that might increase aggregation propensity even while improving Tm.
For each variant, the platform reports biophysical deltas (Δdisorder, Δamyloidogenicity, ΔpLDDT) alongside stability metrics, and AstraBIND checks that binding sites are preserved. This multi-metric approach mirrors best practices in experimental stability assessment—because a mutation that boosts Tm by 8°C but increases aggregation propensity is not a good mutation.
References
-
Niesen FH, et al. (2007). The use of differential scanning fluorimetry to detect ligand interactions that promote protein stability. Nature Protocols, 2(9):2212-2221. PMC2781531
-
Pantoliano MW, et al. (2001). High-density miniaturized thermal shift assays as a general strategy for drug discovery. Journal of Biomolecular Screening, 6(6):429-440. Link
-
Shoichet BK, et al. (1995). A relationship between protein stability and protein function. PNAS, 92(2):452-456. Link
-
Cimmperman P, et al. (2008). A quantitative model of thermal stabilization and destabilization of proteins by ligands. Biophysical Chemistry, 137(2-3):131-137. Link
-
Jain T, et al. (2017). Biophysical properties of the clinical-stage antibody landscape. PNAS, 114(5):944-949. PMC6999859
-
Buss O, et al. (2018). FoldX as protein engineering tool: better than random based approaches? Computational and Structural Biotechnology Journal, 16:25-33. PMC6820749
-
Shoichet BK. (2006). Interpreting steep dose-response curves in early inhibitor discovery. Journal of Medicinal Chemistry, 49(25):7274-7277. PMC4646424
-
Huynh K & Bhatt S. (2015). Protein thermal stability: its measurement and a thermodynamic approach. Methods in Molecular Biology, 1278:1-15. Link
-
Gao K, et al. (2020). The development of thermal shift assay for identifying inhibitors: a review. Expert Opinion on Drug Discovery, 15(10):1137-1150. Link
-
Ericsson UB, et al. (2006). Thermofluor-based high-throughput stability optimization of proteins for structural studies. Analytical Biochemistry, 357(2):289-298. Link