Blog
Orbion Team
The Batch-to-Batch Variability Problem in Protein Production

Last month's protein worked perfectly. Same construct, same protocol, same everything. This month's batch has half the activity, runs as multiple bands on the gel, and aggregates during concentration. You've changed nothing—but the results changed anyway.
Welcome to batch-to-batch variability, the silent killer of reproducibility in protein biochemistry.
Key Takeaways
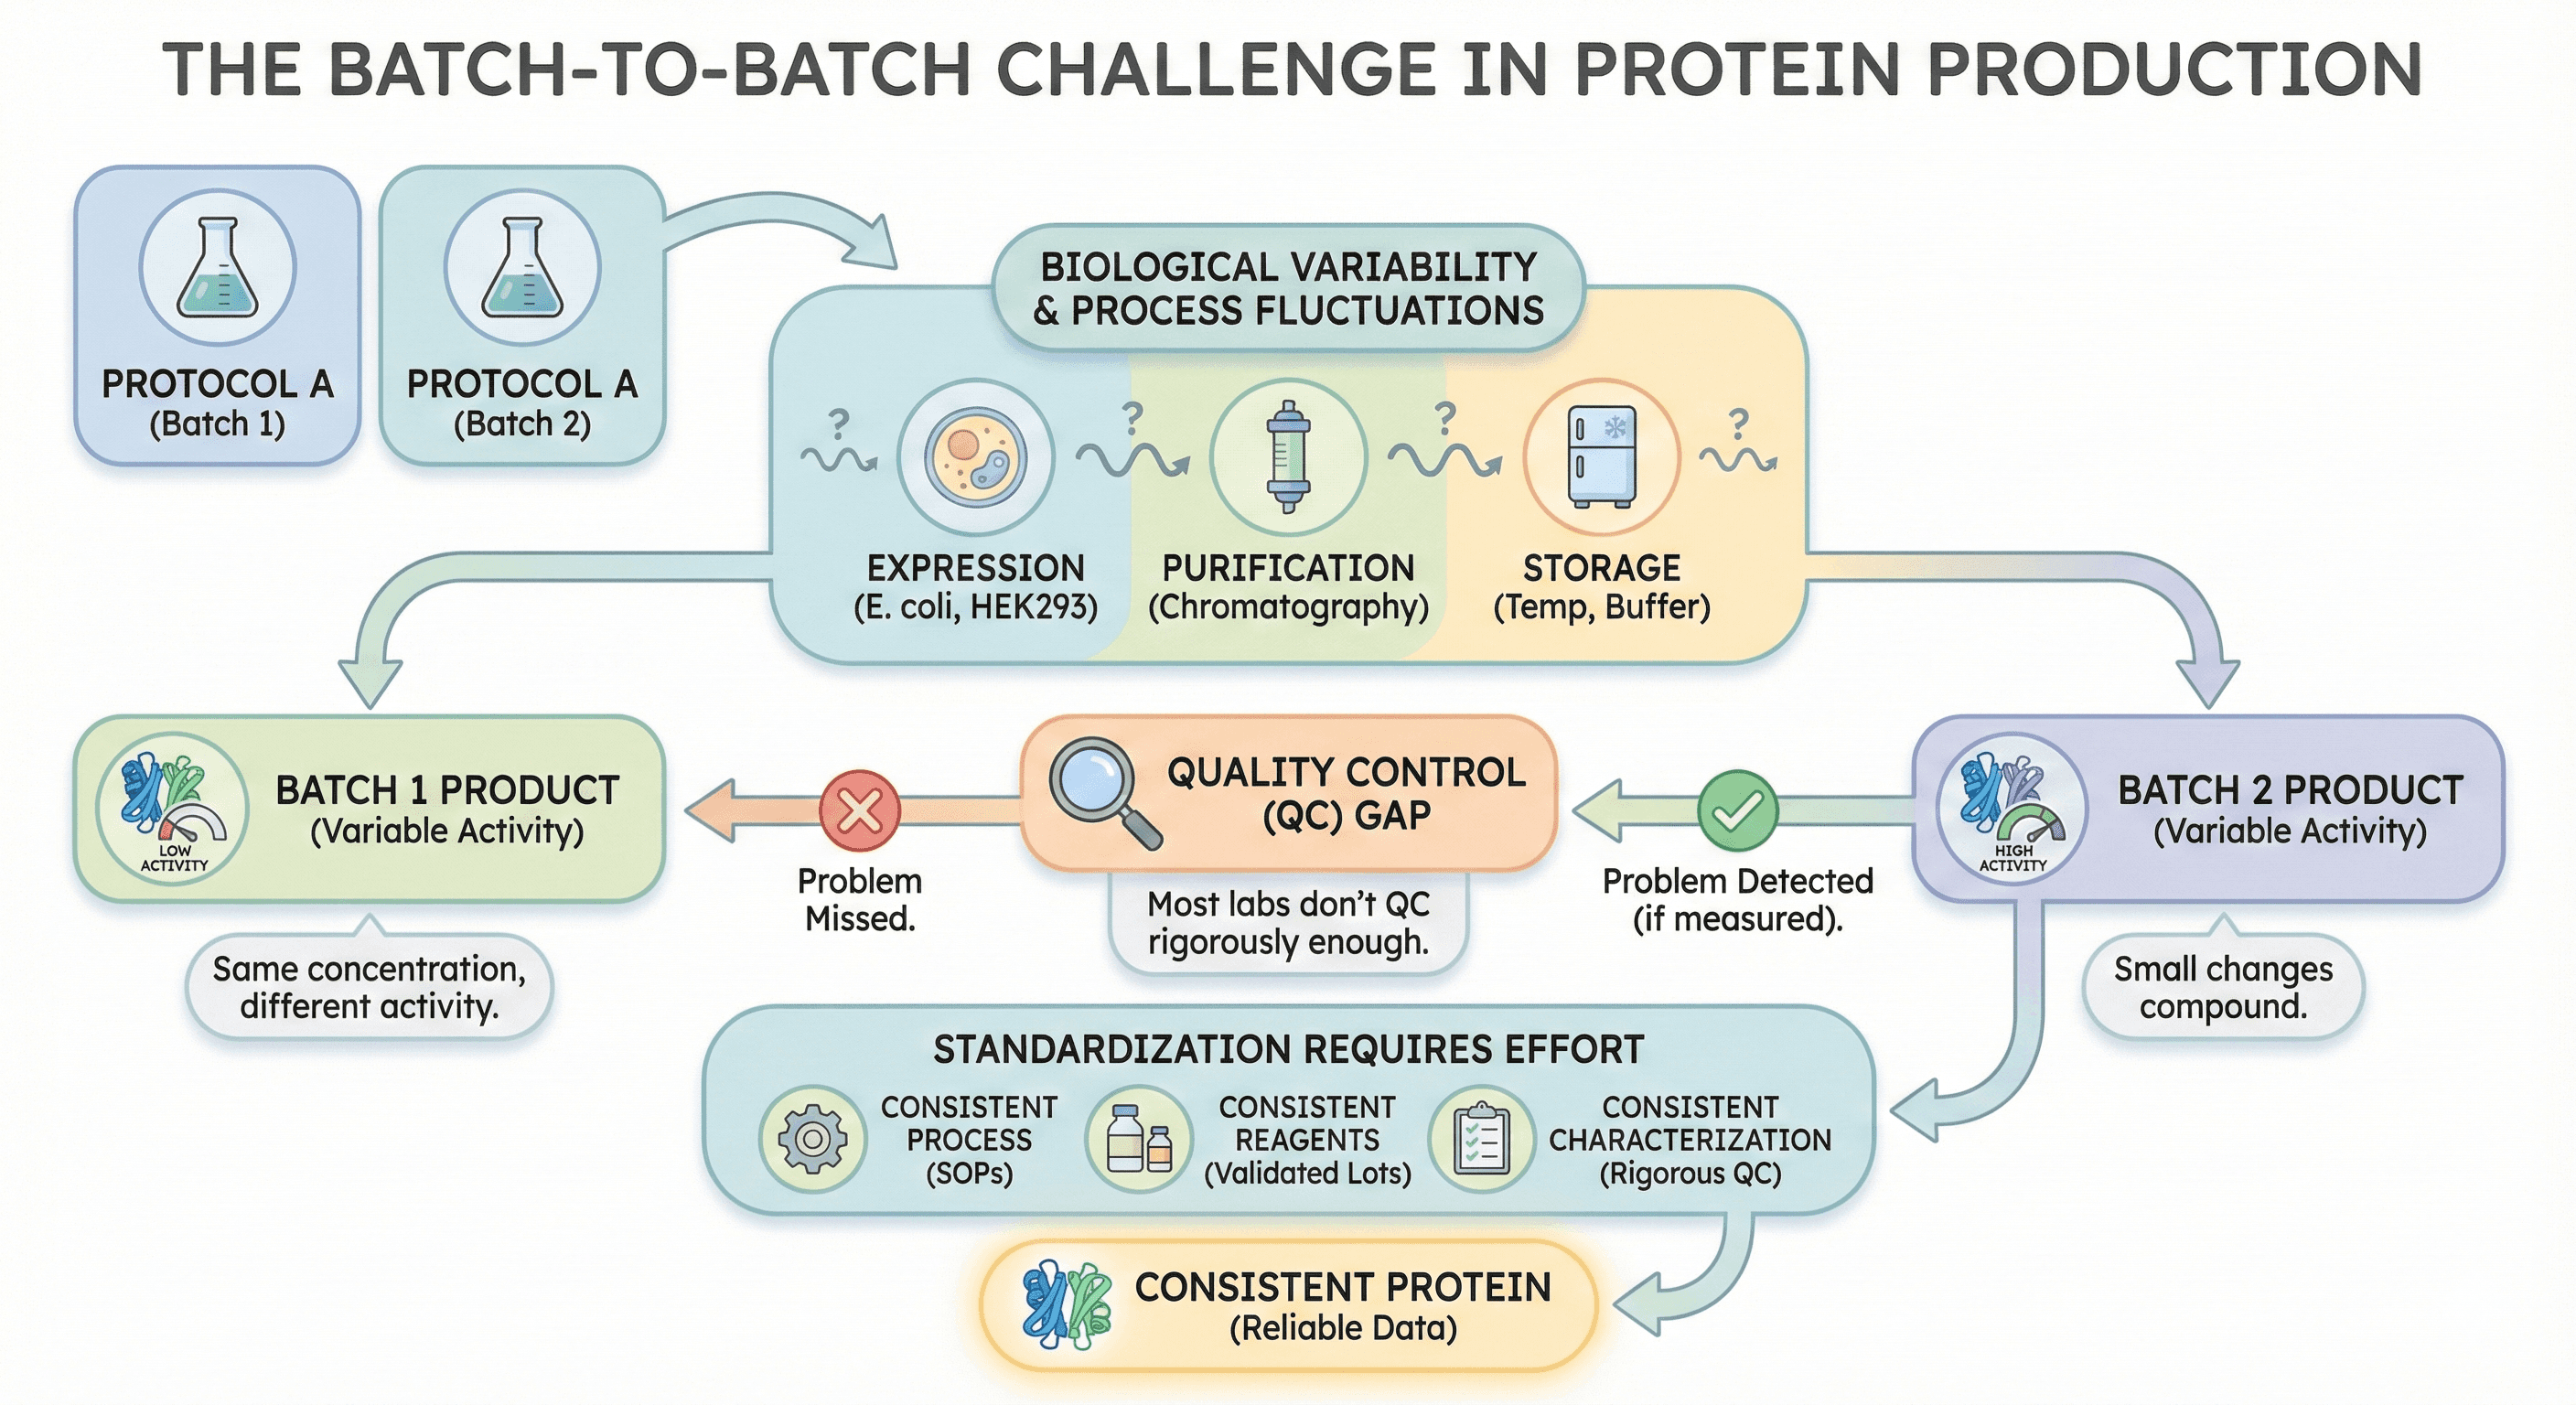
Identical protocols don't guarantee identical products: Biological production systems have inherent variability
Small changes compound: Minor fluctuations in expression, purification, and storage accumulate into major differences
Activity variation matters more than concentration: A batch with the same protein concentration can have vastly different specific activity
Quality control catches problems only if you measure: Most labs don't QC rigorously enough to detect batch differences
Standardization requires effort: Consistent protein requires consistent processes, reagents, and characterization
The Hidden Variability Problem
What Varies Between Batches
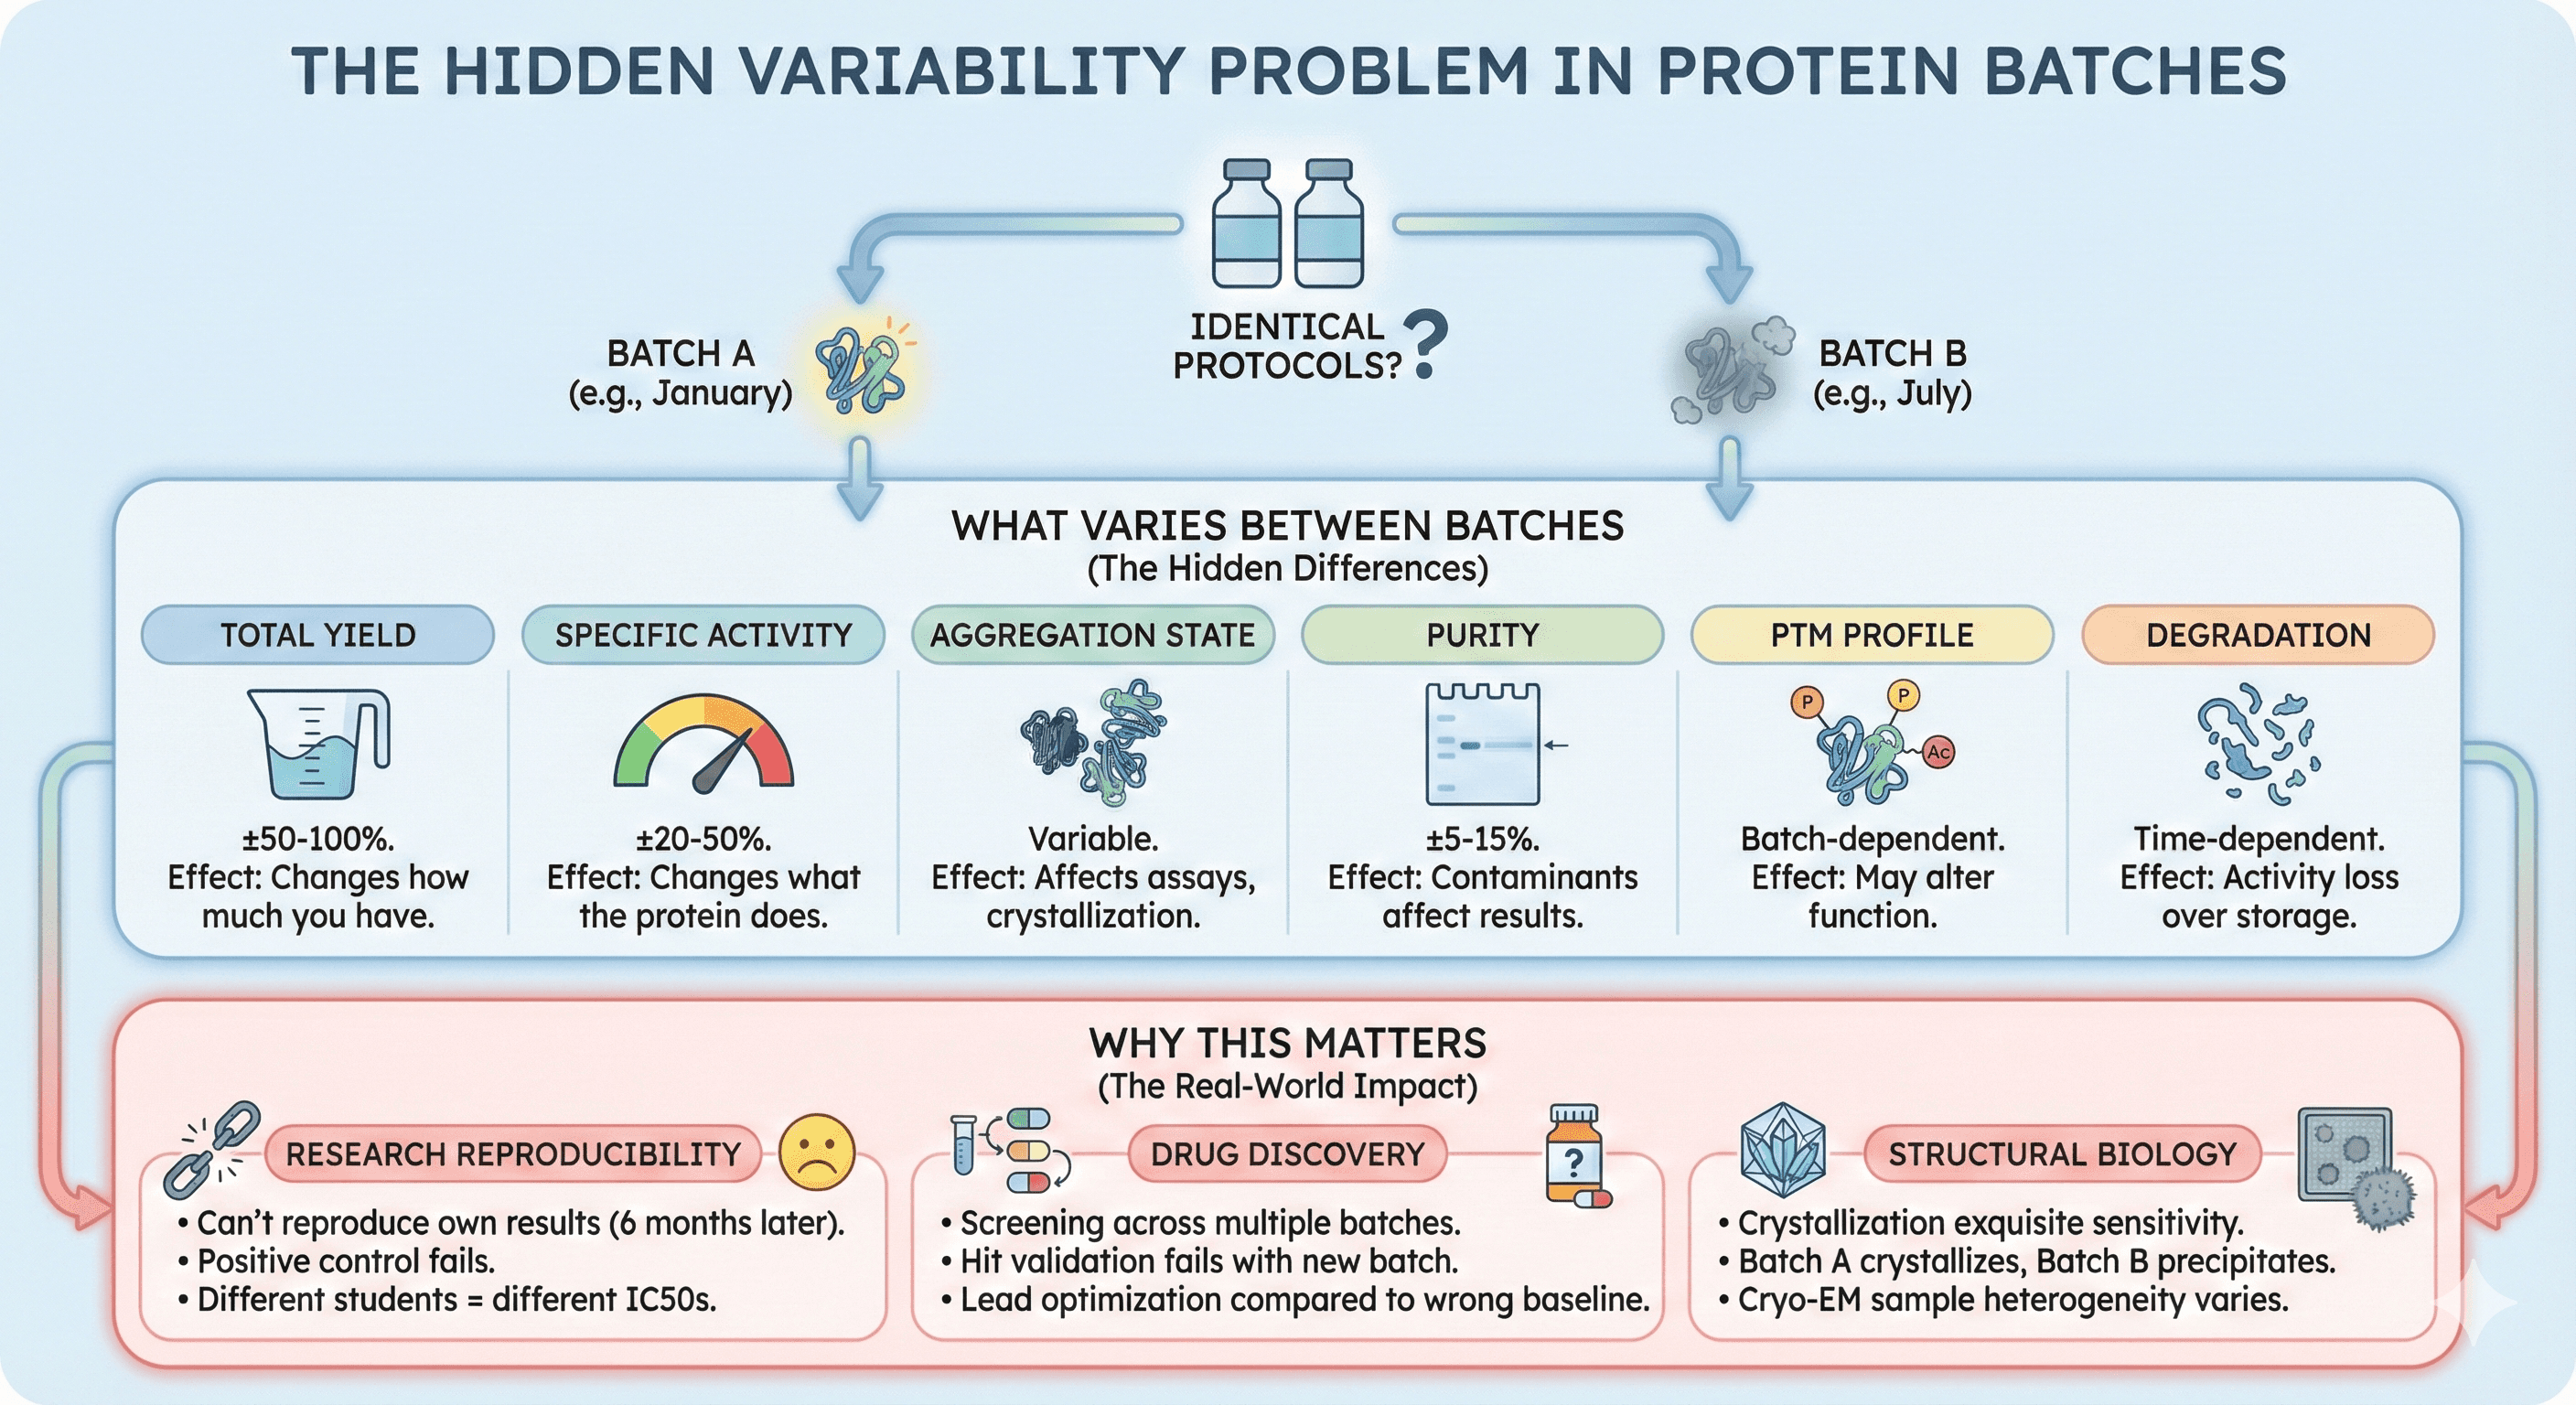
Even with "identical" protocols, each protein batch differs in:
Property | Typical Variation | Downstream Effect |
|---|---|---|
Total yield | ±50-100% | Changes how much you have |
Specific activity | ±20-50% | Changes what the protein does |
Aggregation state | Variable | Affects assays, crystallization |
Purity | ±5-15% | Contaminants affect results |
PTM profile | Batch-dependent | May alter function |
Degradation | Time-dependent | Activity loss over storage |
Why This Matters
Research reproducibility:
"We can't reproduce our own results from six months ago"
"The positive control doesn't work anymore"
"Different students get different IC50 values"
Drug discovery:
Screening campaigns span multiple protein batches
Hit validation uses different batch than primary screen
Lead optimization compared to wrong baseline
Structural biology:
Crystallization conditions are exquisitely sensitive to protein quality
Batch A crystallizes, Batch B doesn't—same conditions
Cryo-EM sample heterogeneity varies with batch
Sources of Variability
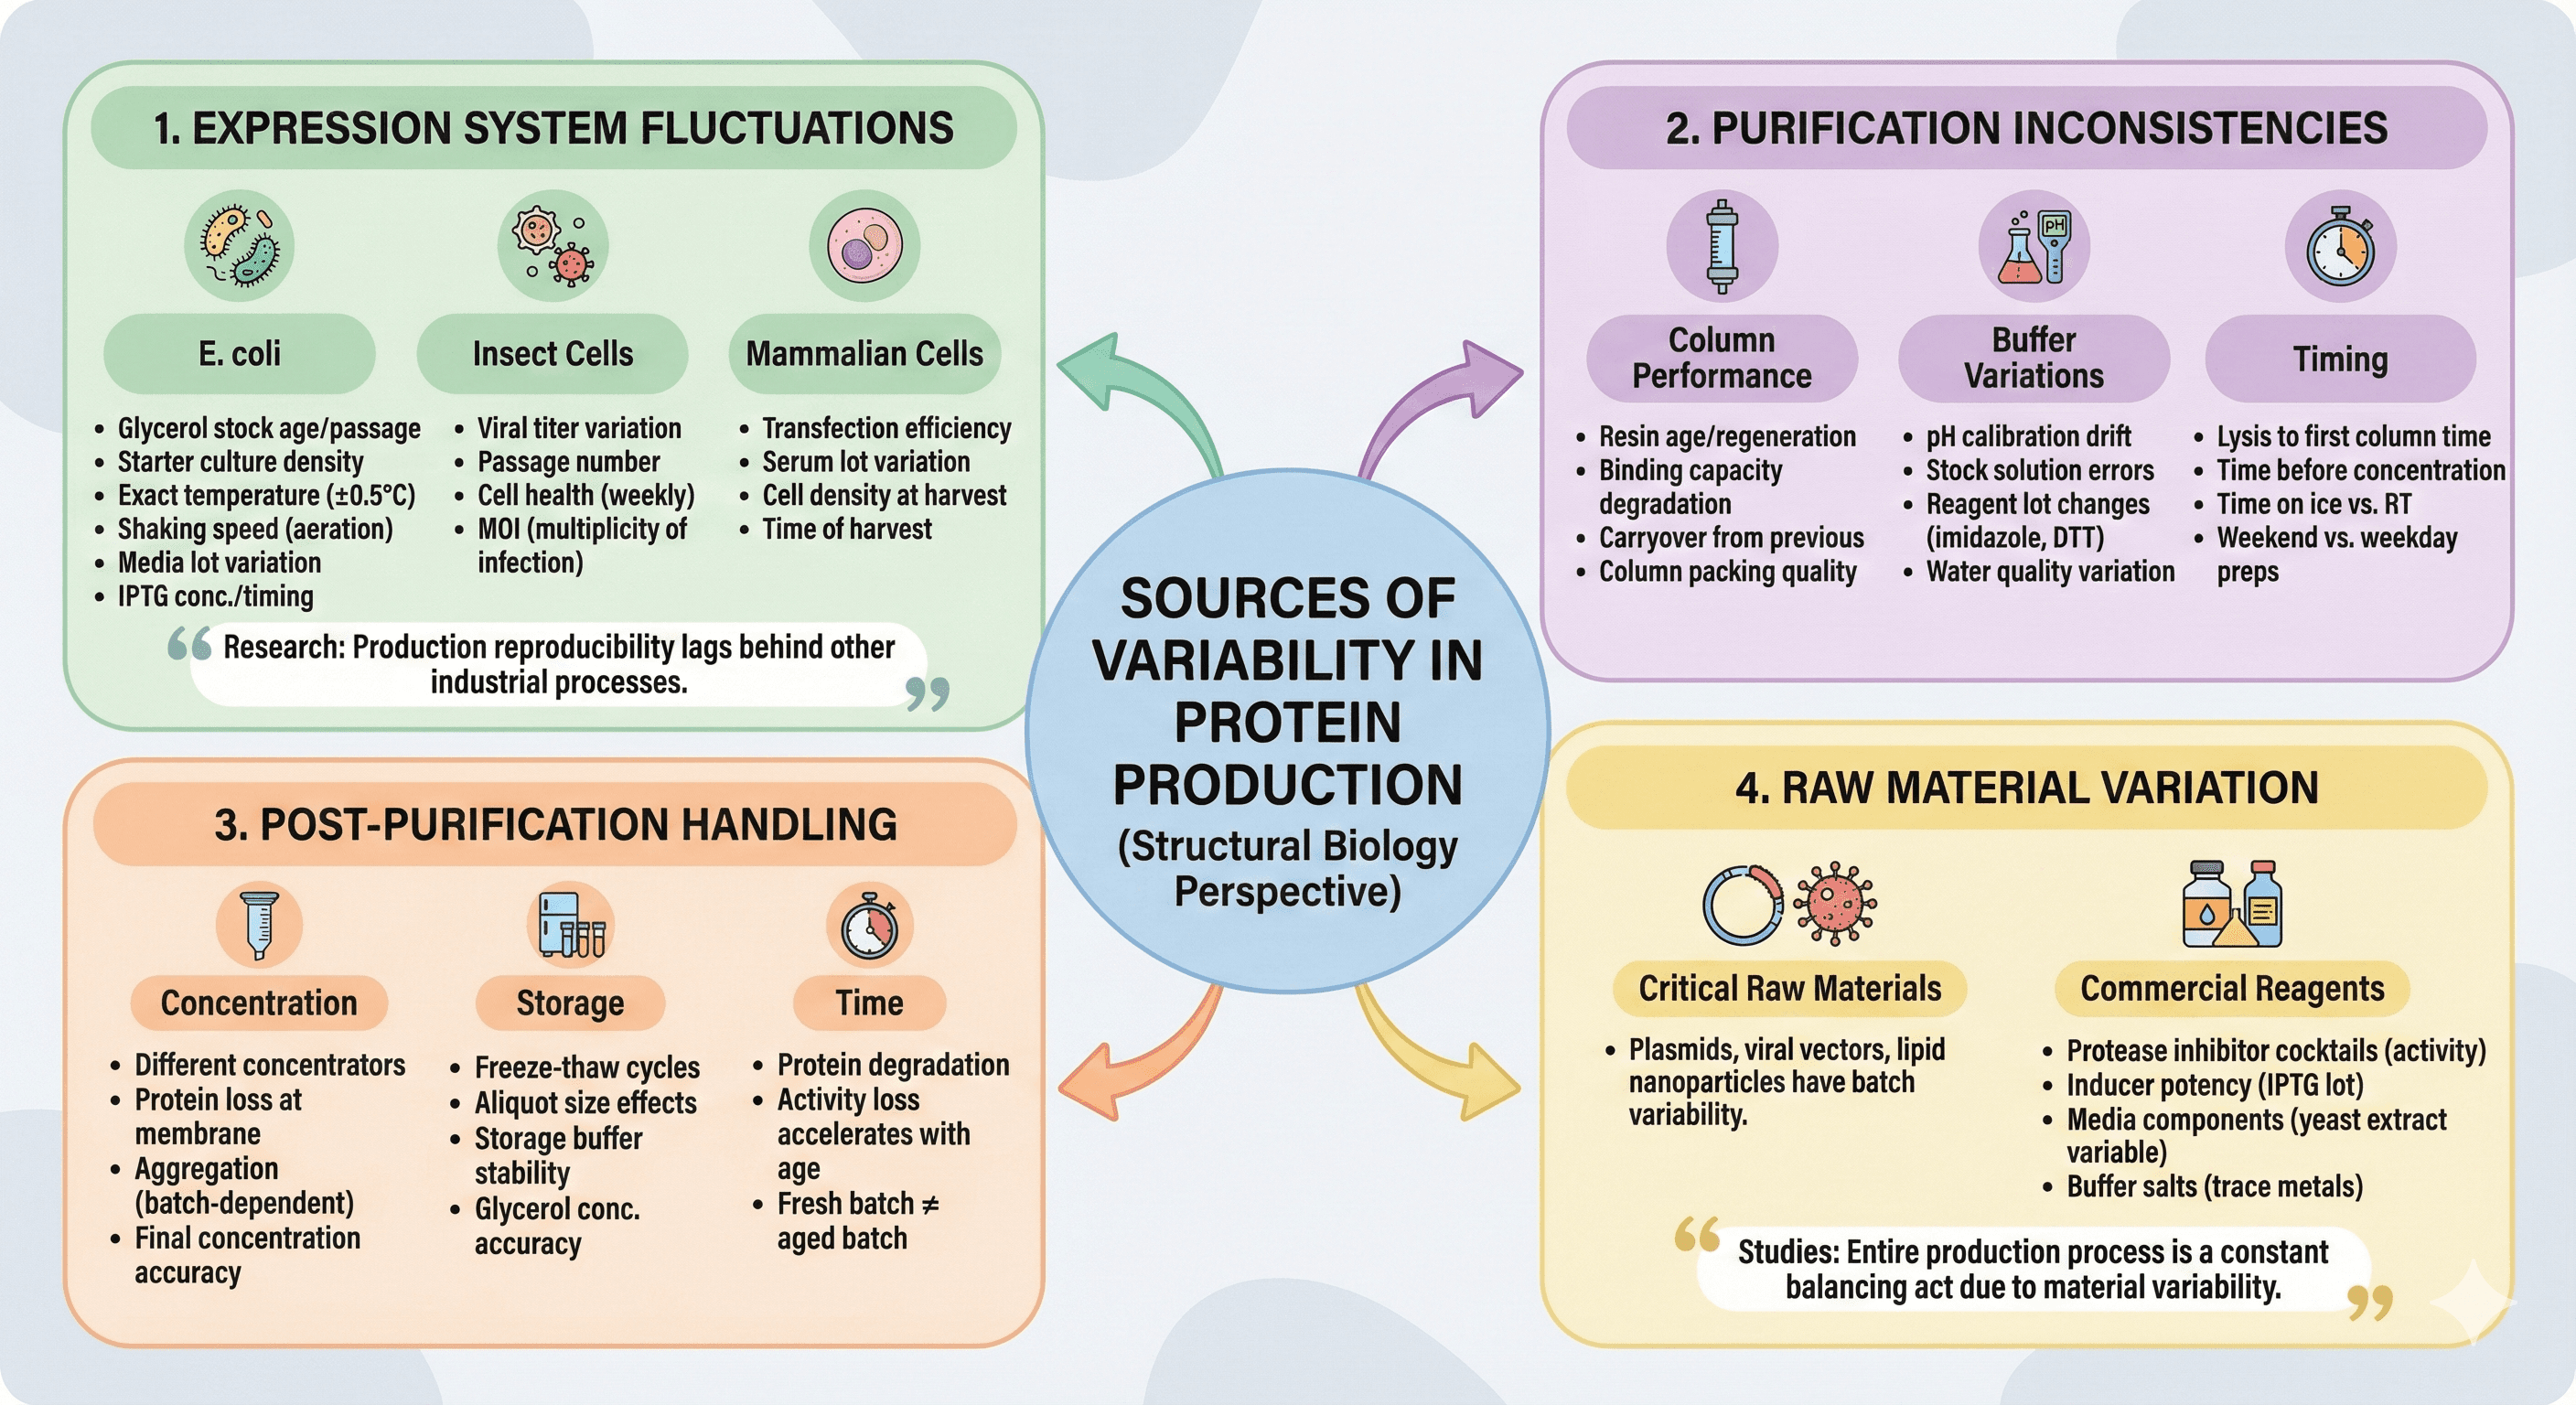
Source 1: Expression System Fluctuations
E. coli:
Glycerol stock age and passage number
Starter culture density at induction
Exact temperature (even ±0.5°C matters)
Shaking speed affects aeration
Media lot-to-lot variation
IPTG concentration and timing
Insect cells:
Viral titer variation
Passage number affects expression
Cell health varies week to week
MOI (multiplicity of infection) critical
Mammalian cells:
Transfection efficiency varies
Serum lot variation (if used)
Cell density at harvest
Time of harvest after transfection
Research on fed-batch cultures has shown that "with respect to batch-to-batch reproducibility, production processes for recombinant proteins are lagging far behind most other industrial processes."
Source 2: Purification Inconsistencies
Column performance:
Resin age and regeneration history
Binding capacity degrades over time
Carryover from previous purifications
Column packing quality
Buffer variations:
pH meter calibration drift
Stock solution concentration errors
Reagent lot changes (imidazole, DTT, etc.)
Water quality variation
Timing:
Time between lysis and first column
How long protein sits before concentration
Time on ice vs. at room temperature
Weekend preps vs. weekday preps
Source 3: Post-Purification Handling
Concentration:
Different concentrators have different characteristics
Protein loss at membrane varies
Aggregation during concentration is batch-dependent
Final concentration accuracy
Storage:
Freeze-thaw cycles
Aliquot size affects freeze-thaw damage
Storage buffer stability over time
Glycerol concentration accuracy
Time:
Protein degradation is time-dependent
Activity loss accelerates with age
Fresh batch ≠ aged batch
Source 4: Raw Material Variation
Studies emphasize that "critical raw materials such as plasmids, viral vectors, lipid nanoparticles, etc. also have batch-to-batch variability, which means the entire production process is a constant balancing act."
Even commercial reagents vary:
Protease inhibitor cocktails (activity varies)
Inducer potency (IPTG lot variation)
Media components (yeast extract is notoriously variable)
Buffer salts (trace metal contamination)
The Activity vs. Concentration Problem
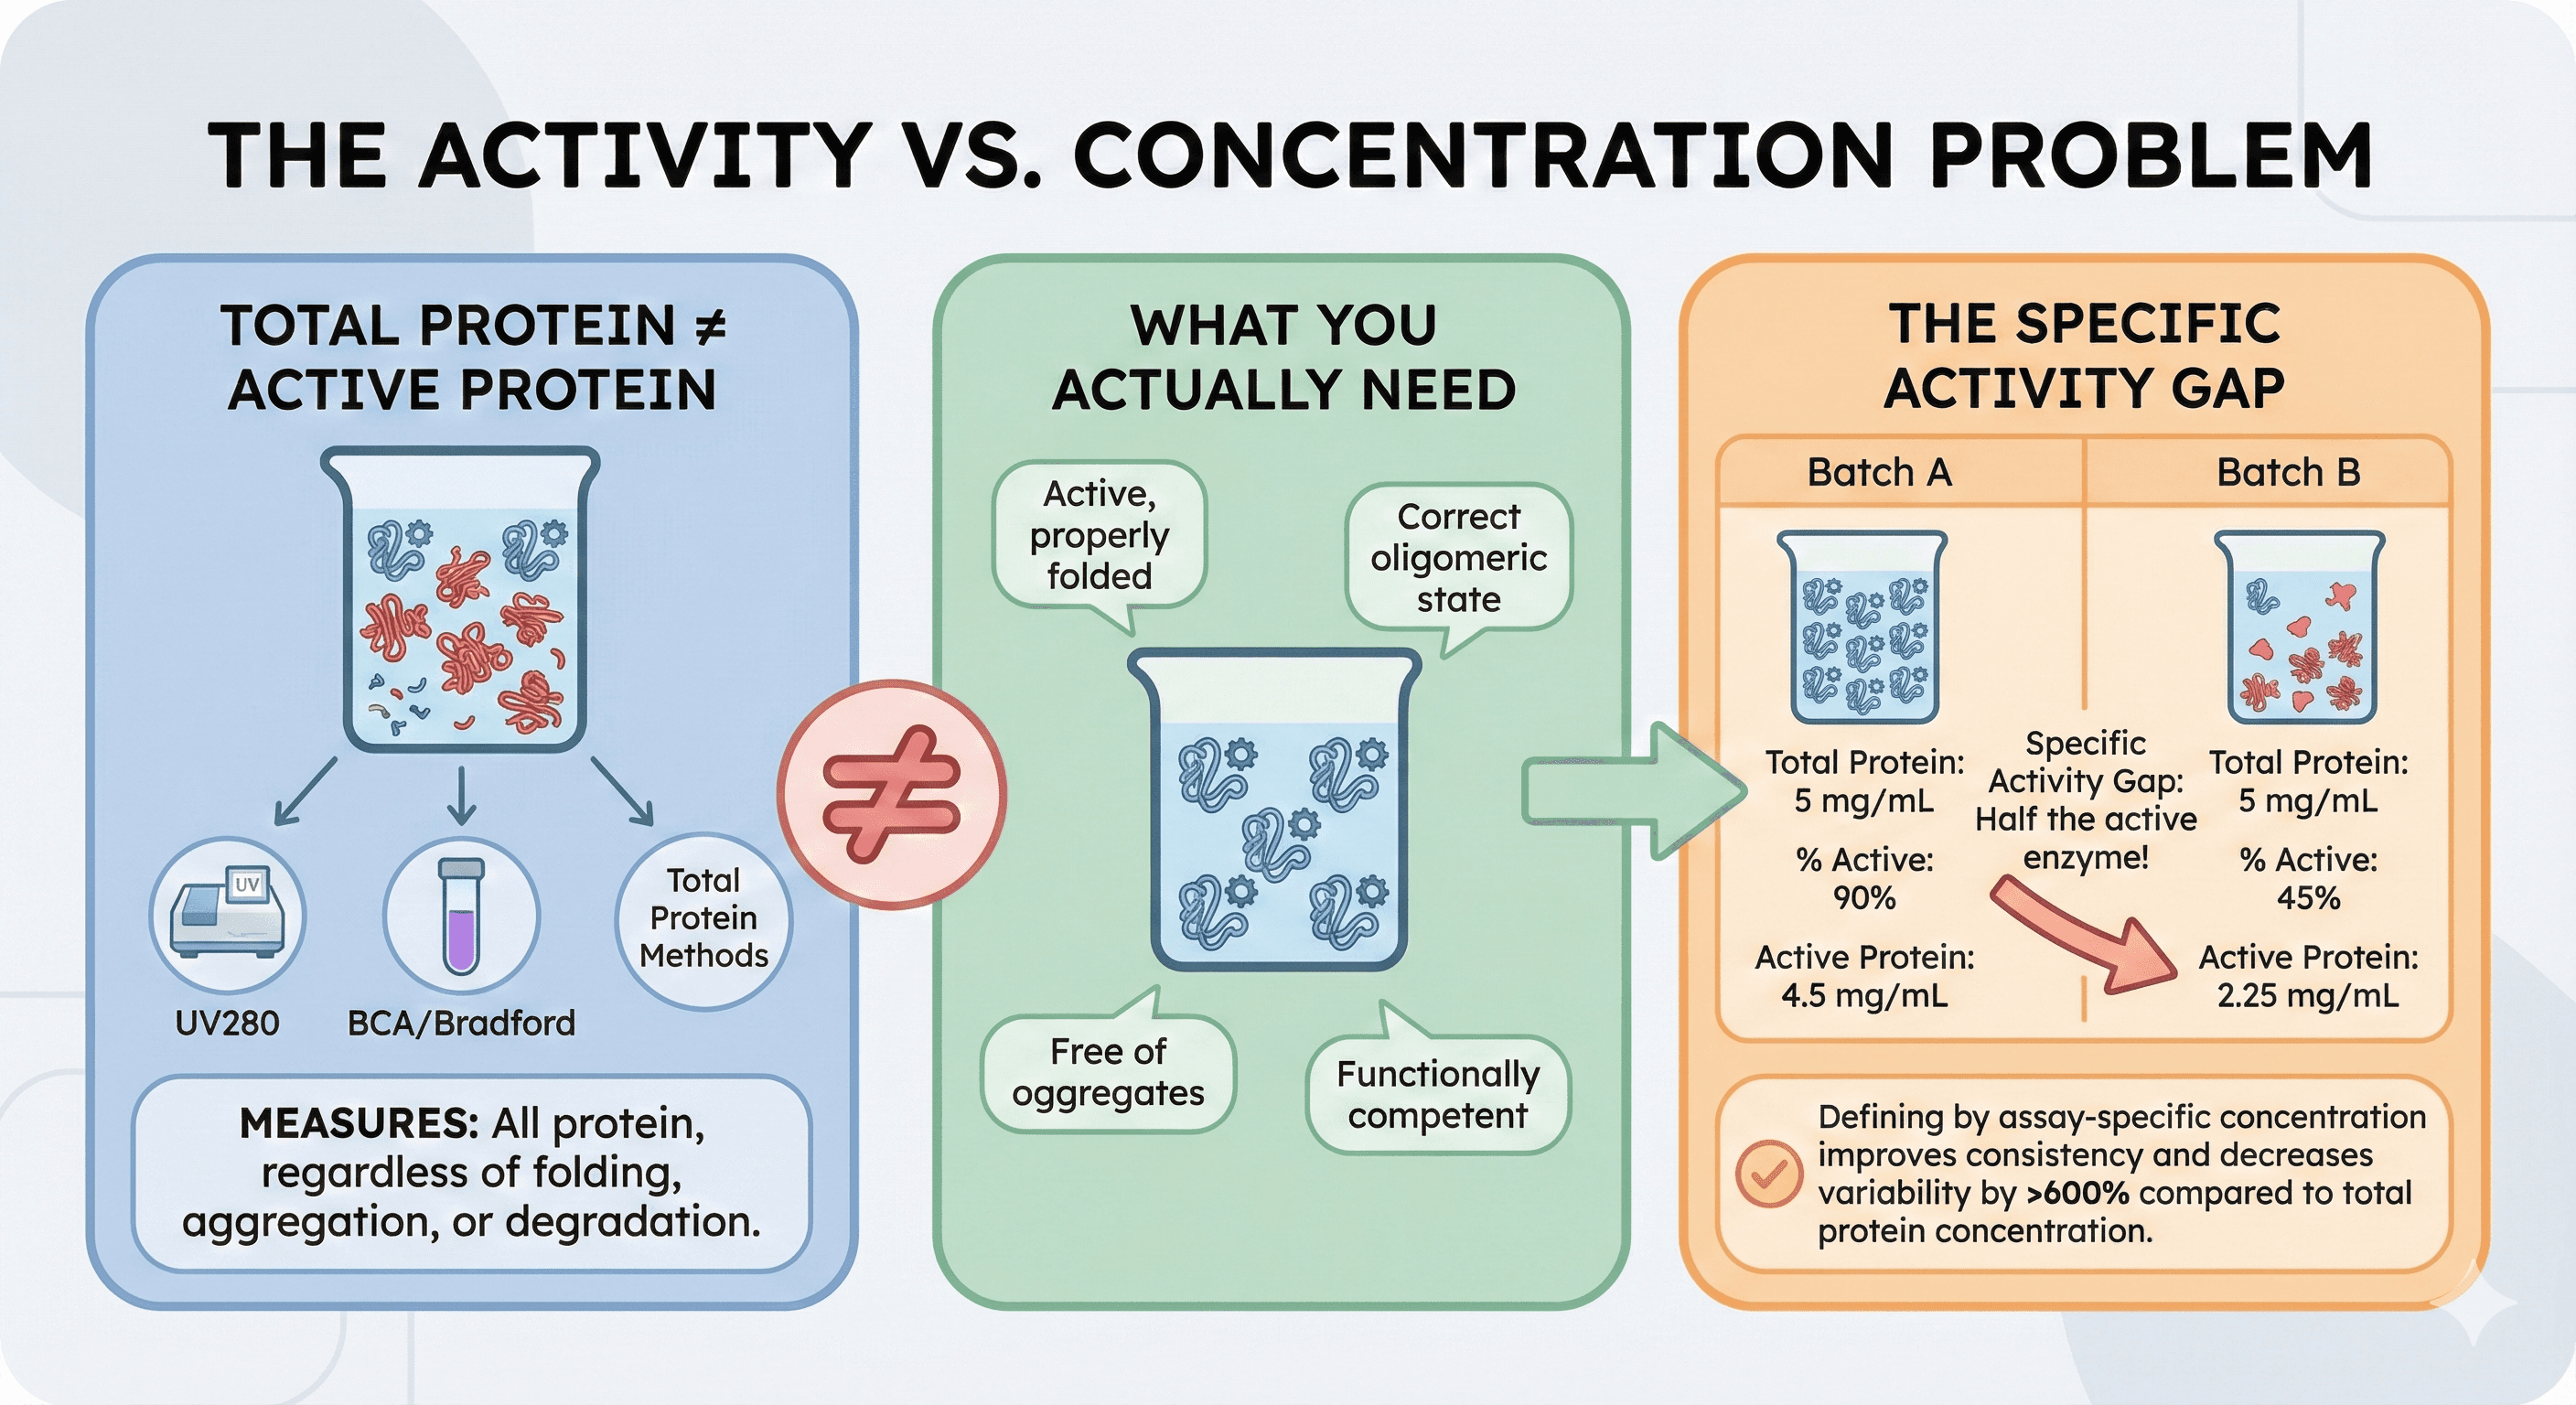
Total Protein ≠ Active Protein
Research has demonstrated that "lot-to-lot differences in protein activity often still occur, leading to uncertainty in the accuracy of downstream measurements. These differences are postulated to be caused by a misrepresentation of the protein concentration as measured by traditional total protein techniques, which can include multiple types of inactive protein species."
What total protein methods (UV280, BCA, Bradford) measure:
All protein, regardless of folding state
Aggregated protein counts the same as native
Inactive protein counts the same as active
Degraded fragments contribute to absorbance
What you actually need:
Active, properly folded protein
In the correct oligomeric state
Free of aggregates
Functionally competent
The Specific Activity Gap
Two batches, both at "5 mg/mL":
Batch | Total Protein | % Active | Active Protein |
|---|---|---|---|
A | 5 mg/mL | 90% | 4.5 mg/mL |
B | 5 mg/mL | 45% | 2.25 mg/mL |
If you normalize experiments by total protein concentration, Batch B has half the active enzyme—and your data won't make sense.
Studies found that "defining protein reagents by their assay-specific concentration improved consistency in reported kinetic binding parameters and decreased immunoassay lot-to-lot coefficients of variation (CVs) by over 600% compared to the total protein concentration."
Measuring Batch-to-Batch Variability
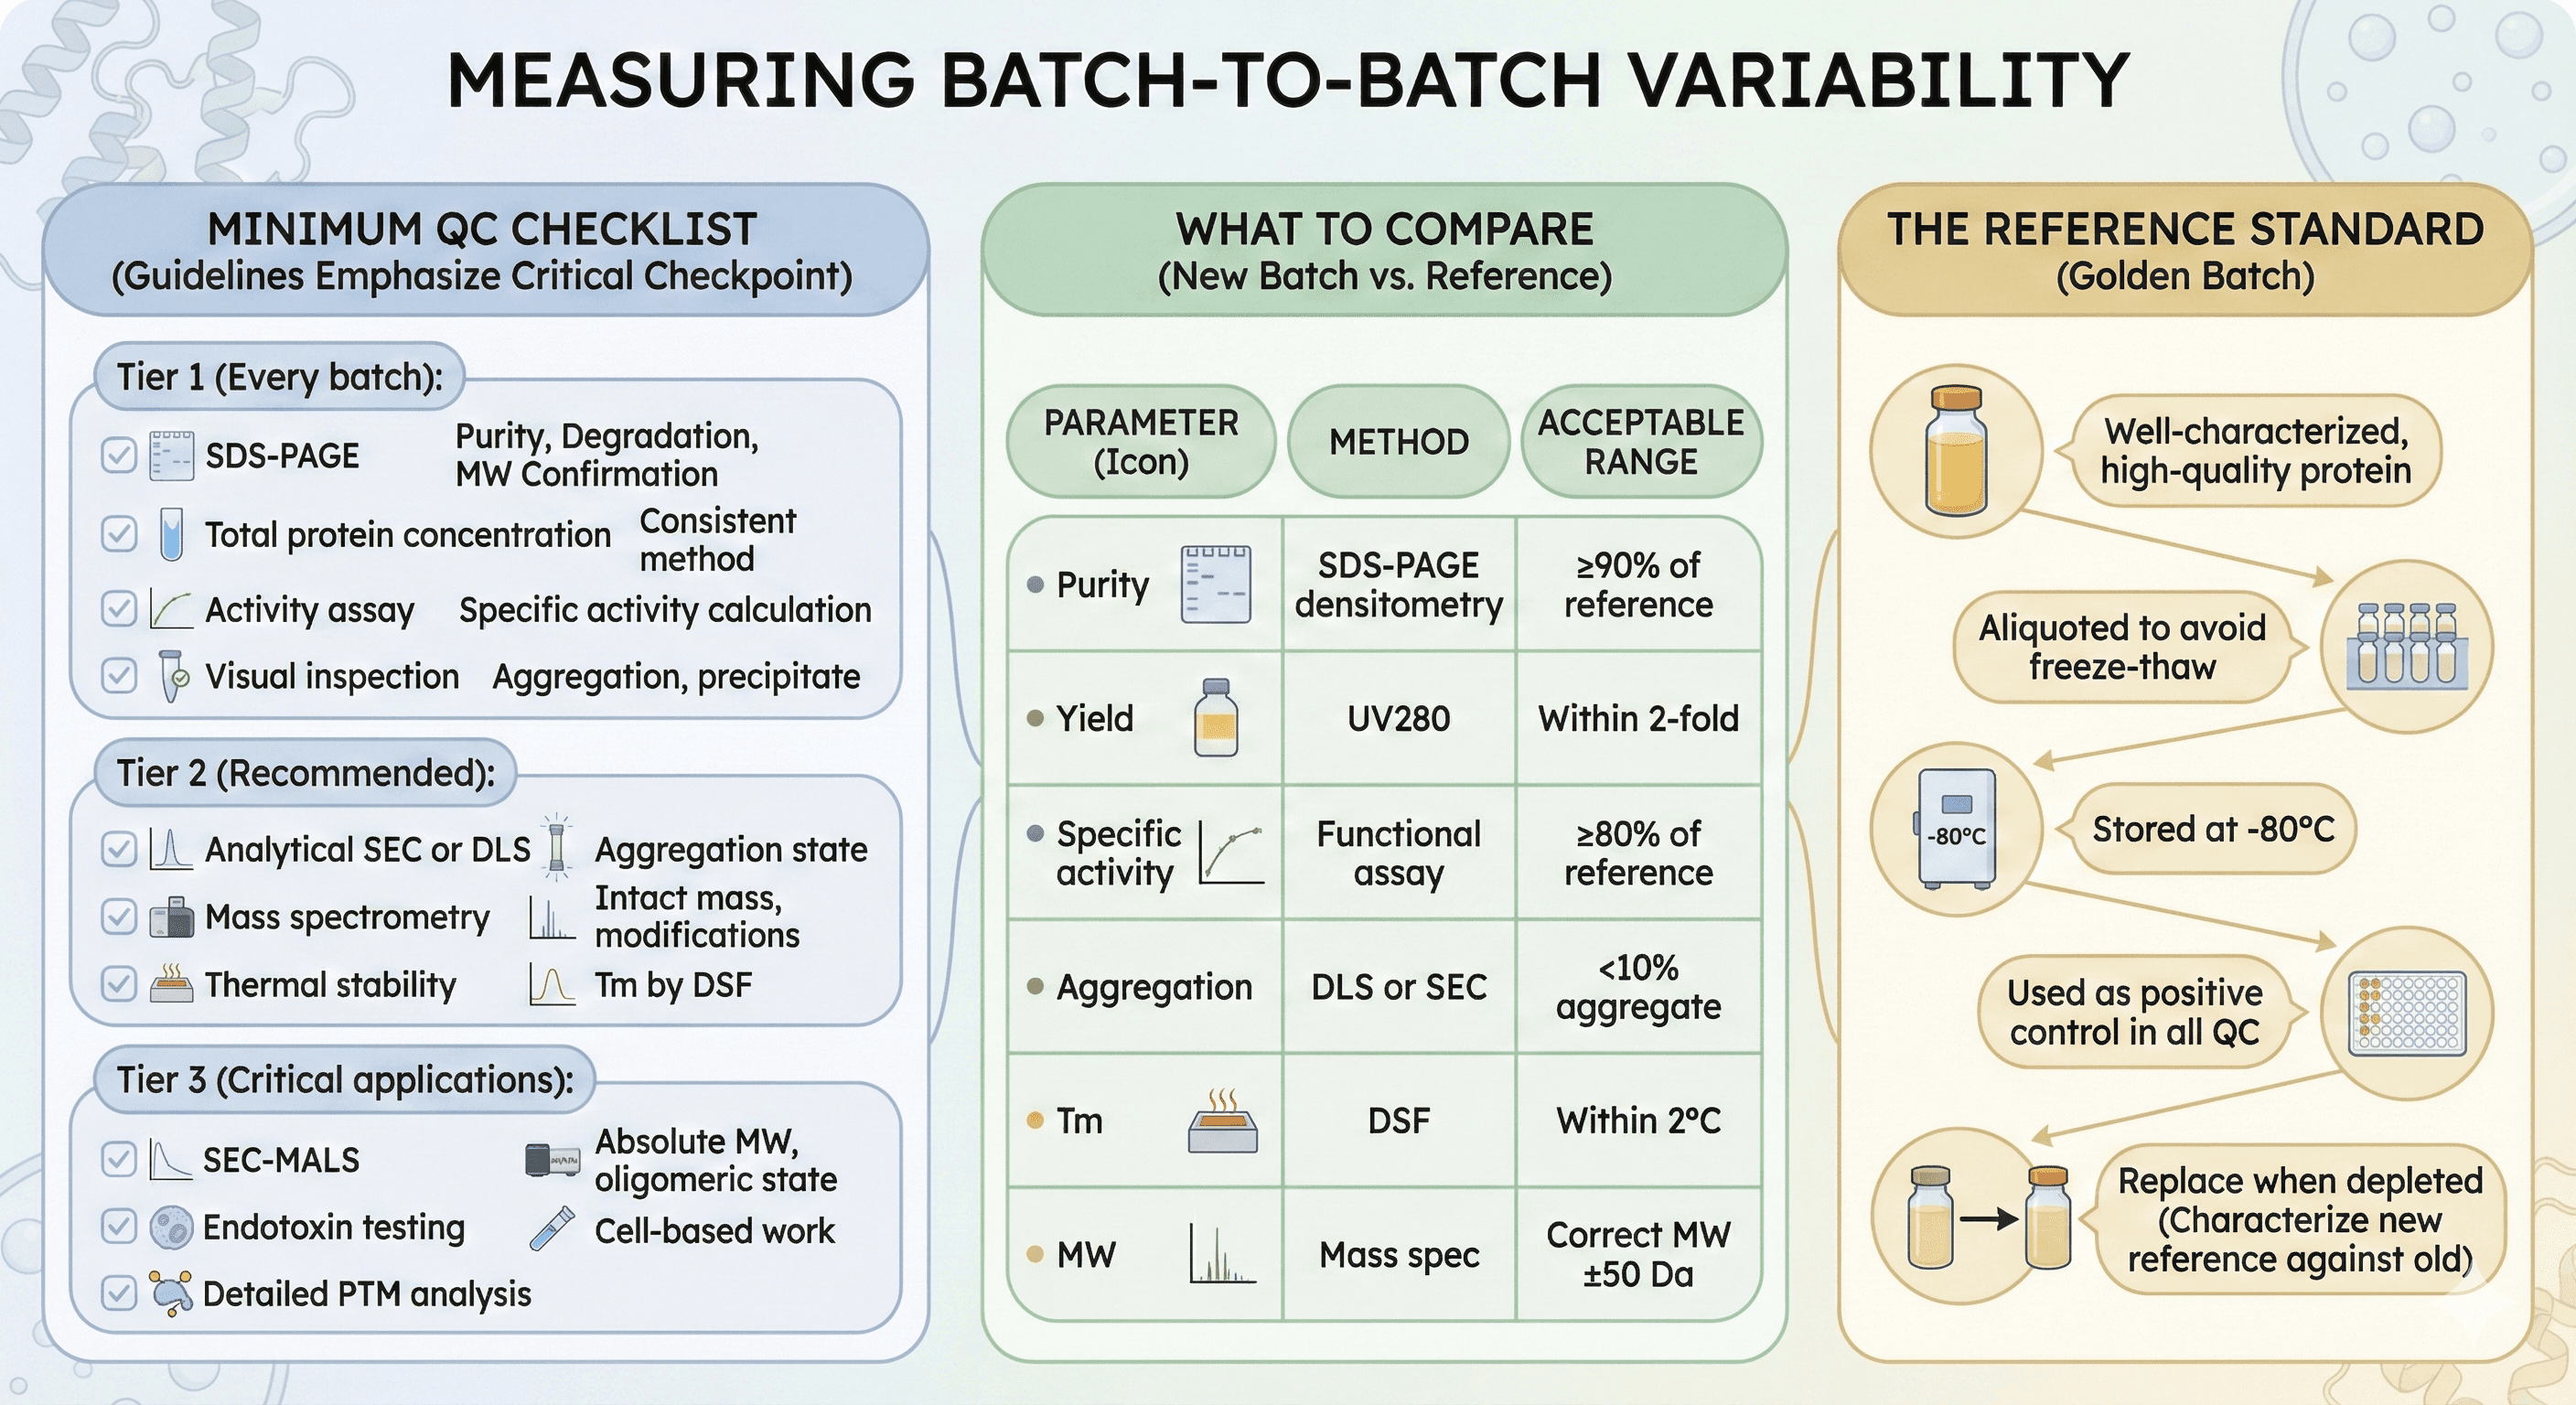
Minimum QC Checklist
Guidelines for protein quality assessment emphasize that "purified protein quality control is the final and critical checkpoint of any protein production process, though it is unfortunately too often overlooked and performed hastily."
Tier 1 (Every batch):
[ ] SDS-PAGE (purity, degradation, MW confirmation)
[ ] Total protein concentration (consistent method)
[ ] Activity assay (specific activity calculation)
[ ] Visual inspection (aggregation, precipitate)
Tier 2 (Recommended):
[ ] Analytical SEC or DLS (aggregation state)
[ ] Mass spectrometry (intact mass, modifications)
[ ] Thermal stability (Tm by DSF)
Tier 3 (Critical applications):
[ ] SEC-MALS (absolute MW, oligomeric state)
[ ] Endotoxin testing (cell-based work)
[ ] Detailed PTM analysis
What to Compare
For each new batch, compare to a reference batch:
Parameter | Method | Acceptable Range |
|---|---|---|
Purity | SDS-PAGE densitometry | ≥90% of reference |
Yield | UV280 | Within 2-fold |
Specific activity | Functional assay | ≥80% of reference |
Aggregation | DLS or SEC | <10% aggregate |
Tm | DSF | Within 2°C |
MW | Mass spec | Correct MW ±50 Da |
The Reference Standard
Keep a reference batch for comparison:
Well-characterized, high-quality protein
Aliquoted to avoid freeze-thaw
Stored at -80°C
Used as positive control in all QC
Replace when depleted (characterize new reference against old)
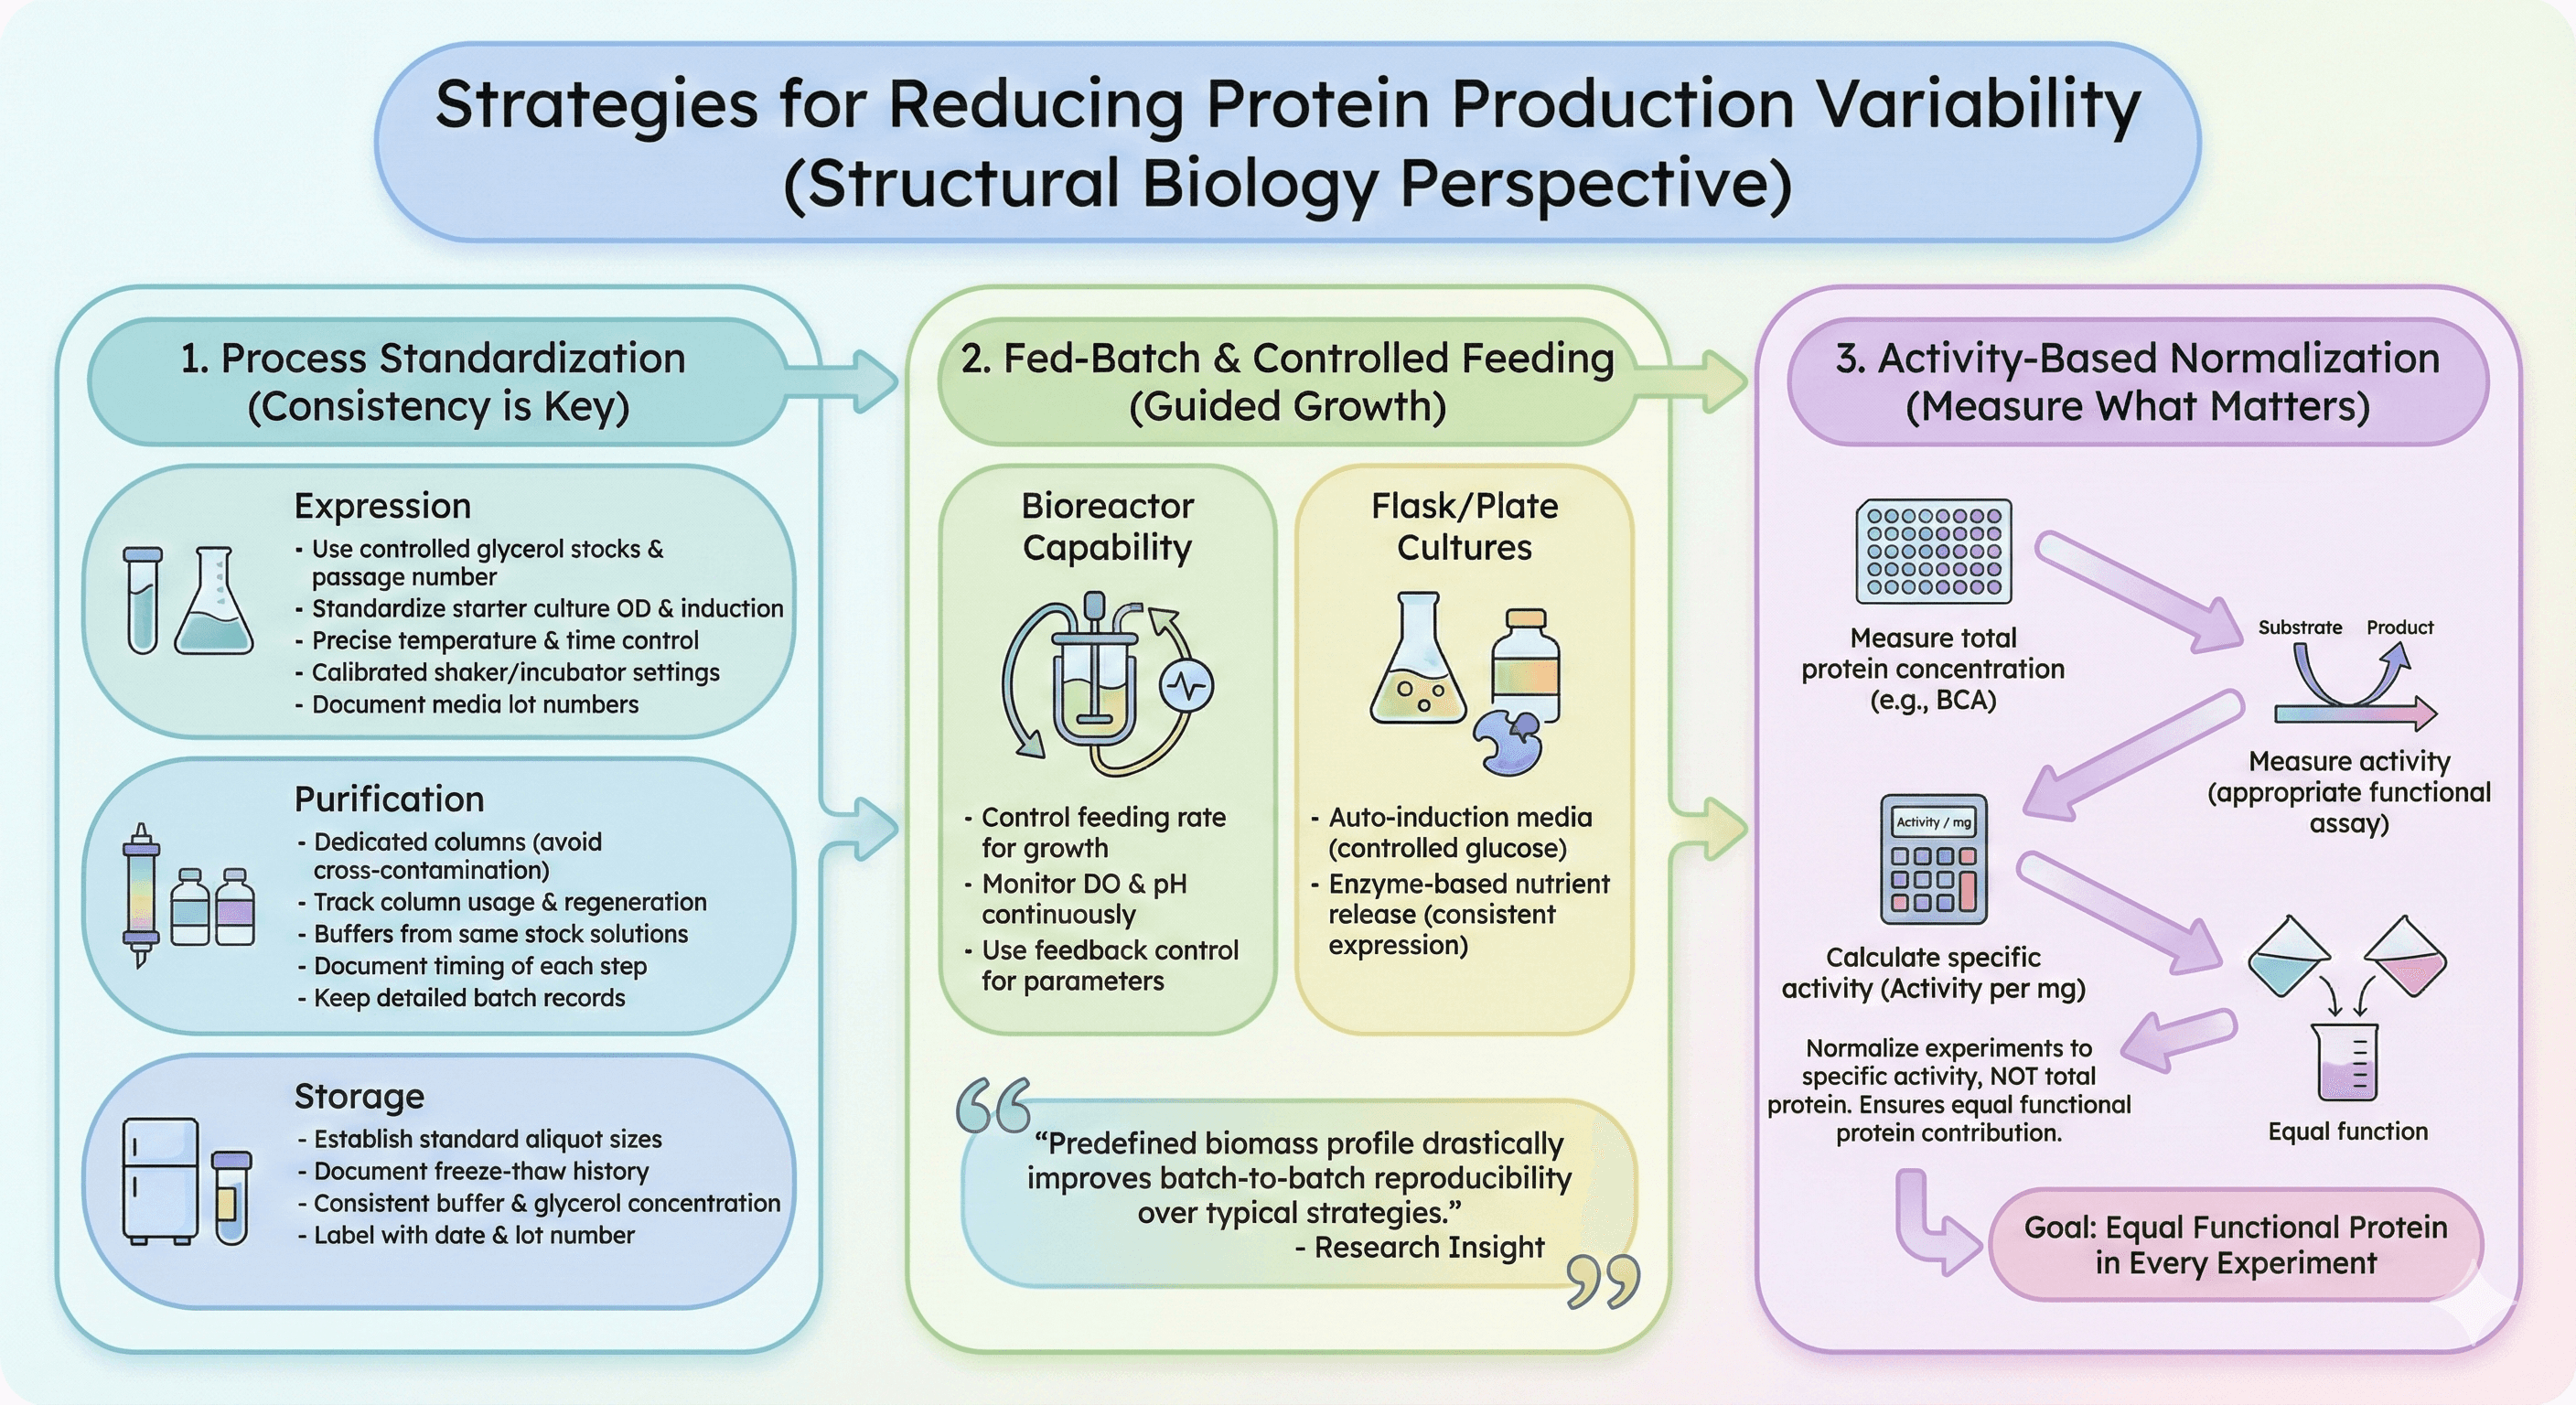
Strategies for Reducing Variability
Process Standardization
Expression:
Use glycerol stocks with controlled passage number
Standardize starter culture protocol (OD at inoculation)
Control induction time and temperature precisely
Use calibrated shaker/incubator settings
Document and control media lot numbers
Purification:
Use dedicated columns (avoid cross-contamination)
Track column usage and regenerate on schedule
Make buffers from same stock solutions within a campaign
Document timing of each step
Keep detailed batch records
Storage:
Establish standard aliquot sizes
Document freeze-thaw history
Use consistent buffer and glycerol concentration
Label with production date and lot number
Fed-Batch and Controlled Feeding
Research has shown that "guiding the process along a predefined profile of the total biomass derived from a given specific growth rate profile" can "drastically improve batch-to-batch reproducibility compared to the process control strategies typically applied in industry."
For labs with bioreactor capability:
Control feeding rate to manage growth rate
Monitor dissolved oxygen and pH continuously
Use feedback control for key parameters
For shaking flask/plate cultures:
Auto-induction media with controlled glucose release reduces variability
Enzyme-based nutrient release provides more consistent expression
Activity-Based Normalization
Don't normalize by total protein—normalize by activity.
For each batch:
Measure total protein concentration
Measure activity (appropriate assay for your protein)
Calculate specific activity (activity per mg)
Normalize experiments to specific activity, not total protein
This ensures that different batches contribute equal functional protein to each experiment.
When Batch Variation Causes Problems
Case 1: The Screening Campaign Disaster
Situation:
HTS campaign over 6 months
4 protein batches used
Batch 3 had 40% lower specific activity (undetected)
All plates from Batch 3 had shifted Z' factor
Consequence:
False negatives from Batch 3 plates
True actives missed
Discovered months later during hit validation
Prevention:
QC every batch before use
Include reference compound on every plate
Monitor assay performance metrics continuously
Case 2: The Irreproducible Structure
Situation:
Batch A crystallized beautifully
Batch B (same protocol) never crystallized
Difference: Batch B had 15% aggregate
Consequence:
Months of failed crystallization trials
Eventually traced to protein batch quality
Prevention:
DLS or analytical SEC on every batch
Set maximum aggregate threshold (<5%)
Re-purify if aggregation too high
Case 3: The Kinetic Constants That Changed
Situation:
Published Km = 50 µM
New batch gives Km = 120 µM
Different postdoc, same protocol
Consequence:
Reproducibility crisis
Revision required (embarrassing)
Discovered: Old batch had contaminating activator
Prevention:
Include positive control in every assay
Side-by-side comparison of old and new batches
Mass spec to verify composition
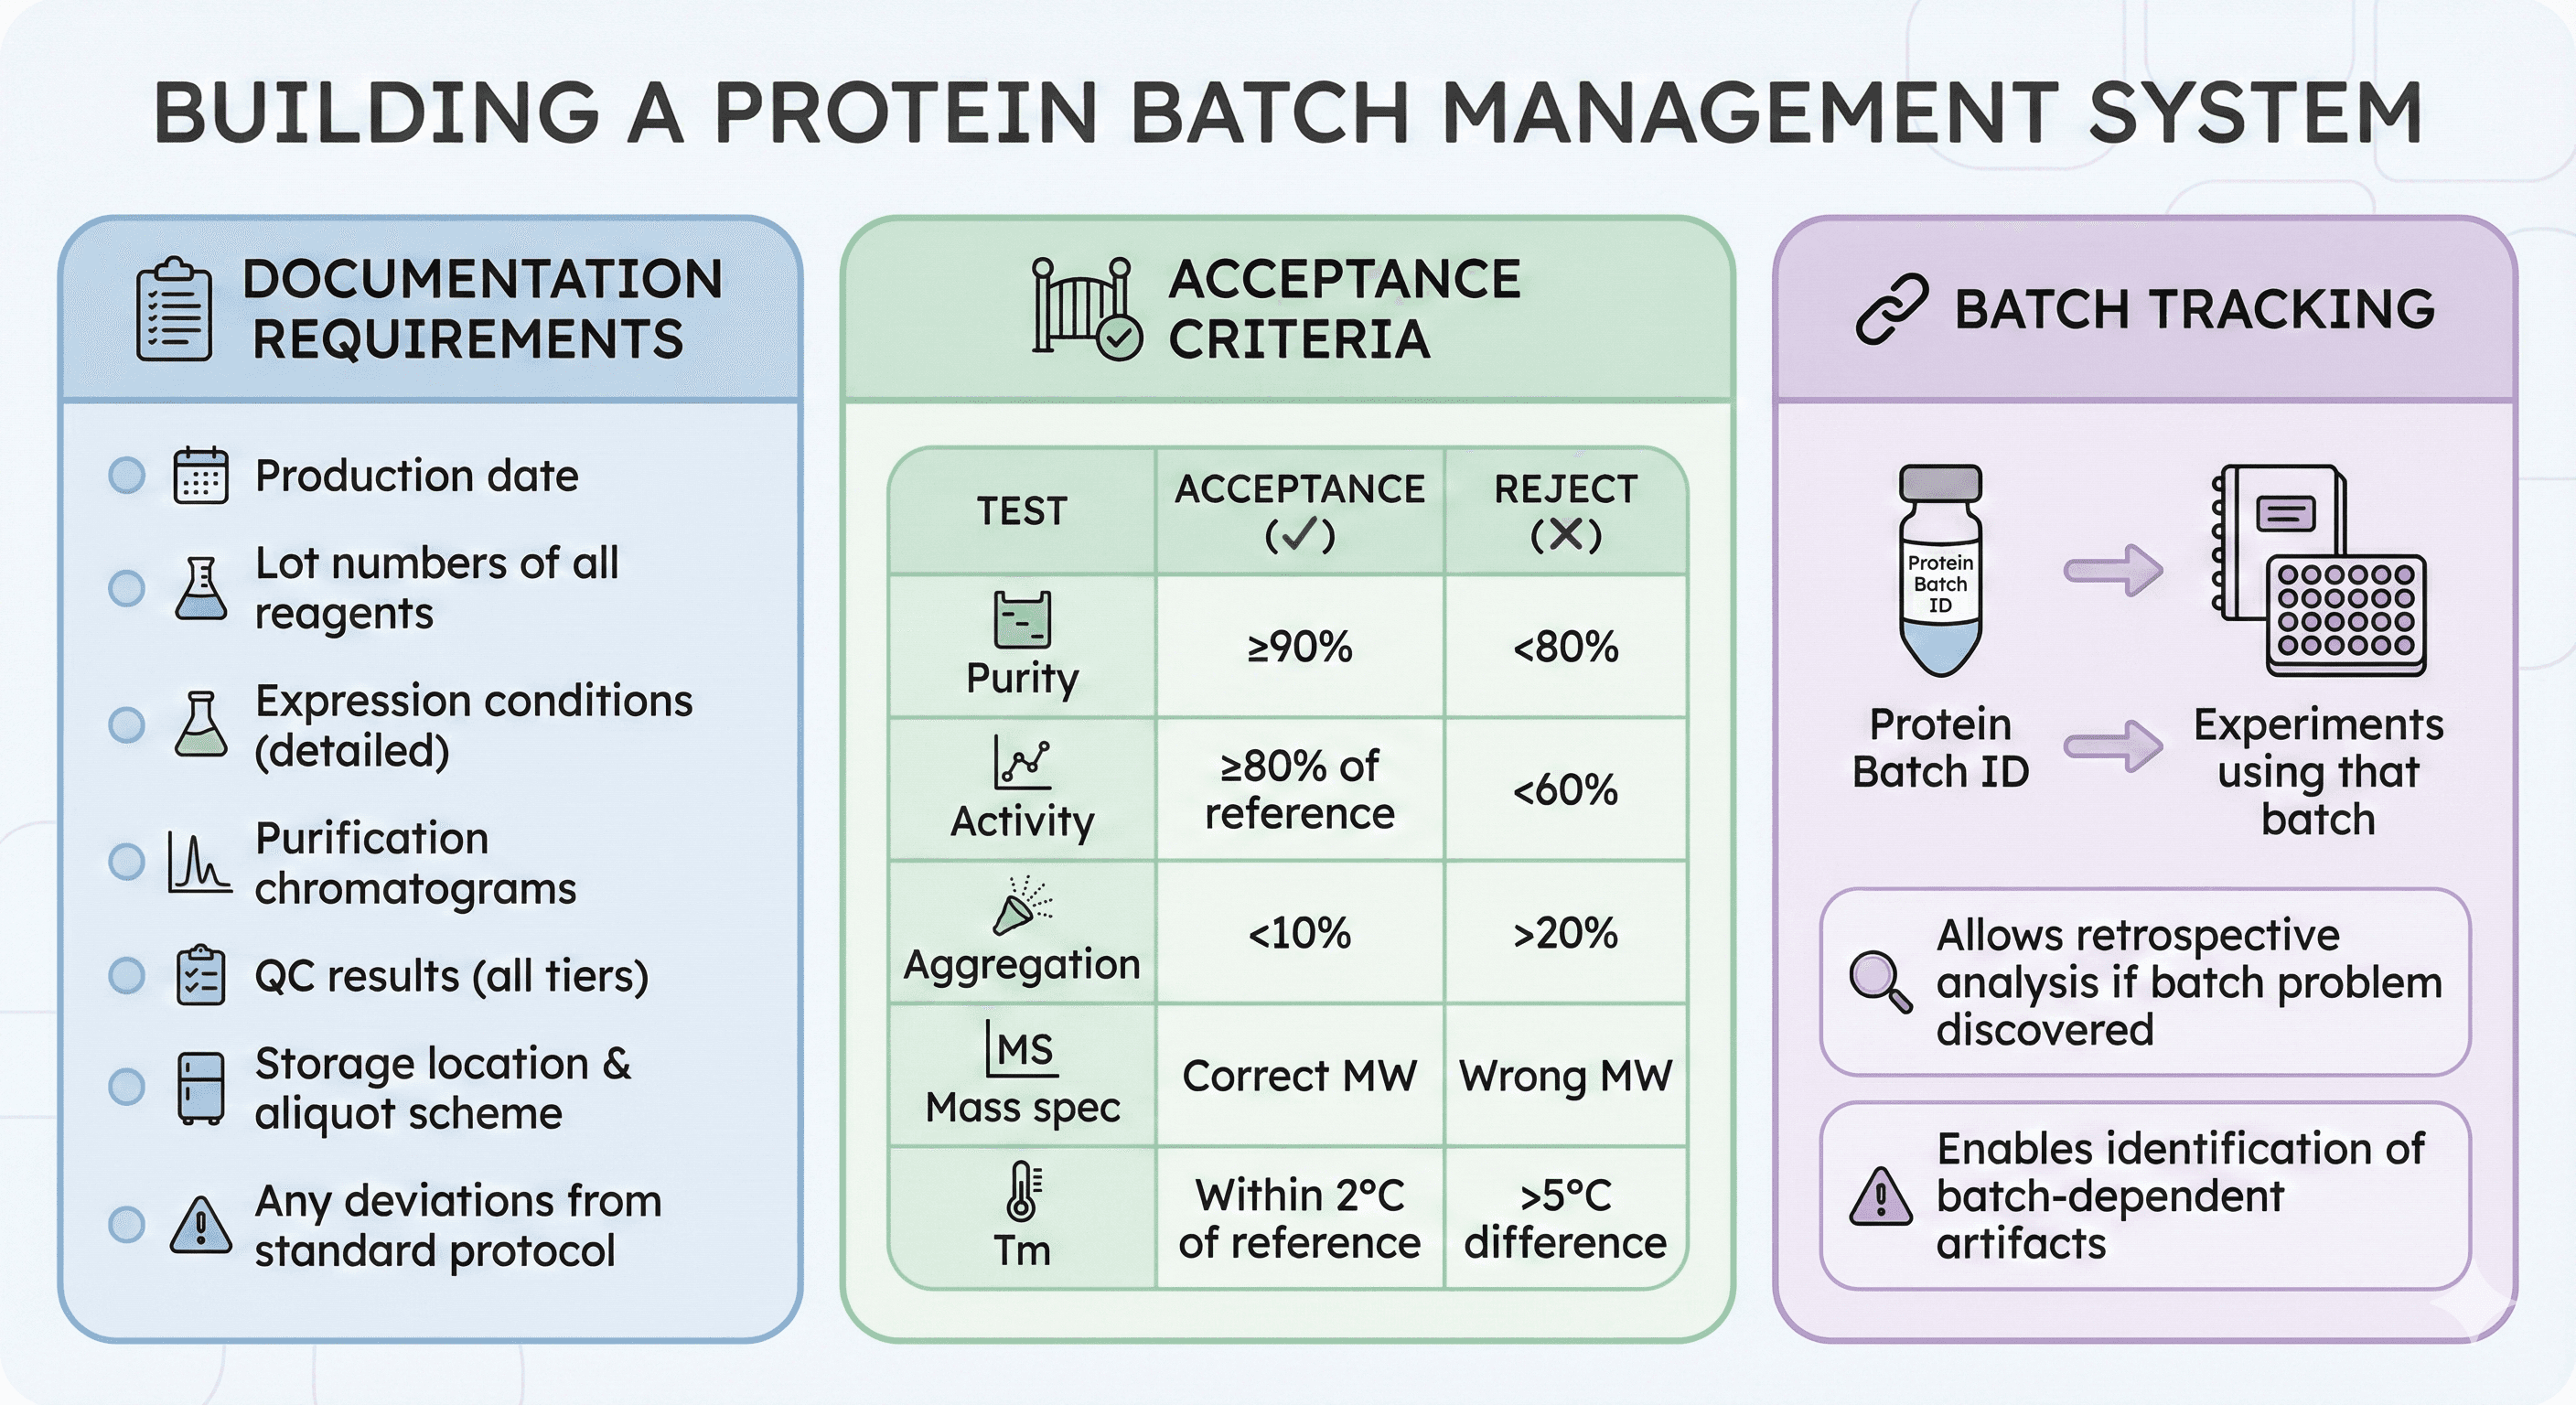
Building a Batch Management System
Documentation Requirements
For each batch, record:
Production date
Lot numbers of all reagents
Expression conditions (detailed)
Purification chromatograms
QC results (all tiers)
Storage location and aliquot scheme
Any deviations from standard protocol
Acceptance Criteria
Before using any batch, verify:
Test | Acceptance | Reject |
|---|---|---|
Purity | ≥90% | <80% |
Activity | ≥80% of reference | <60% |
Aggregation | <10% | >20% |
Mass spec | Correct MW | Wrong MW |
Tm | Within 2°C of reference | >5°C difference |
Batch Tracking
Maintain a log that links:
Protein batch ID → Experiments using that batch
Allows retrospective analysis if batch problem discovered
Enables identification of batch-dependent artifacts
Special Considerations
Multi-Site Collaborations
When sharing protein between labs:
Establish common QC standards
Ship reference standards for side-by-side validation
Compare results from same batch before comparing across batches
Communicate batch changes explicitly
Long-Term Studies
For studies spanning months or years:
Produce large batch at start (if possible)
Characterize extensively
Store carefully to minimize degradation
Have backup plan for producing equivalent batch
Document any batch transitions in publications
Commercial Protein
Even commercial proteins vary lot-to-lot:
Request certificates of analysis
Consider keeping internal standard for comparison
Track lot numbers used in experiments
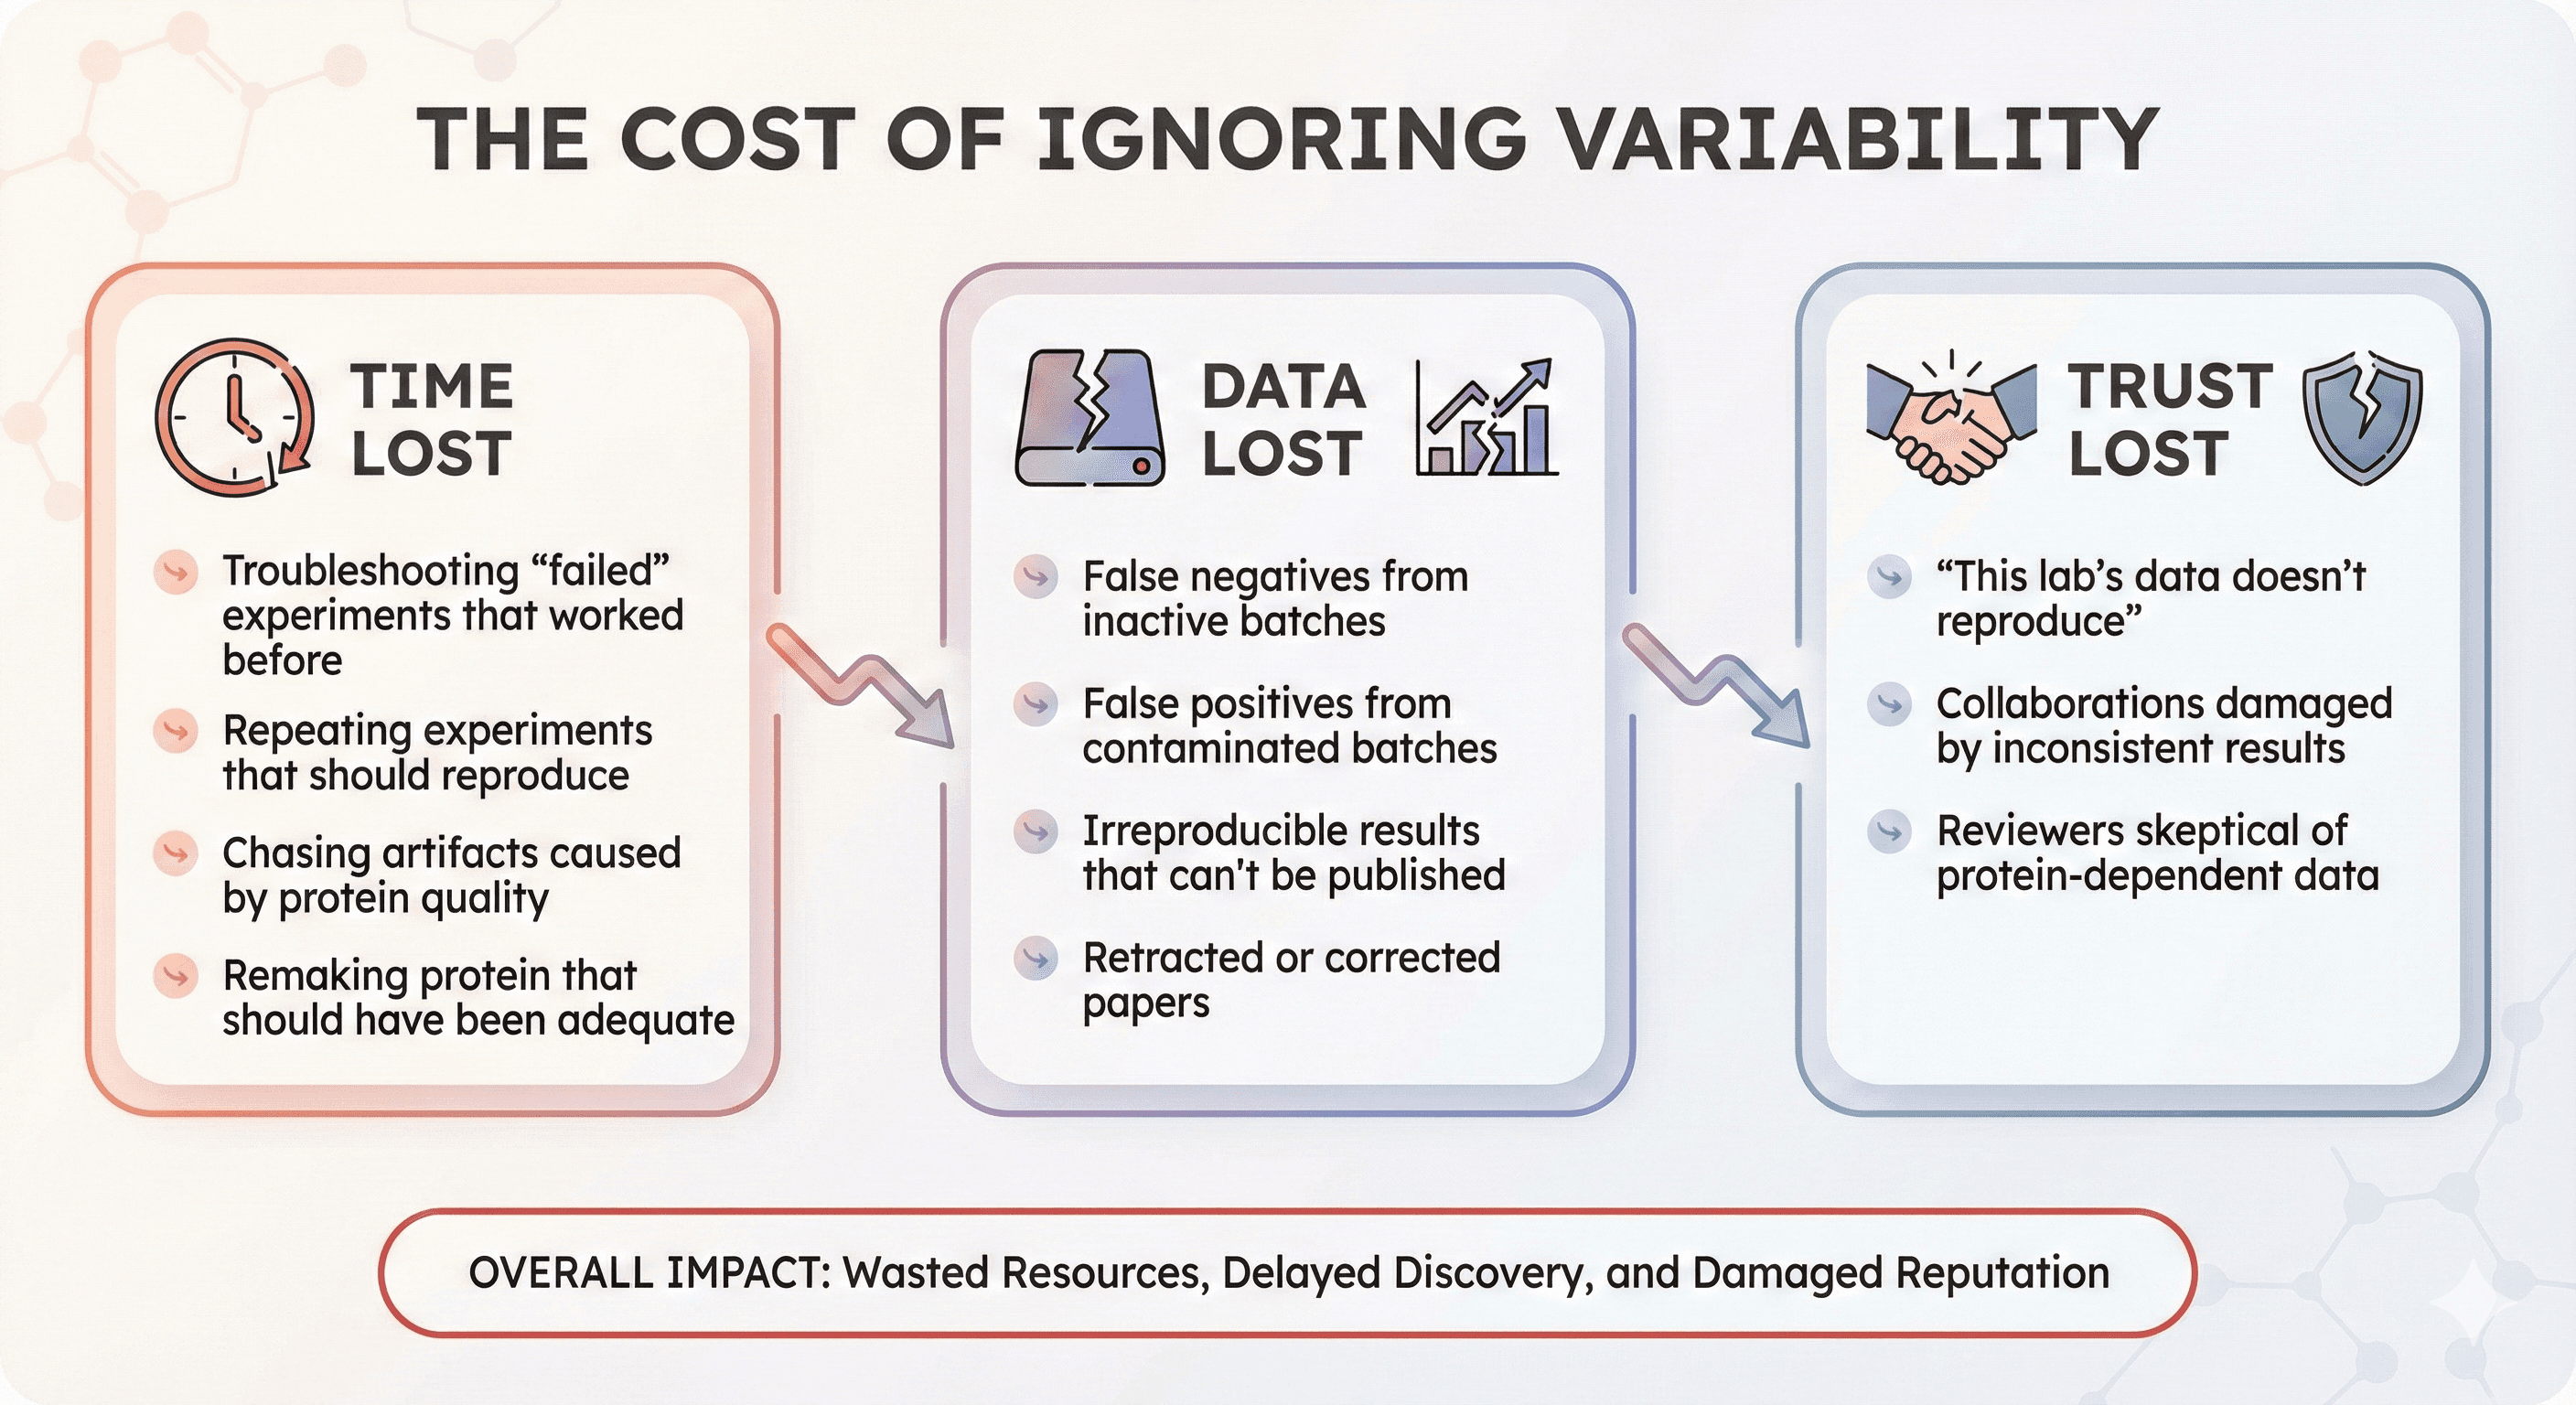
The Cost of Ignoring Variability
Time Lost
Troubleshooting "failed" experiments that worked before
Repeating experiments that should reproduce
Chasing artifacts caused by protein quality
Remaking protein that should have been adequate
Data Lost
False negatives from inactive batches
False positives from contaminated batches
Irreproducible results that can't be published
Retracted or corrected papers
Trust Lost
"This lab's data doesn't reproduce"
Collaborations damaged by inconsistent results
Reviewers skeptical of protein-dependent data
The Bottom Line
Batch-to-batch variability is not randomness you have to accept—it's a technical problem you can manage. The solution requires:
Element | Implementation |
|---|---|
Awareness | Acknowledge that batches vary |
Measurement | QC every batch systematically |
Standardization | Control what you can control |
Documentation | Track batches through all experiments |
Response | Act on QC failures before they contaminate data |
Studies have shown that implementing rigorous quality control of protein reagents dramatically improves research data reproducibility. The investment in QC pays dividends in reproducible, trustworthy data.
The bottom line: If you can't characterize the difference between your batches, you can't interpret the difference between your experiments.
Quality-Focused Protein Analysis
For researchers working to improve batch consistency, platforms like Orbion can help identify characteristics that might contribute to variability:
Aggregation propensity prediction: Flag proteins likely to have variable aggregation behavior
PTM site prediction: Identify modifications that might vary between expression conditions
Stability assessment: Predict regions prone to degradation or instability
Disorder mapping: Understand which regions might contribute to heterogeneity
Understanding your protein's intrinsic properties helps you anticipate and control the sources of batch-to-batch variation—leading to more reproducible protein and more reliable data.
References
Zobel-Roos S, et al. (2019). Economic analysis of batch and continuous biopharmaceutical antibody production: A review. Biotechnology Journal, 14(1):e1700739. PMC6432653
Jungbauer A, et al. (2006). Improving the batch-to-batch reproducibility in microbial cultures during recombinant protein production by guiding the process along a predefined total biomass profile. BMC Biotechnology, 6:35. PMC1705514
Marhöfer RJ, et al. (2024). Overcoming lot-to-lot variability in protein activity using epitope-specific calibration-free concentration analysis. Analytical Chemistry, 96(15):5982-5990. PMC11044105
Raynal B, et al. (2014). Quality assessment and optimization of purified protein samples: why and how? Microbial Cell Factories, 13:180. PMC4299812
Bhambure R, et al. (2021). Quality control of protein reagents for the improvement of research data reproducibility. Nature Communications, 12:2795. Nature
Panula-Perälä J, et al. (2016). The fed-batch principle for the molecular biology lab: controlled nutrient diets in ready-made media improve production of recombinant proteins in Escherichia coli. Microbial Cell Factories, 7:31. Link
Hage C, et al. (2019). Recent developments in bioprocessing of recombinant proteins: expression hosts and process development. Bioengineering, 6(4):119. PMC6932962
R&D Systems. (2024). Recombinant protein quality—Protein production. Technical Documentation. Link
Book a 20-Minute Demo
Sign up free for unlimited Overview runs — summary, sequence-based analysis, homology search. For the full Characterization — PTMs, binding sites, stability variants, construct design — book a demo and we'll run your target live.
