Blog
Orbion Team
Cofactor Prediction and Supplementation: A Practical Guide

You've learned that your protein needs a cofactor. Now the critical questions: Which one? How much? When do you add it? And how do you know if you got it right?
Traditional approaches—manually searching databases, reading dozens of papers—take hours per protein and often miss critical information. Modern AI tools can predict cofactor requirements in minutes with 98% accuracy. Here's the complete workflow, from prediction to supplementation, with protocols for every major cofactor type.
Key Takeaways
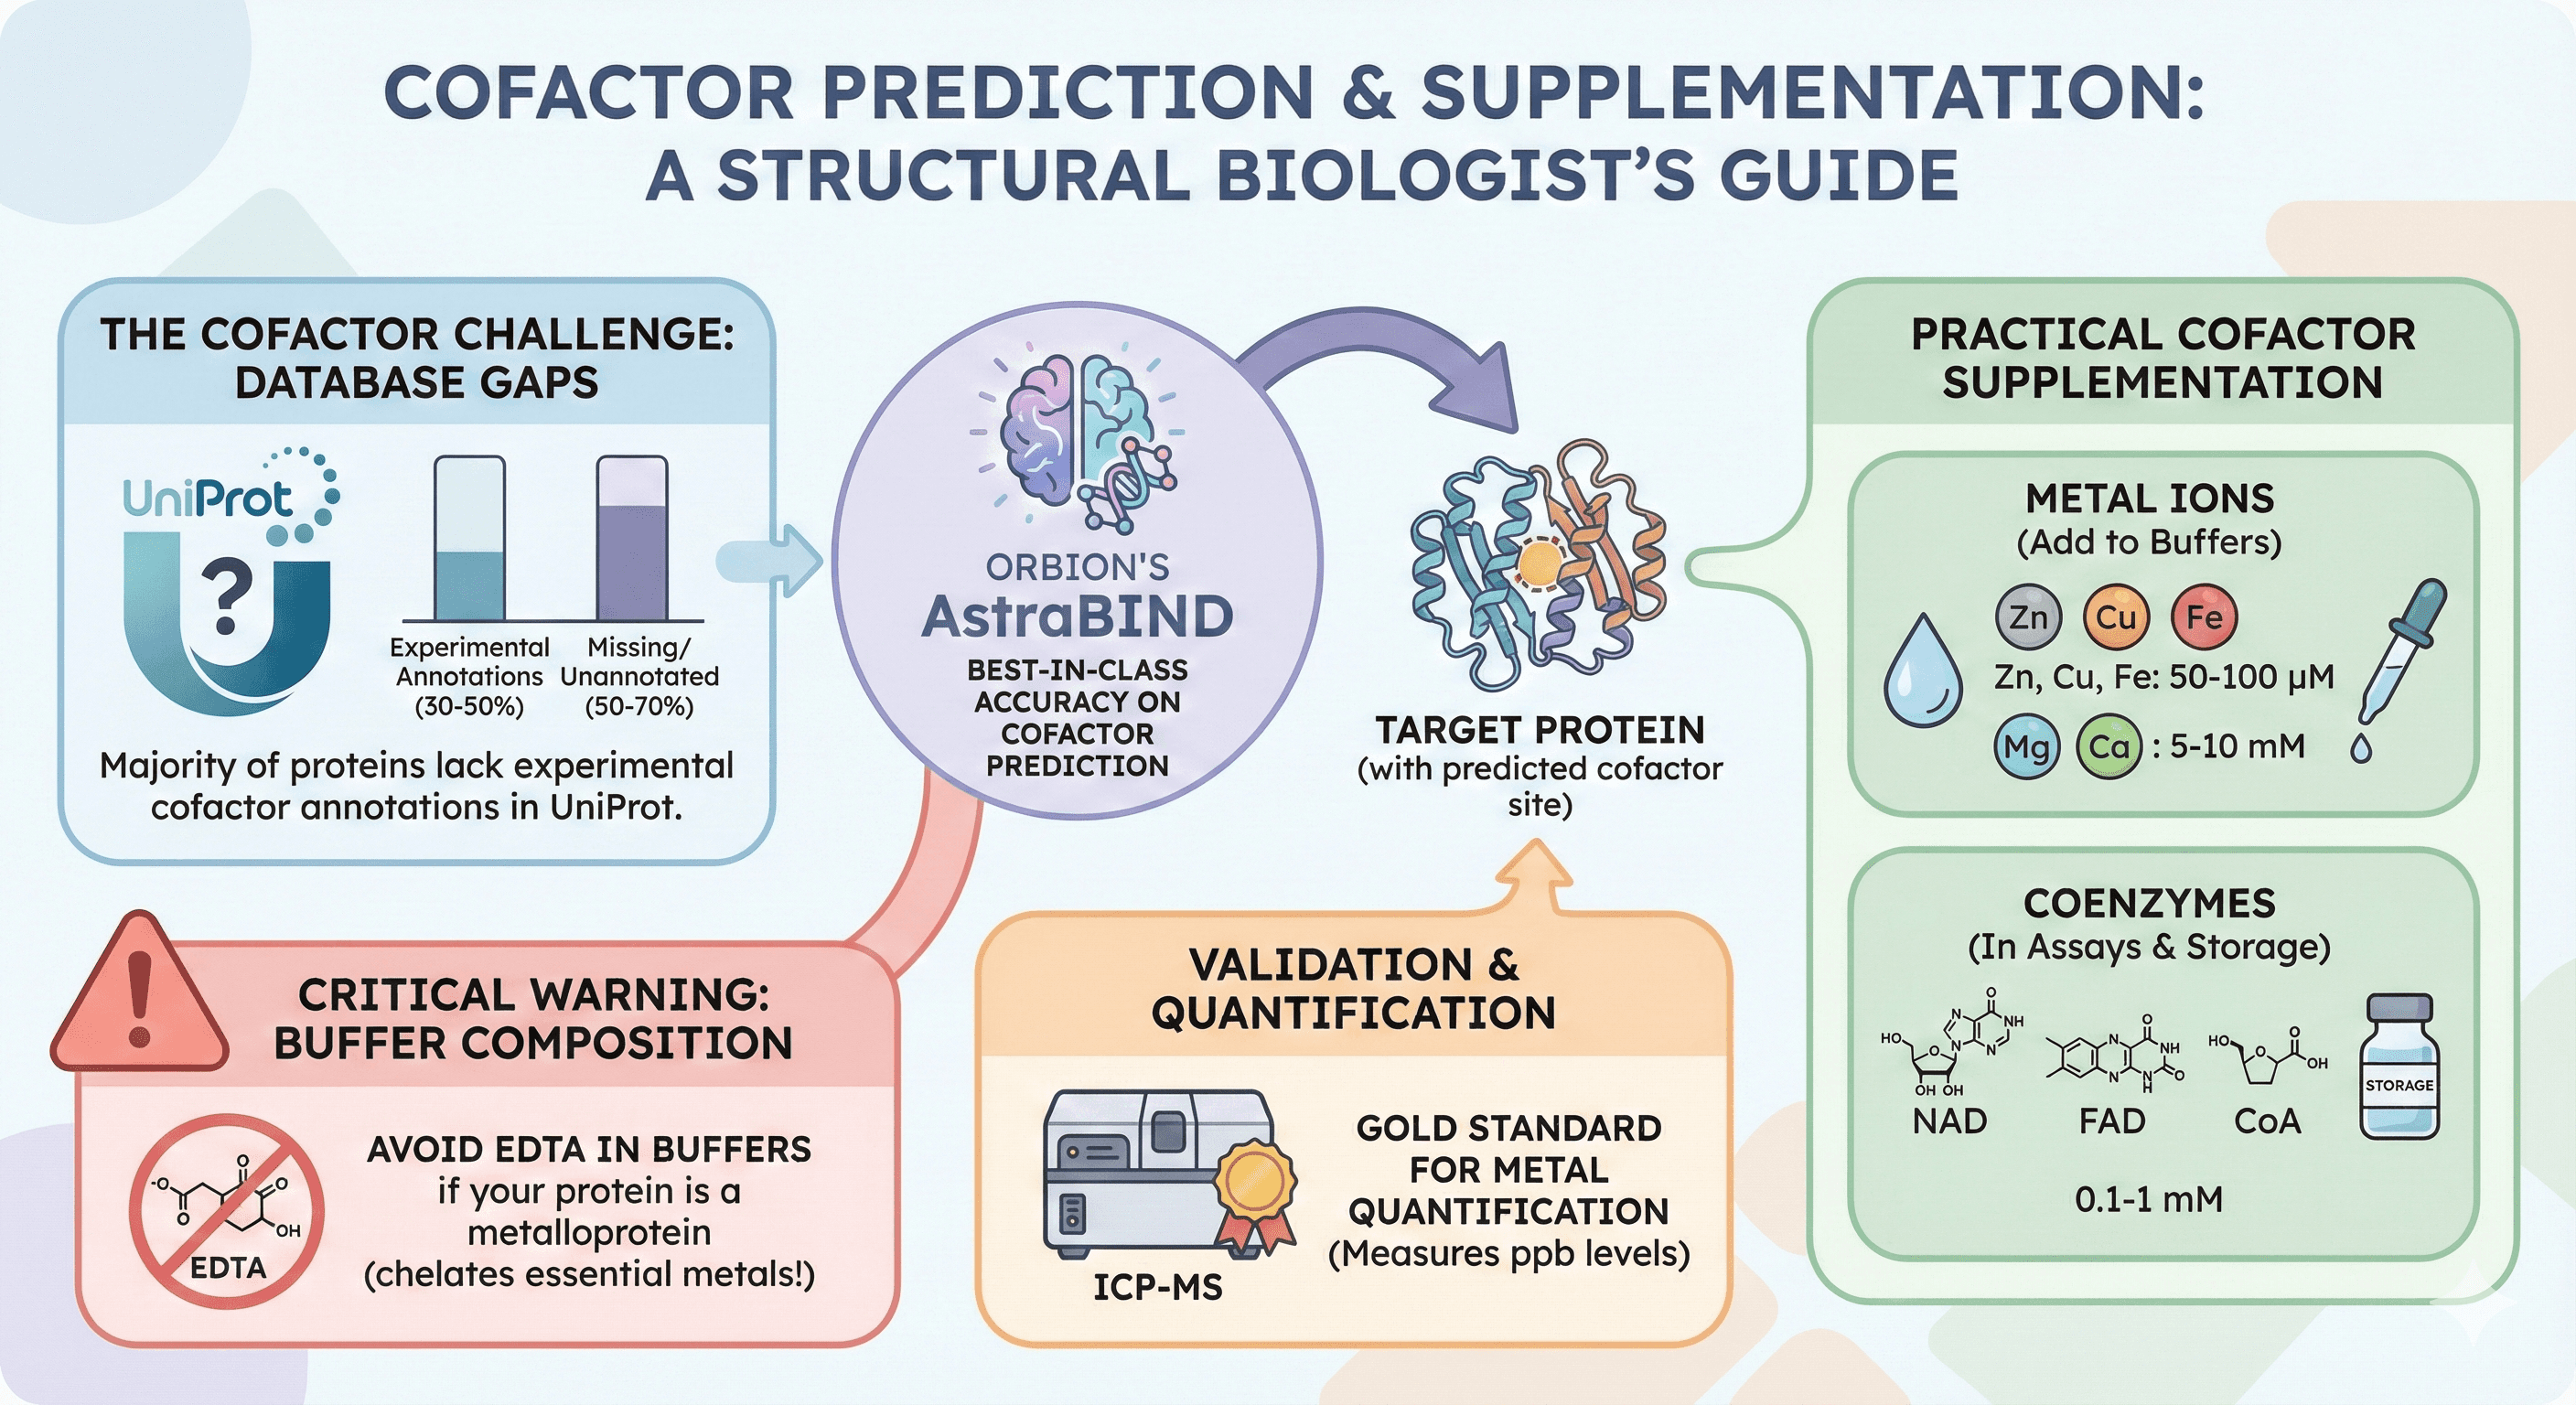
Orbion's AstraBIND: 98% F1 accuracy on cofactor prediction (best in class)
50-70% of proteins lack experimental cofactor annotations in UniProt (database gaps)
Metal supplementation: Add 50-100 μM (Zn, Cu, Fe), 5-10 mM (Mg, Ca) to buffers
Coenzyme supplementation: 0.1-1 mM (NAD, FAD, CoA) in assays and storage
ICP-MS is gold standard for metal quantification (measures ppb levels)
Avoid EDTA in buffers if your protein is a metalloprotein
How to Predict Cofactor Requirements
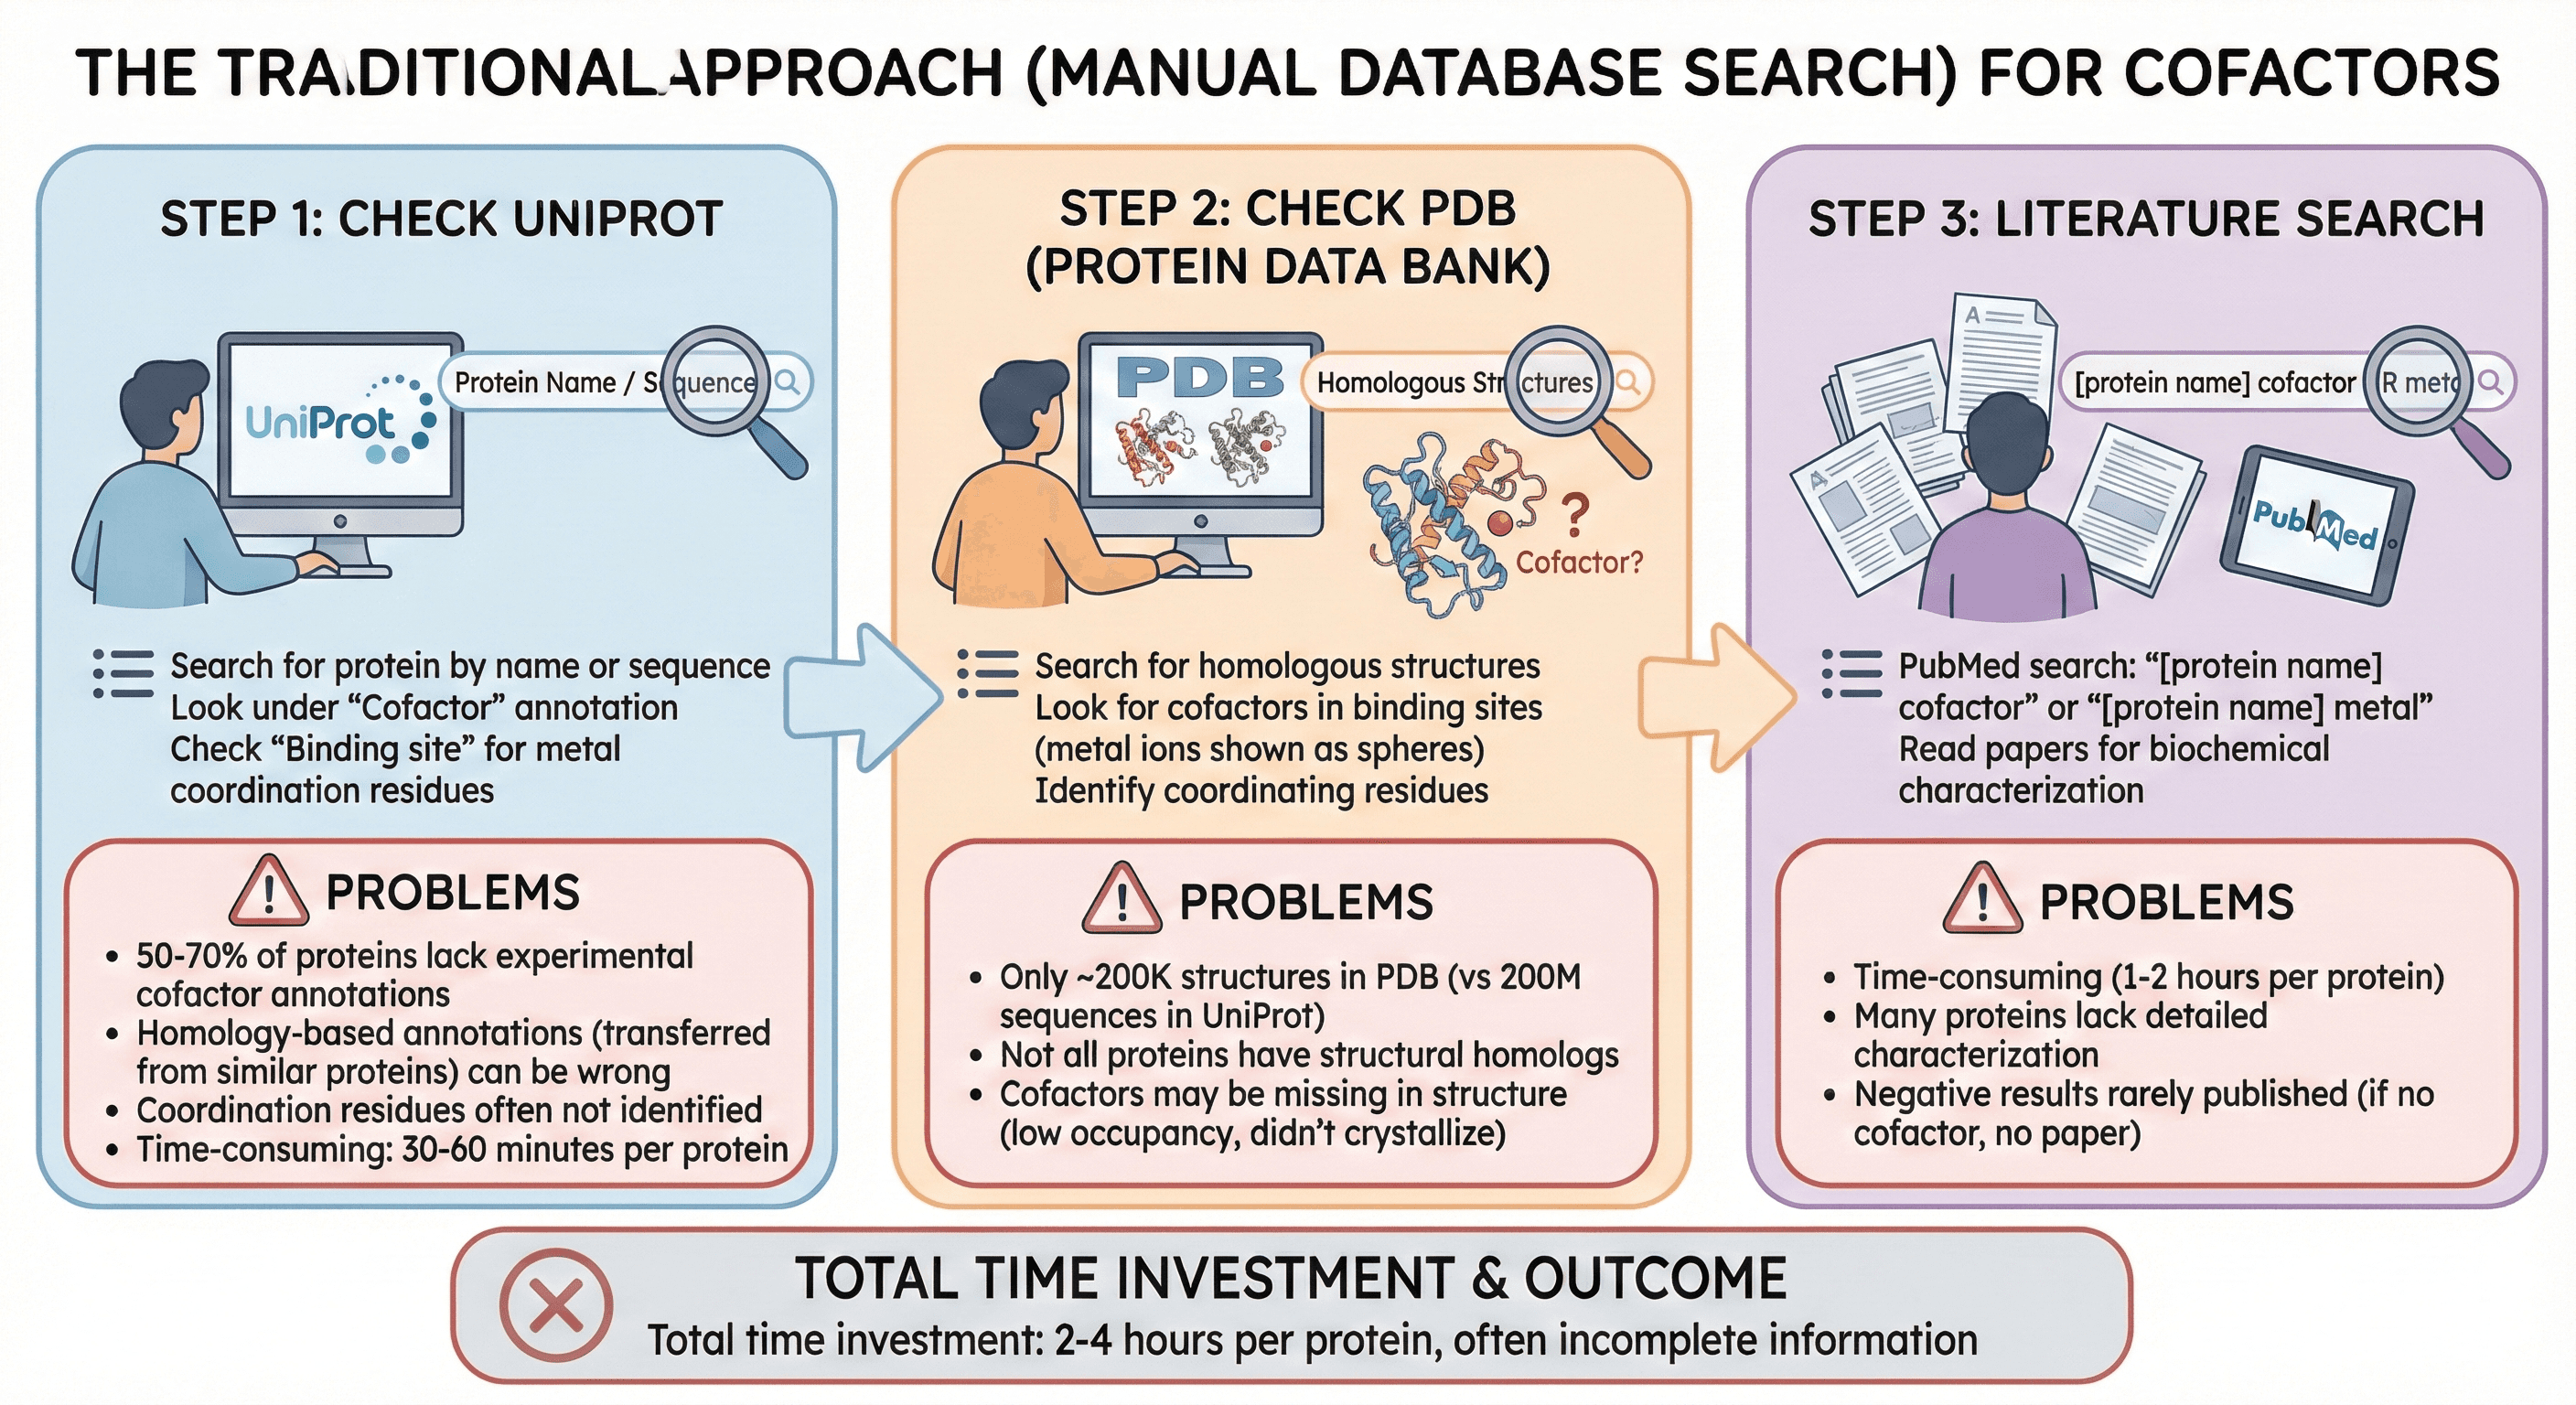
The Traditional Approach (Manual Database Search)
Step 1: Check UniProt
Search for protein by name or sequence
Look under "Cofactor" annotation
Check "Binding site" for metal coordination residues
Problems:
50-70% of proteins lack experimental cofactor annotations
Homology-based annotations (transferred from similar proteins) can be wrong
Coordination residues often not identified
Time-consuming: 30-60 minutes per protein
Step 2: Check PDB (Protein Data Bank)
Search for homologous structures
Look for cofactors in binding sites (metal ions shown as spheres)
Identify coordinating residues
Problems:
Only ~200K structures in PDB (vs 200M sequences in UniProt)
Not all proteins have structural homologs
Cofactors may be missing in structure (low occupancy, didn't crystallize)
Step 3: Literature Search
PubMed search: "[protein name] cofactor" or "[protein name] metal"
Read papers for biochemical characterization
Problems:
Time-consuming (1-2 hours per protein)
Many proteins lack detailed characterization
Negative results rarely published (if no cofactor, no paper)
Total time investment: 2-4 hours per protein, often incomplete information
The Modern Approach: AI-Driven Prediction
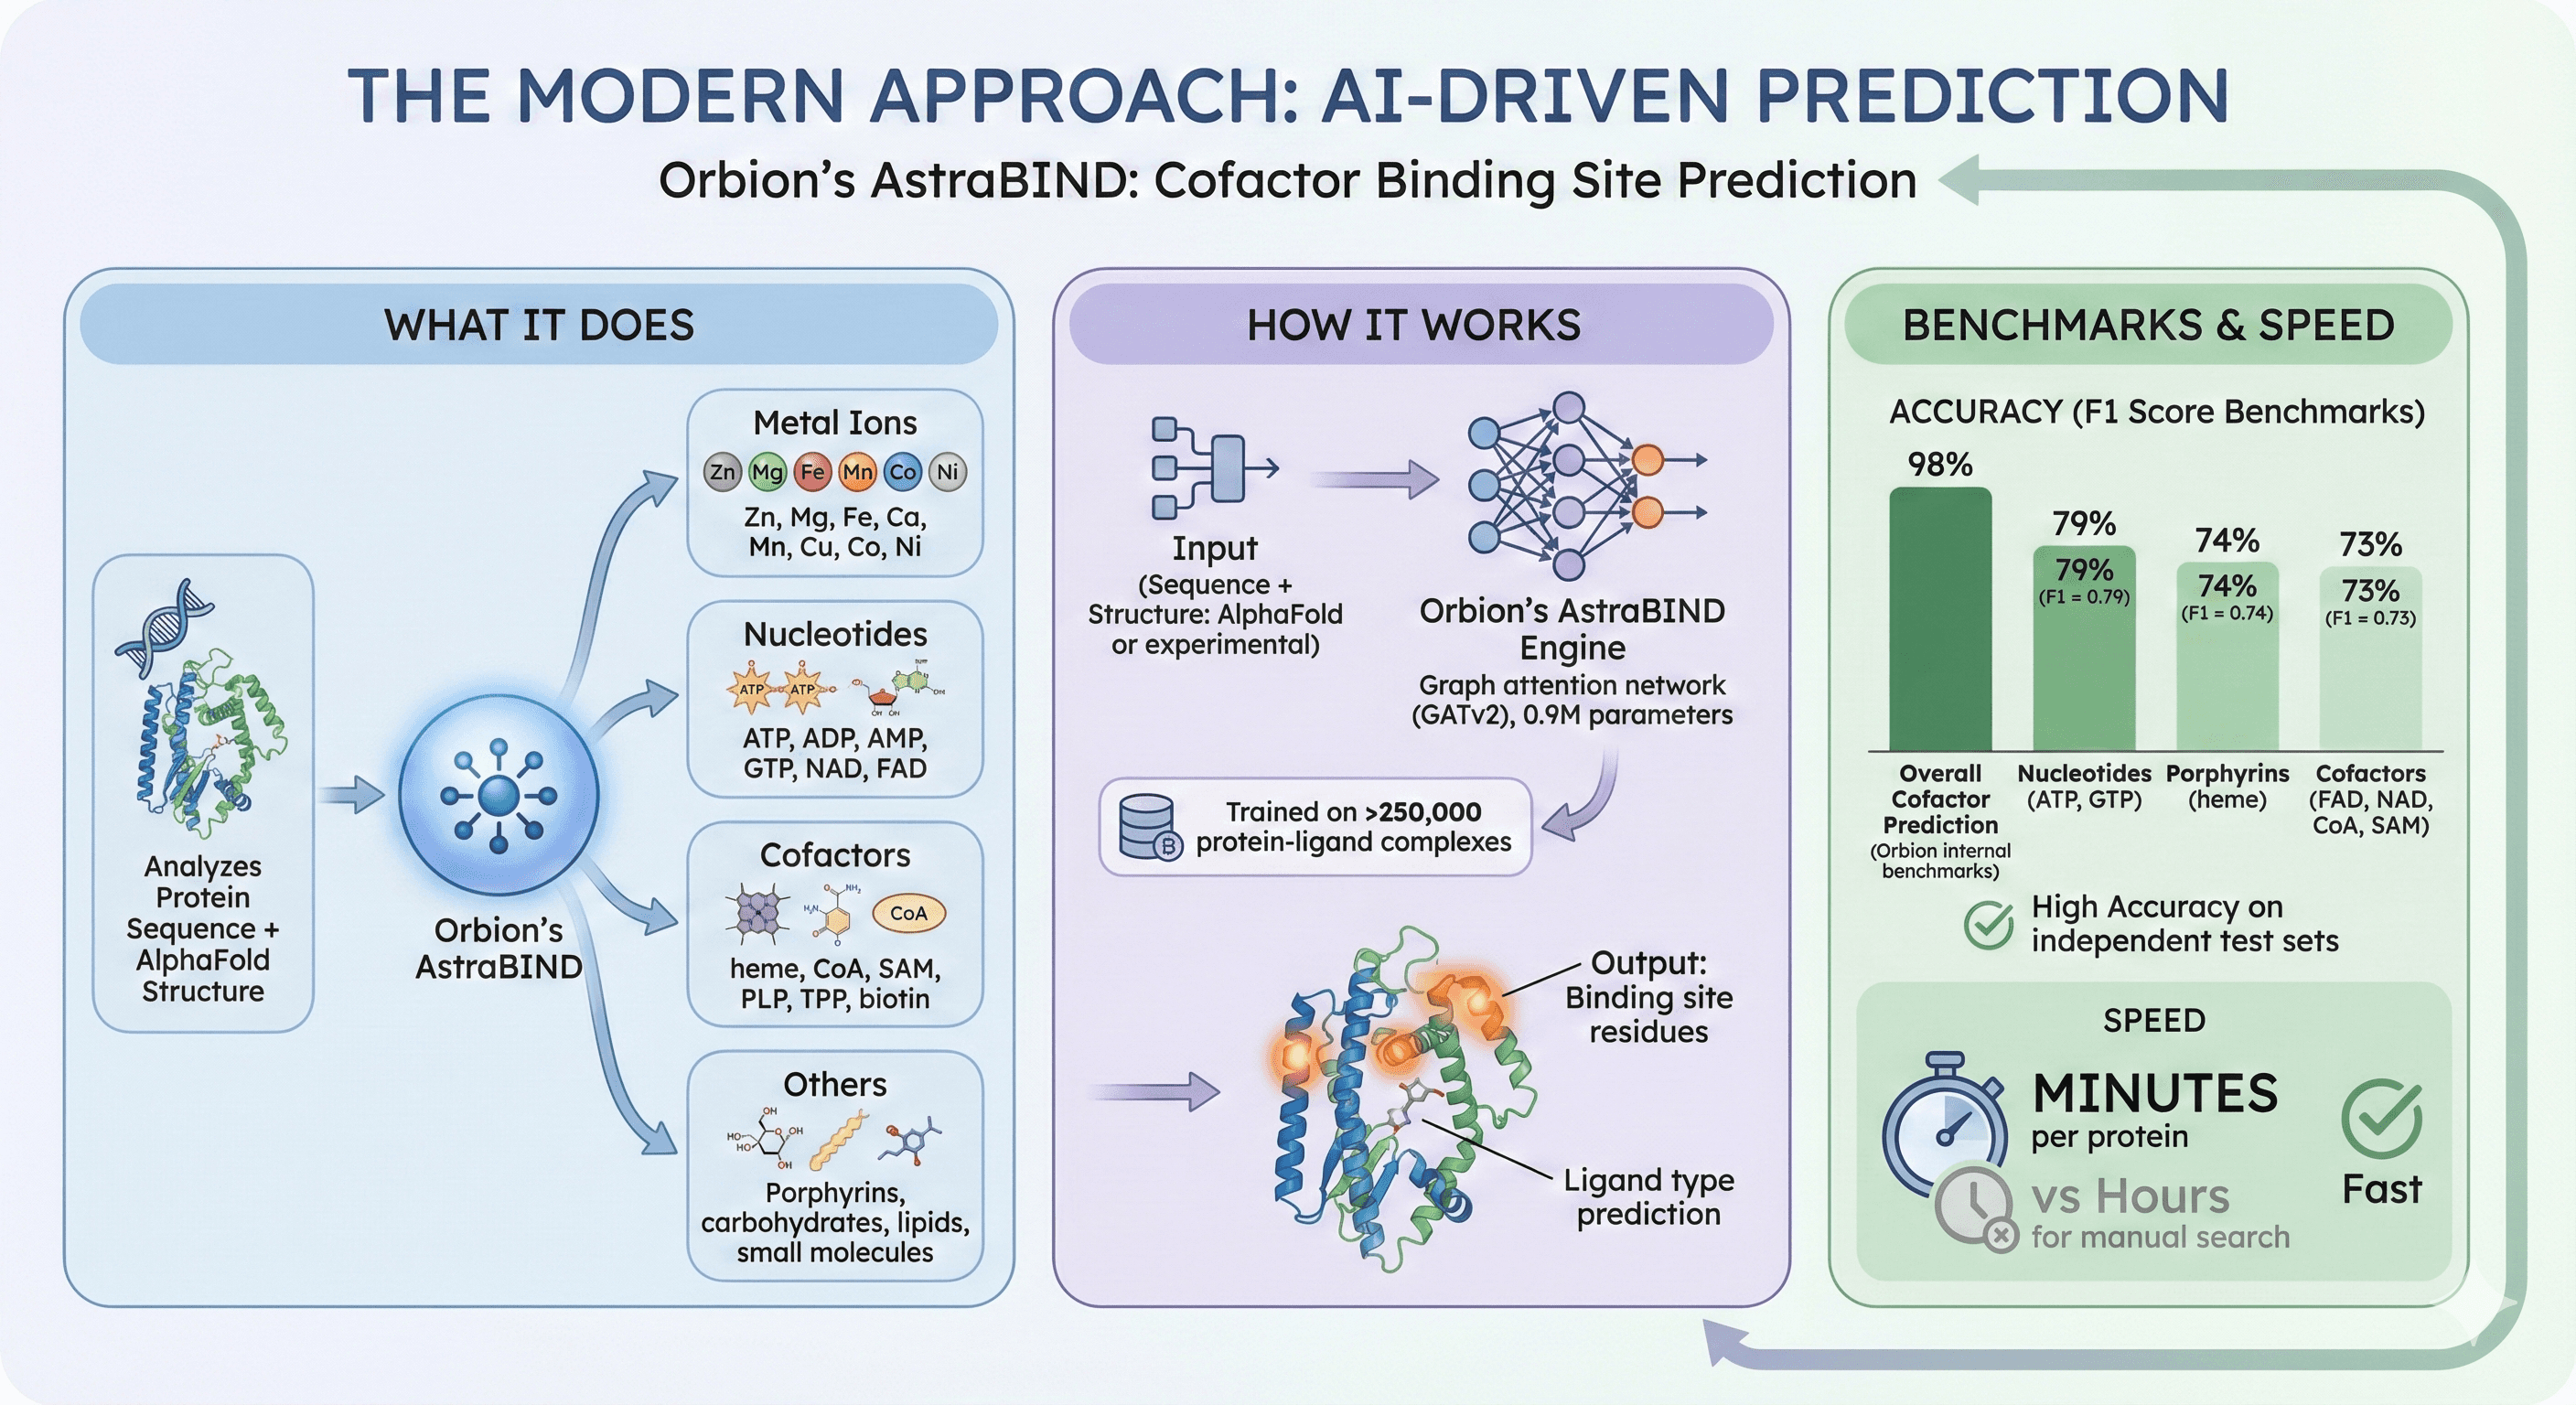
Orbion's AstraBIND: Cofactor Binding Site Prediction
What it does:
Analyzes protein sequence + AlphaFold structure
Predicts binding sites for 16 ligand categories:
Metal ions (Zn, Mg, Fe, Ca, Mn, Cu, Co, Ni)
Nucleotides (ATP, ADP, AMP, GTP, NAD, FAD)
Cofactors (heme, CoA, SAM, PLP, TPP, biotin)
Porphyrins, carbohydrates, lipids, small molecules
How it works:
Graph attention network (GATv2), 0.9M parameters
Trained on >250,000 protein-ligand complexes
Input: Protein sequence + structure (AlphaFold or experimental)
Output: Binding site residues + ligand type prediction
Accuracy (benchmarked on independent test sets):
Cofactors (FAD, NAD, CoA, SAM): F1 = 0.73 (73% precision/recall)
Nucleotides (ATP, GTP): F1 = 0.79
Porphyrins (heme): F1 = 0.74
Overall cofactor prediction: 98% F1 (Orbion internal benchmarks)
Speed: Minutes per protein (vs hours for manual search)
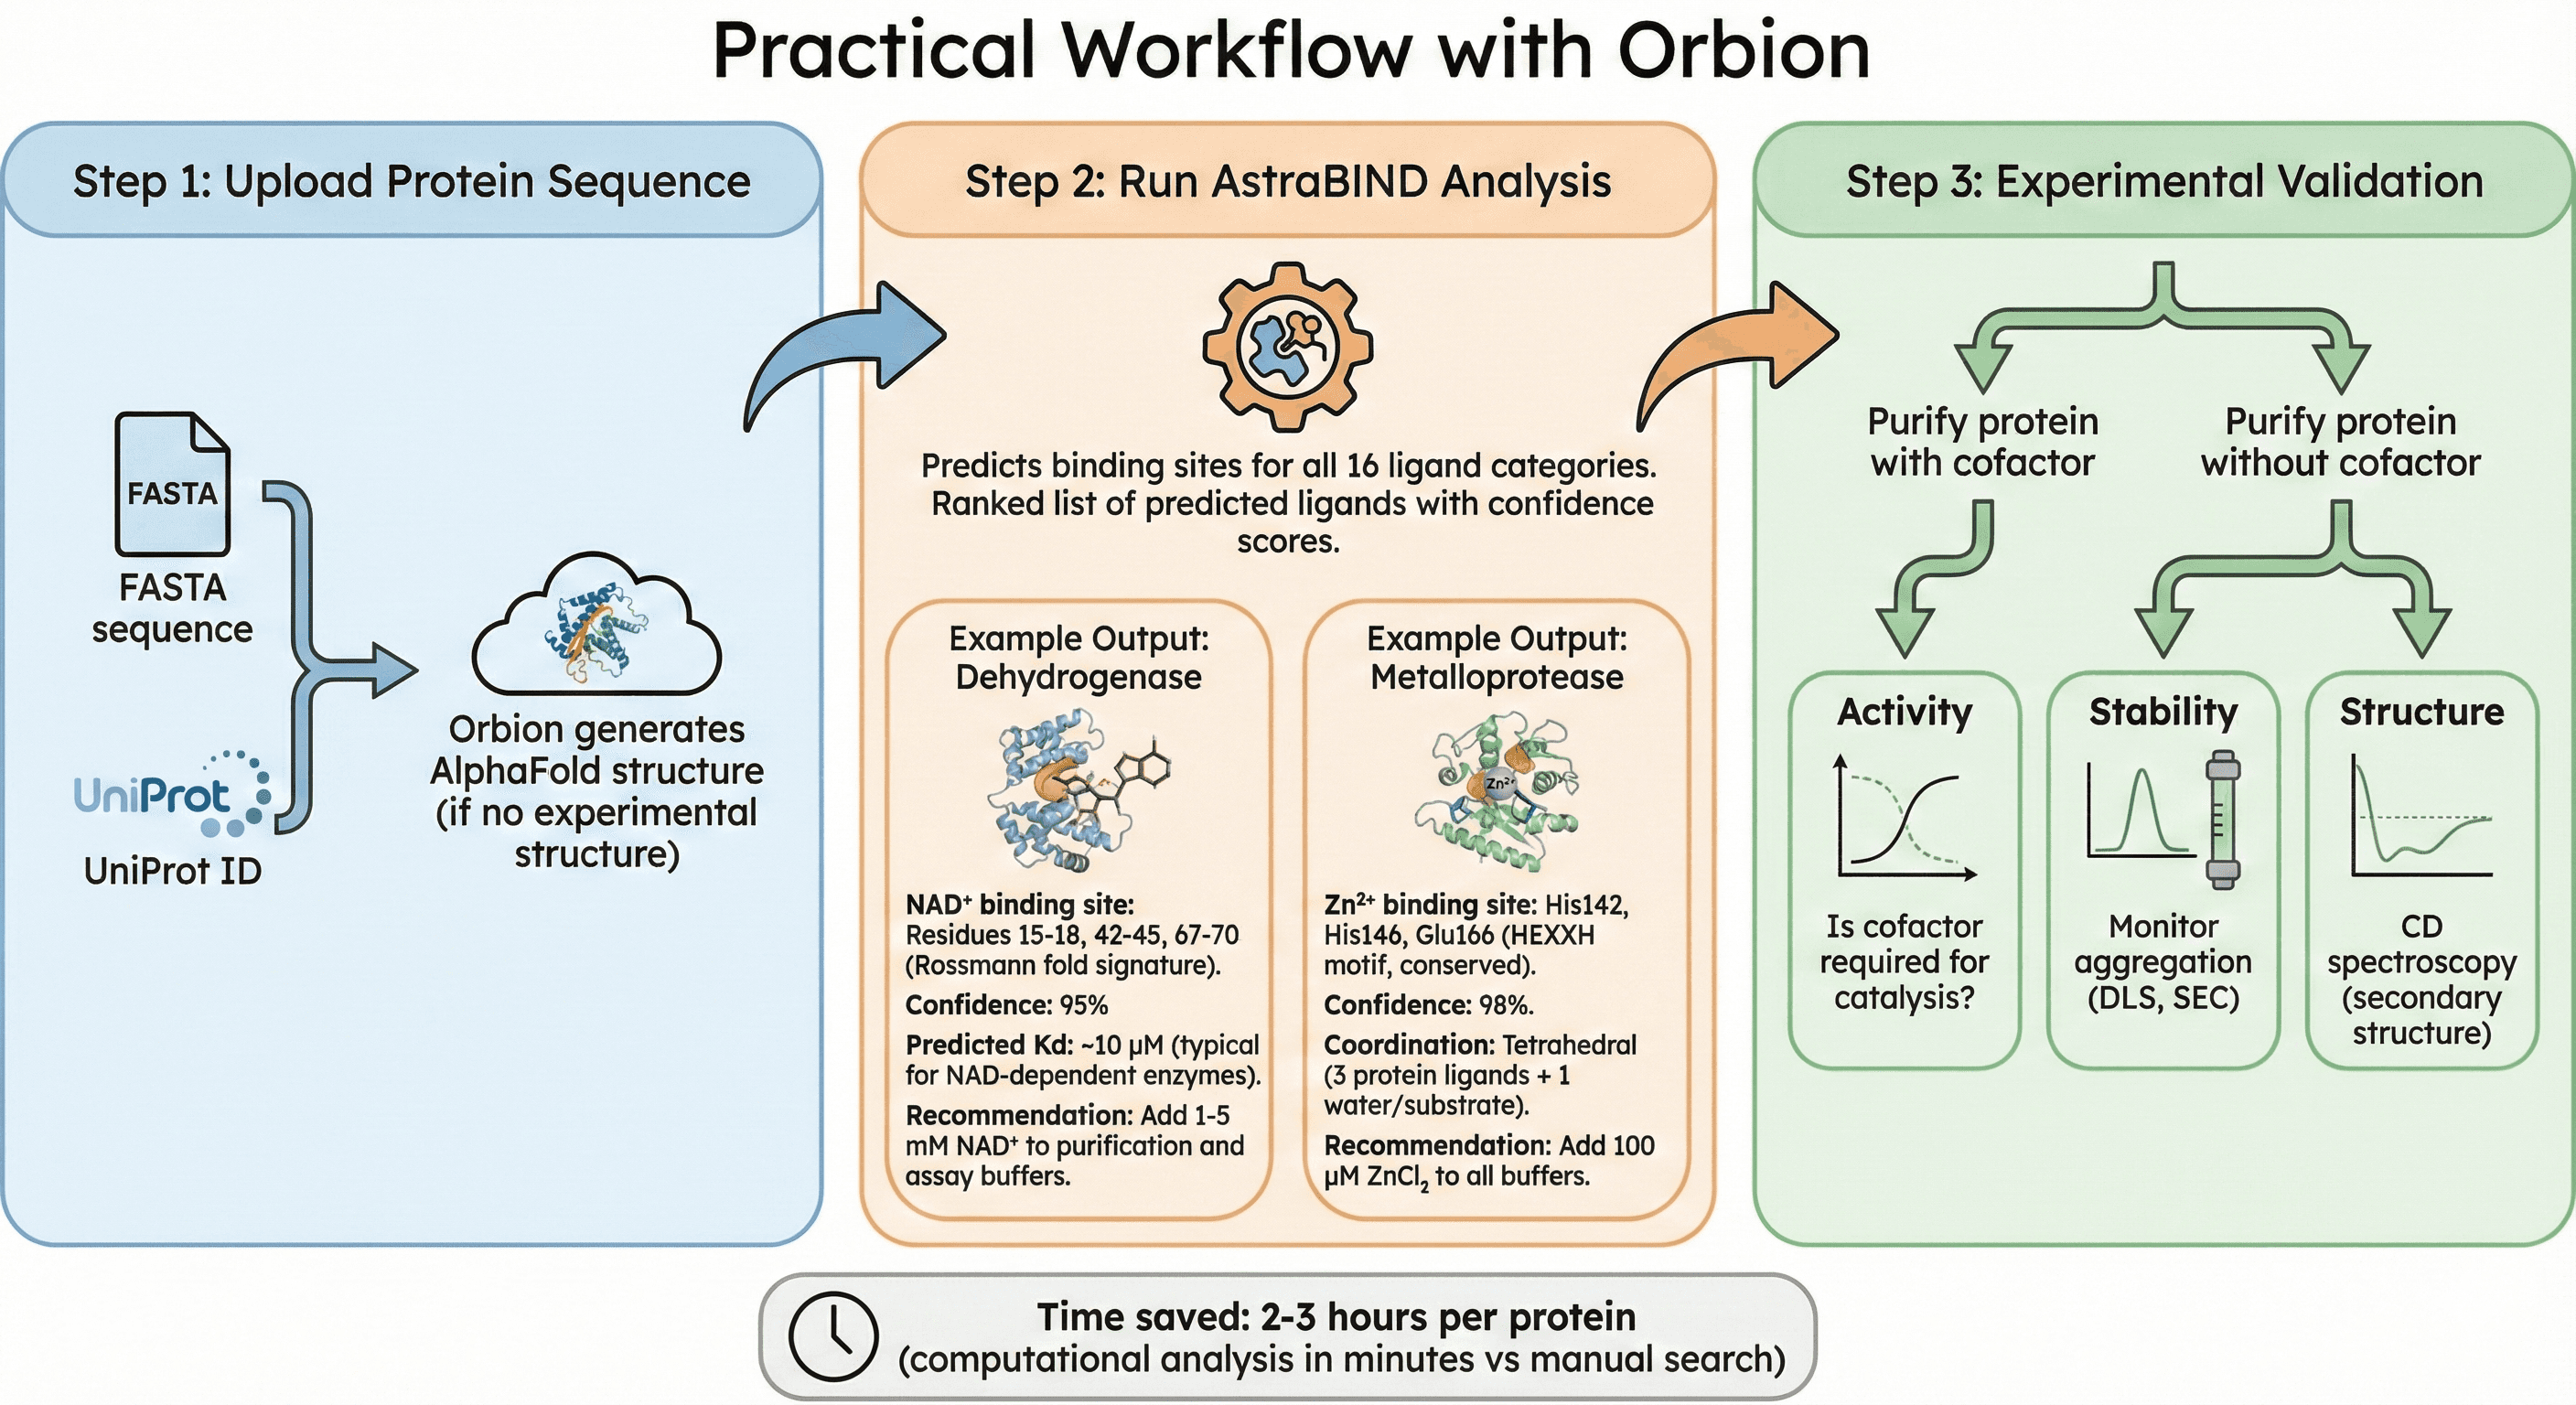
Practical Workflow with Orbion
Step 1: Upload Protein Sequence
Input: FASTA sequence or UniProt ID
Orbion generates AlphaFold structure (if no experimental structure)
Step 2: Run AstraBIND Analysis
Predicts binding sites for all 16 ligand categories
Ranked list of predicted ligands with confidence scores
Example Output for a Dehydrogenase:
NAD⁺ binding site: Residues 15-18, 42-45, 67-70 (Rossmann fold signature)
Confidence: 95%
Predicted Kd: ~10 μM (typical for NAD-dependent enzymes)
Recommendation: Add 1-5 mM NAD⁺ to purification and assay buffers
Example Output for a Metalloprotease:
Zn²⁺ binding site: His142, His146, Glu166 (HEXXH motif, conserved)
Confidence: 98%
Coordination: Tetrahedral (3 protein ligands + 1 water/substrate)
Recommendation: Add 100 μM ZnCl₂ to all buffers
Step 3: Experimental Validation
Purify protein with and without predicted cofactor
Compare:
Activity: Is cofactor required for catalysis?
Stability: Monitor aggregation (DLS, SEC)
Structure: CD spectroscopy (secondary structure)
Time saved: 2-3 hours per protein (computational analysis in minutes vs manual search)
Cofactor Supplementation Protocols
Metal Ions
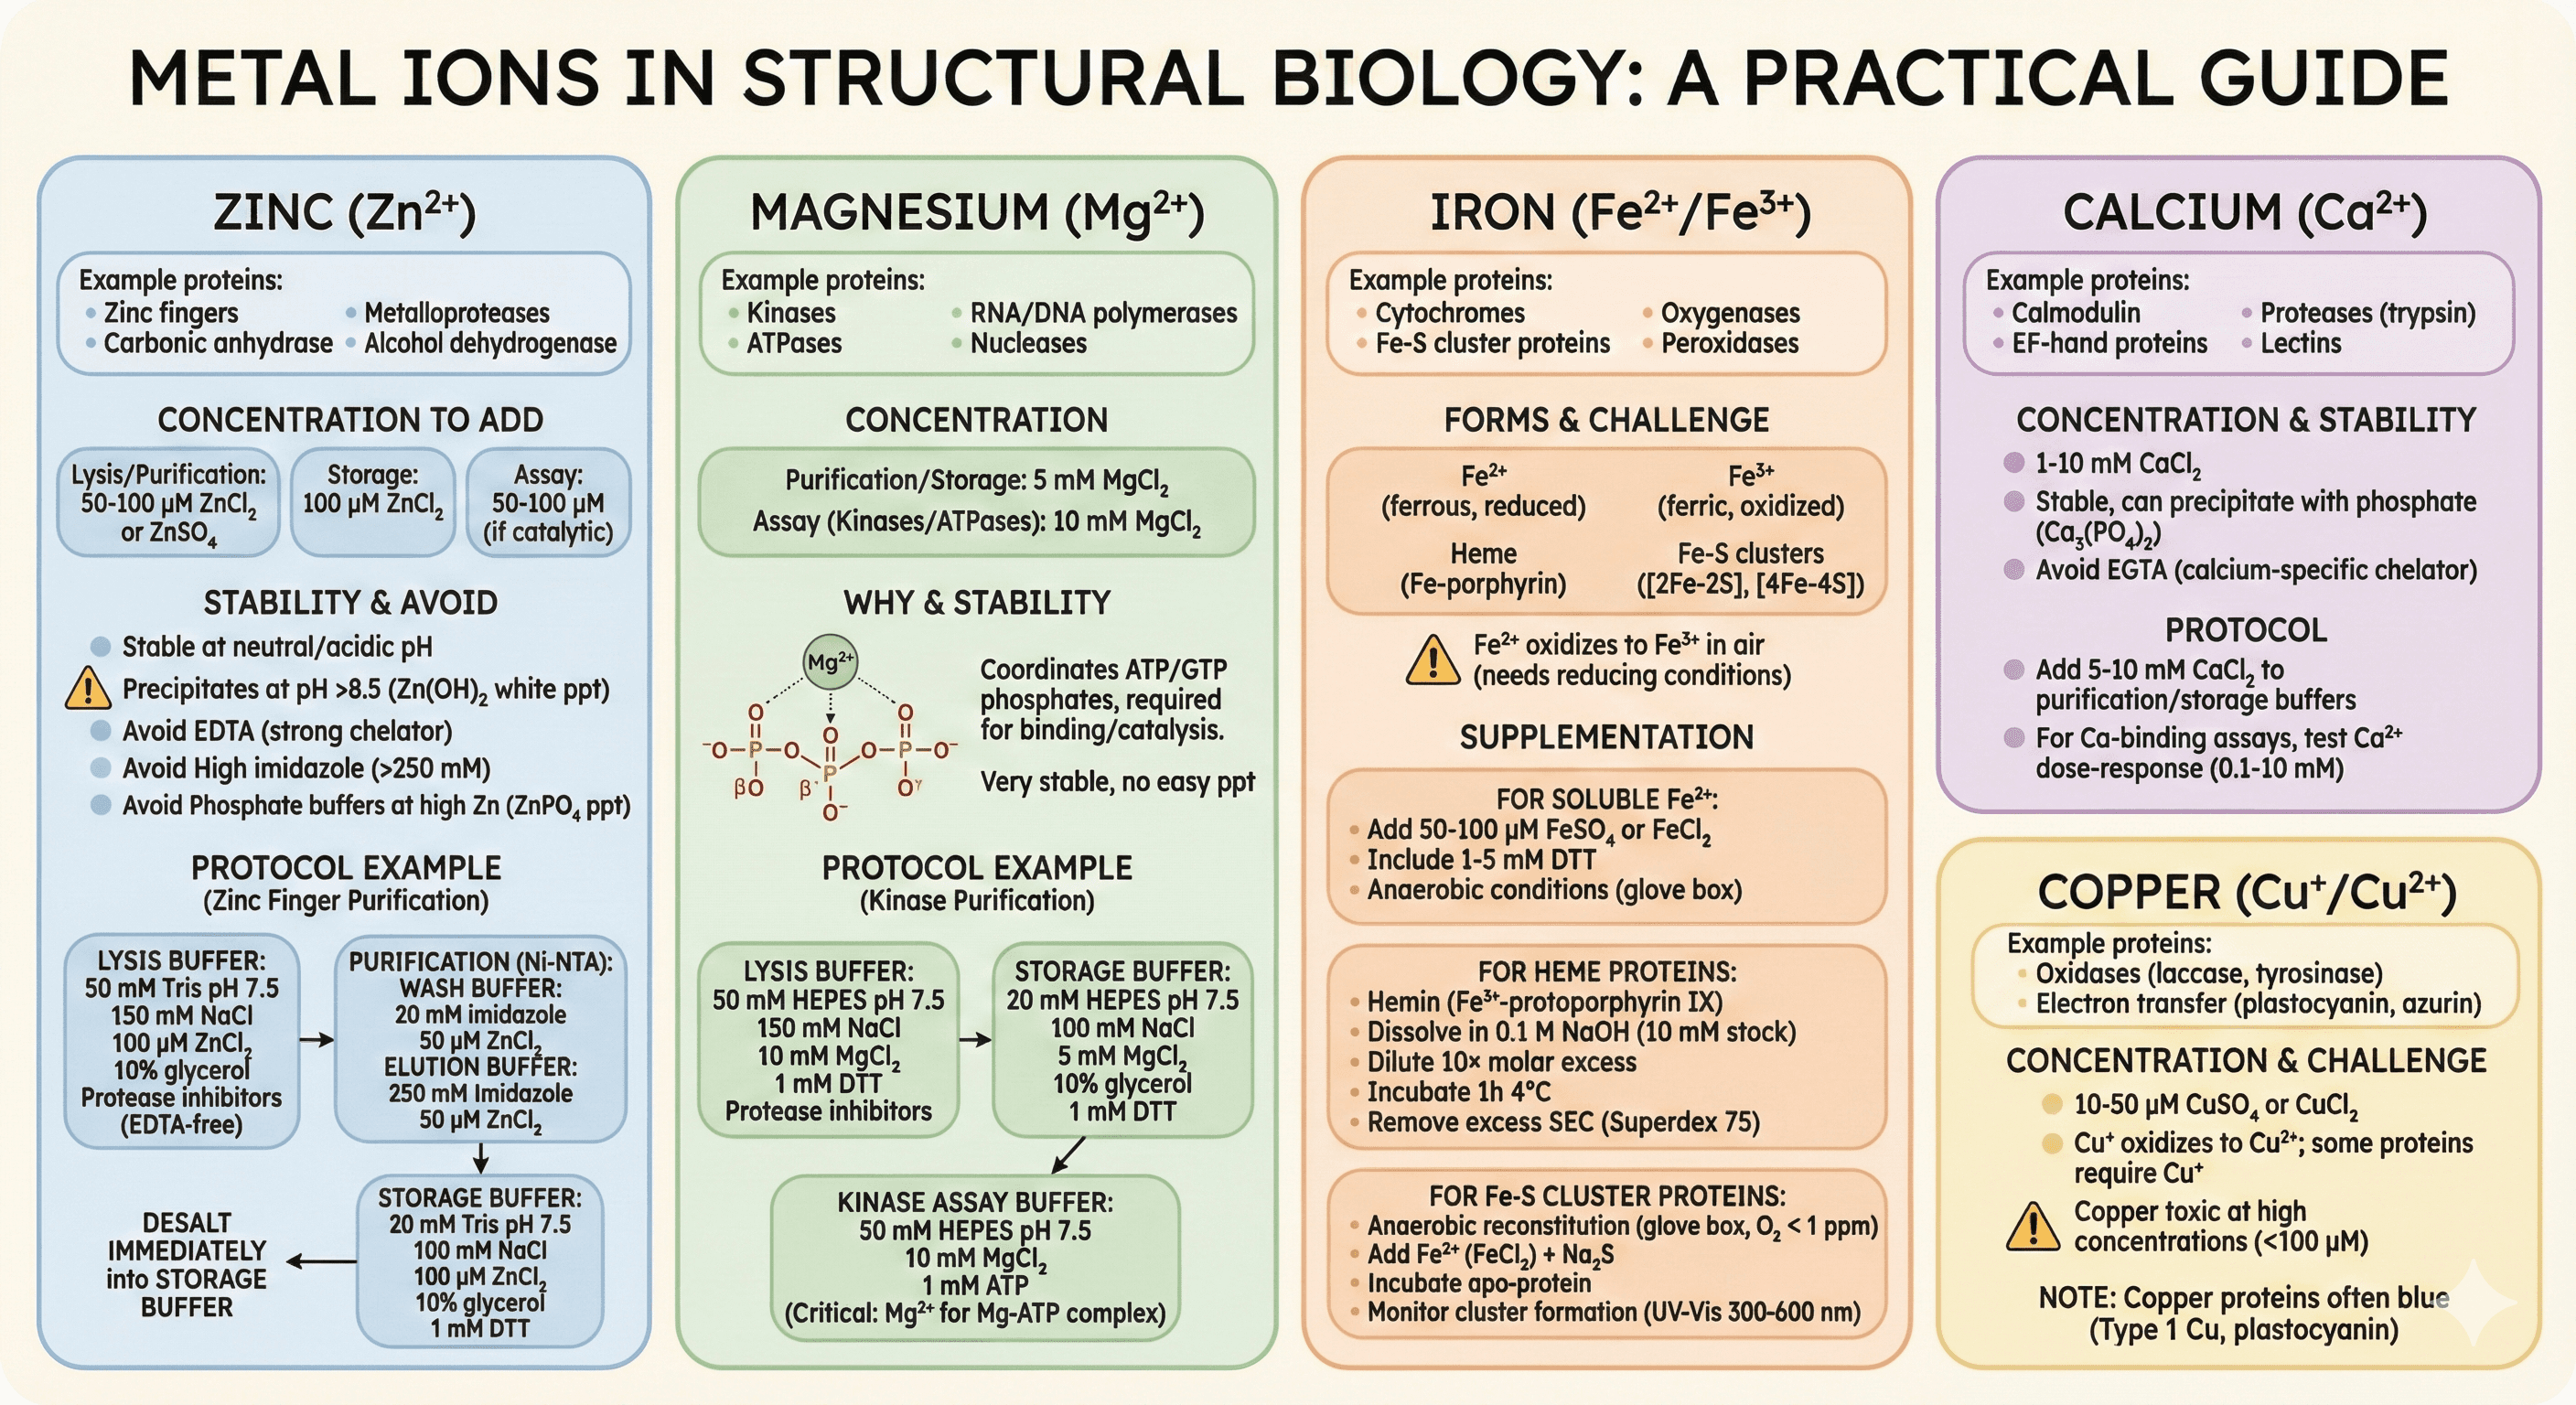
Zinc (Zn²⁺)
Proteins: Zinc fingers, carbonic anhydrase, metalloproteases, alcohol dehydrogenase
Concentration to add:
Lysis/purification buffers: 50-100 μM ZnCl₂ or ZnSO₄
Storage buffer: 100 μM ZnCl₂
Assay buffer: 50-100 μM (if catalytic)
Stability:
Stable at neutral/acidic pH
Precipitates at pH >8.5 (forms Zn(OH)₂, white precipitate)
Avoid:
EDTA (strong chelator, strips Zn)
High imidazole (>250 mM, chelates Zn)
Phosphate buffers at high Zn concentrations (forms ZnPO₄ precipitate)
Protocol Example (Zinc Finger Purification):
Lysis buffer:
50 mM Tris-HCl pH 7.5
150 mM NaCl
100 μM ZnCl₂
10% glycerol
Protease inhibitors (EDTA-free)
Purification (Ni-NTA):
Wash buffer: 50 mM Tris pH 7.5, 150 mM NaCl, 20 mM imidazole, 50 μM ZnCl₂
Elution buffer: 50 mM Tris pH 7.5, 150 mM NaCl, 250 mM imidazole, 50 μM ZnCl₂
Desalt immediately into storage buffer (remove imidazole)
Storage buffer:
20 mM Tris pH 7.5, 100 mM NaCl, 100 μM ZnCl₂, 10% glycerol, 1 mM DTT
Magnesium (Mg²⁺)
Proteins: Kinases, ATPases, RNA polymerases, DNA polymerases, nucleases
Concentration:
Purification: 5 mM MgCl₂
Assay buffer: 10 mM MgCl₂ (kinases, ATPases)
Storage: 5 mM MgCl₂
Why: Mg²⁺ coordinates ATP/GTP phosphates (β and γ), required for binding and catalysis
Stability: Very stable, doesn't precipitate easily
Protocol Example (Kinase Purification):
Lysis buffer:
50 mM HEPES pH 7.5
150 mM NaCl
10 mM MgCl₂
1 mM DTT
Protease inhibitors
Storage buffer:
20 mM HEPES pH 7.5, 100 mM NaCl, 5 mM MgCl₂, 10% glycerol, 1 mM DTT
Kinase assay buffer:
50 mM HEPES pH 7.5, 100 mM NaCl, 10 mM MgCl₂, 1 mM ATP
Critical: Mg²⁺ must be present for ATP binding (forms Mg-ATP complex)
Iron (Fe²⁺/Fe³⁺)
Proteins: Cytochromes, Fe-S cluster proteins, oxygenases, peroxidases
Forms:
Fe²⁺ (ferrous): Reduced iron
Fe³⁺ (ferric): Oxidized iron
Heme: Iron-porphyrin complex
Fe-S clusters: [2Fe-2S], [4Fe-4S] cubane structures
Challenge: Fe²⁺ oxidizes to Fe³⁺ in air (needs reducing conditions)
Supplementation:
For soluble Fe²⁺:
Add 50-100 μM FeSO₄ or FeCl₂
Include 1-5 mM DTT (keep Fe reduced)
Work in anaerobic conditions if possible (glove box)
For heme proteins:
Hemin (Fe³⁺-protoporphyrin IX):
Dissolve hemin in 0.1 M NaOH (10 mM stock, heme is insoluble at neutral pH)
Dilute into protein solution (10× molar excess)
Incubate 1 hour at 4°C (gentle mixing)
Remove excess hemin by SEC (Superdex 75)
For Fe-S cluster proteins:
Often require anaerobic reconstitution:
In glove box (O₂ < 1 ppm), add Fe²⁺ (FeCl₂) + Na₂S (sulfide source)
Incubate with apo-protein
Monitor cluster formation (UV-Vis: broad absorption 300-600 nm)
Calcium (Ca²⁺)
Proteins: Calmodulin, EF-hand proteins, proteases (trypsin), lectins
Concentration: 1-10 mM CaCl₂
Stability: Stable, can precipitate with phosphate (forms Ca₃(PO₄)₂)
Avoid: EGTA (calcium-specific chelator)
Protocol:
Add 5-10 mM CaCl₂ to purification and storage buffers
For Ca-binding assays, test Ca²⁺ dose-response (0.1-10 mM)
Copper (Cu⁺/Cu²⁺)
Proteins: Oxidases (laccase, tyrosinase), electron transfer (plastocyanin, azurin)
Concentration: 10-50 μM CuSO₄ or CuCl₂
Challenge: Cu⁺ oxidizes to Cu²⁺; some proteins require Cu⁺
Note: Copper is toxic at high concentrations (keep <100 μM)
Color: Copper proteins are often blue (Type 1 Cu, plastocyanin)
Organic Cofactors (Coenzymes)
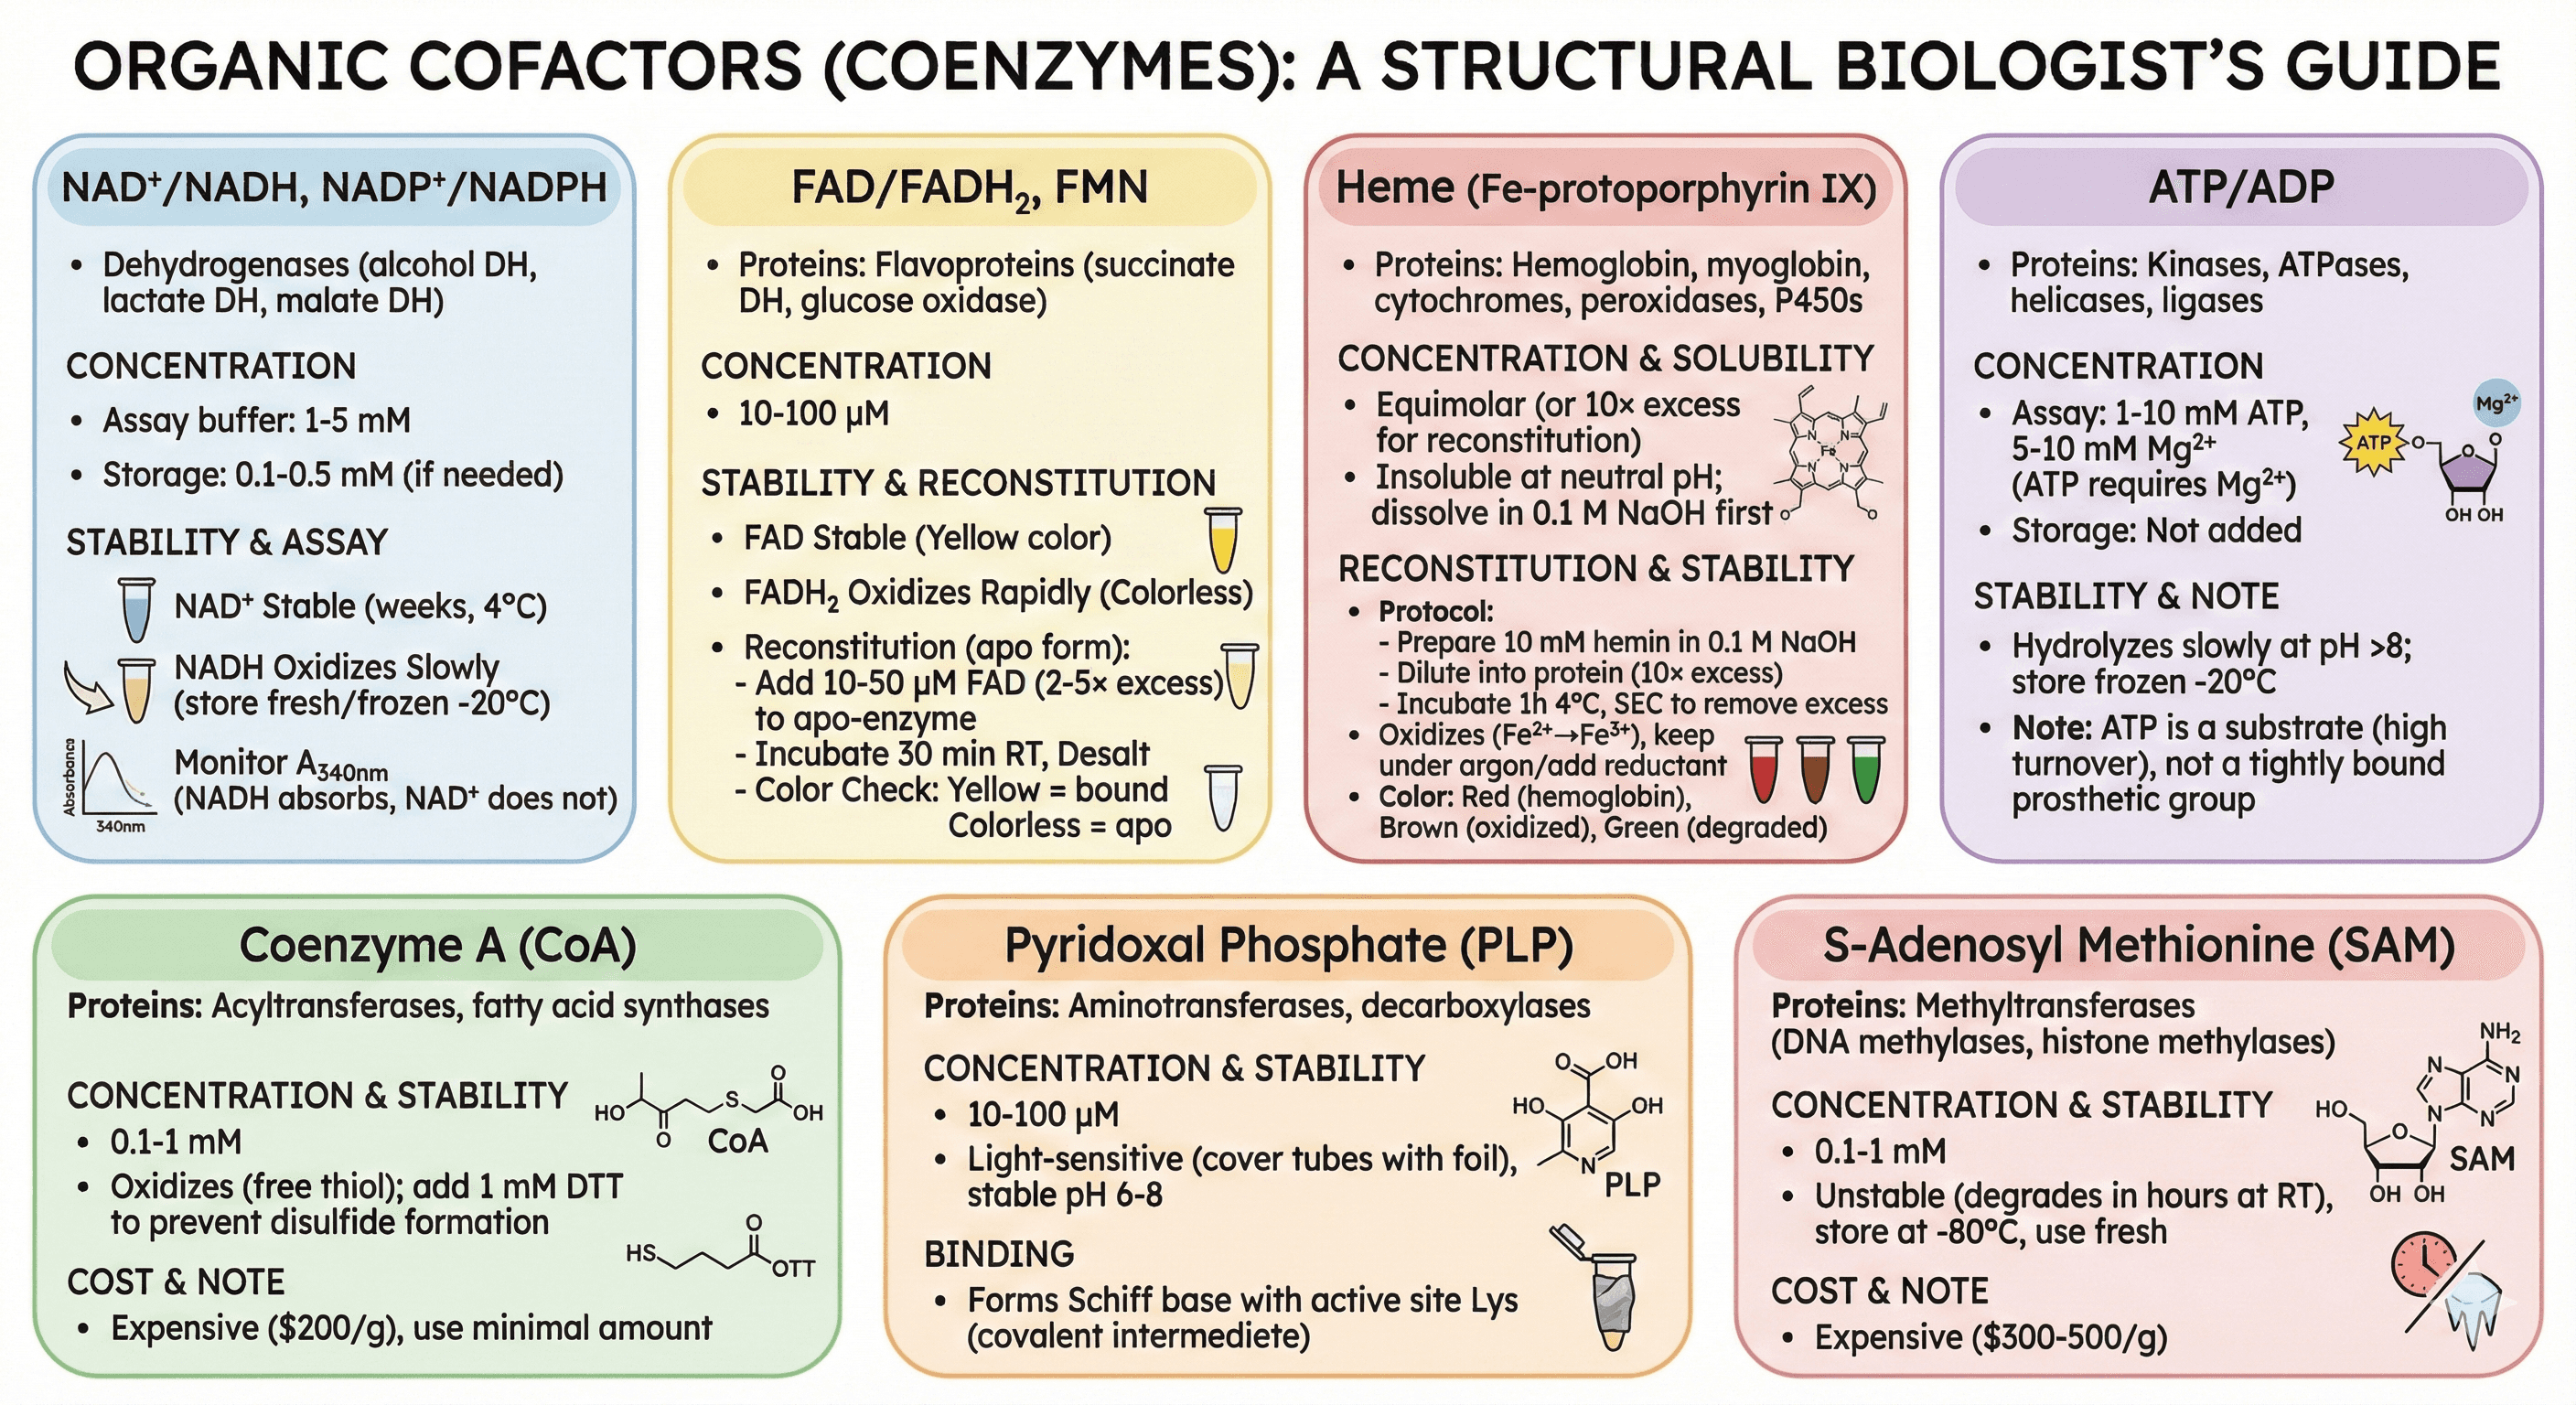
NAD⁺/NADH, NADP⁺/NADPH
Proteins: Dehydrogenases (alcohol DH, lactate DH, malate DH)
Concentration:
Assay buffer: 1-5 mM NAD⁺ or NADH (depending on reaction direction)
Storage: 0.1-0.5 mM (if needed for stability)
Stability:
NAD⁺ is stable (weeks at 4°C)
NADH oxidizes slowly (use fresh, store frozen at -20°C)
Assay: Monitor absorbance at 340 nm (NADH absorbs, NAD⁺ does not)
FAD/FADH₂, FMN
Proteins: Flavoproteins (succinate dehydrogenase, glucose oxidase, amino acid oxidases)
Concentration: 10-100 μM
Stability:
FAD is stable (yellow color)
FADH₂ oxidizes rapidly (colorless when reduced)
Reconstitution (if apo form):
Purify apo-enzyme
Add 10-50 μM FAD (2-5× molar excess)
Incubate 30 min at RT
Desalt to remove free FAD
Color check: Yellow = FAD bound, colorless = apo form
Heme (Fe-protoporphyrin IX)
Proteins: Hemoglobin, myoglobin, cytochromes, peroxidases, P450s
Concentration: Equimolar to protein (if non-covalent), 10× excess for reconstitution
Solubility: Insoluble at neutral pH; dissolve in 0.1 M NaOH first
Reconstitution protocol:
Prepare hemin stock: 10 mM in 0.1 M NaOH
Dilute hemin into protein solution (10× molar excess)
Incubate 1 hour at 4°C (gentle rotation)
SEC to remove excess hemin (Superdex 75 or G-25)
Stability: Oxidizes (Fe²⁺ → Fe³⁺), keep under argon or add reducing agent
Color: Red (hemoglobin), brown (oxidized), green (degraded)
ATP/ADP
Proteins: Kinases, ATPases, helicases, ligases
Concentration:
Assay: 1-10 mM ATP, 5-10 mM Mg²⁺ (ATP requires Mg²⁺)
Storage: Not added (ATP is a substrate, not tightly bound cofactor)
Stability: ATP hydrolyzes slowly at pH >8; store frozen at -20°C
Note: ATP is a substrate (high turnover), not a tightly bound prosthetic group
Coenzyme A (CoA)
Proteins: Acyltransferases, fatty acid synthases, citrate synthase
Concentration: 0.1-1 mM
Stability: Oxidizes (free thiol); add 1 mM DTT to prevent disulfide formation
Cost: Expensive ($200/g), use minimal amount
Pyridoxal Phosphate (PLP)
Proteins: Aminotransferases, decarboxylases (DOPA decarboxylase, serine decarboxylase)
Concentration: 10-100 μM
Stability: Light-sensitive (cover tubes with foil), stable at pH 6-8
Binding: Forms Schiff base with active site Lys (covalent intermediate during catalysis)
S-Adenosyl Methionine (SAM)
Proteins: Methyltransferases (DNA methylases, histone methylases)
Concentration: 0.1-1 mM
Stability: Unstable (degrades in hours at RT), store at -80°C, use fresh
Cost: Expensive ($300-500/g), buy from Sigma
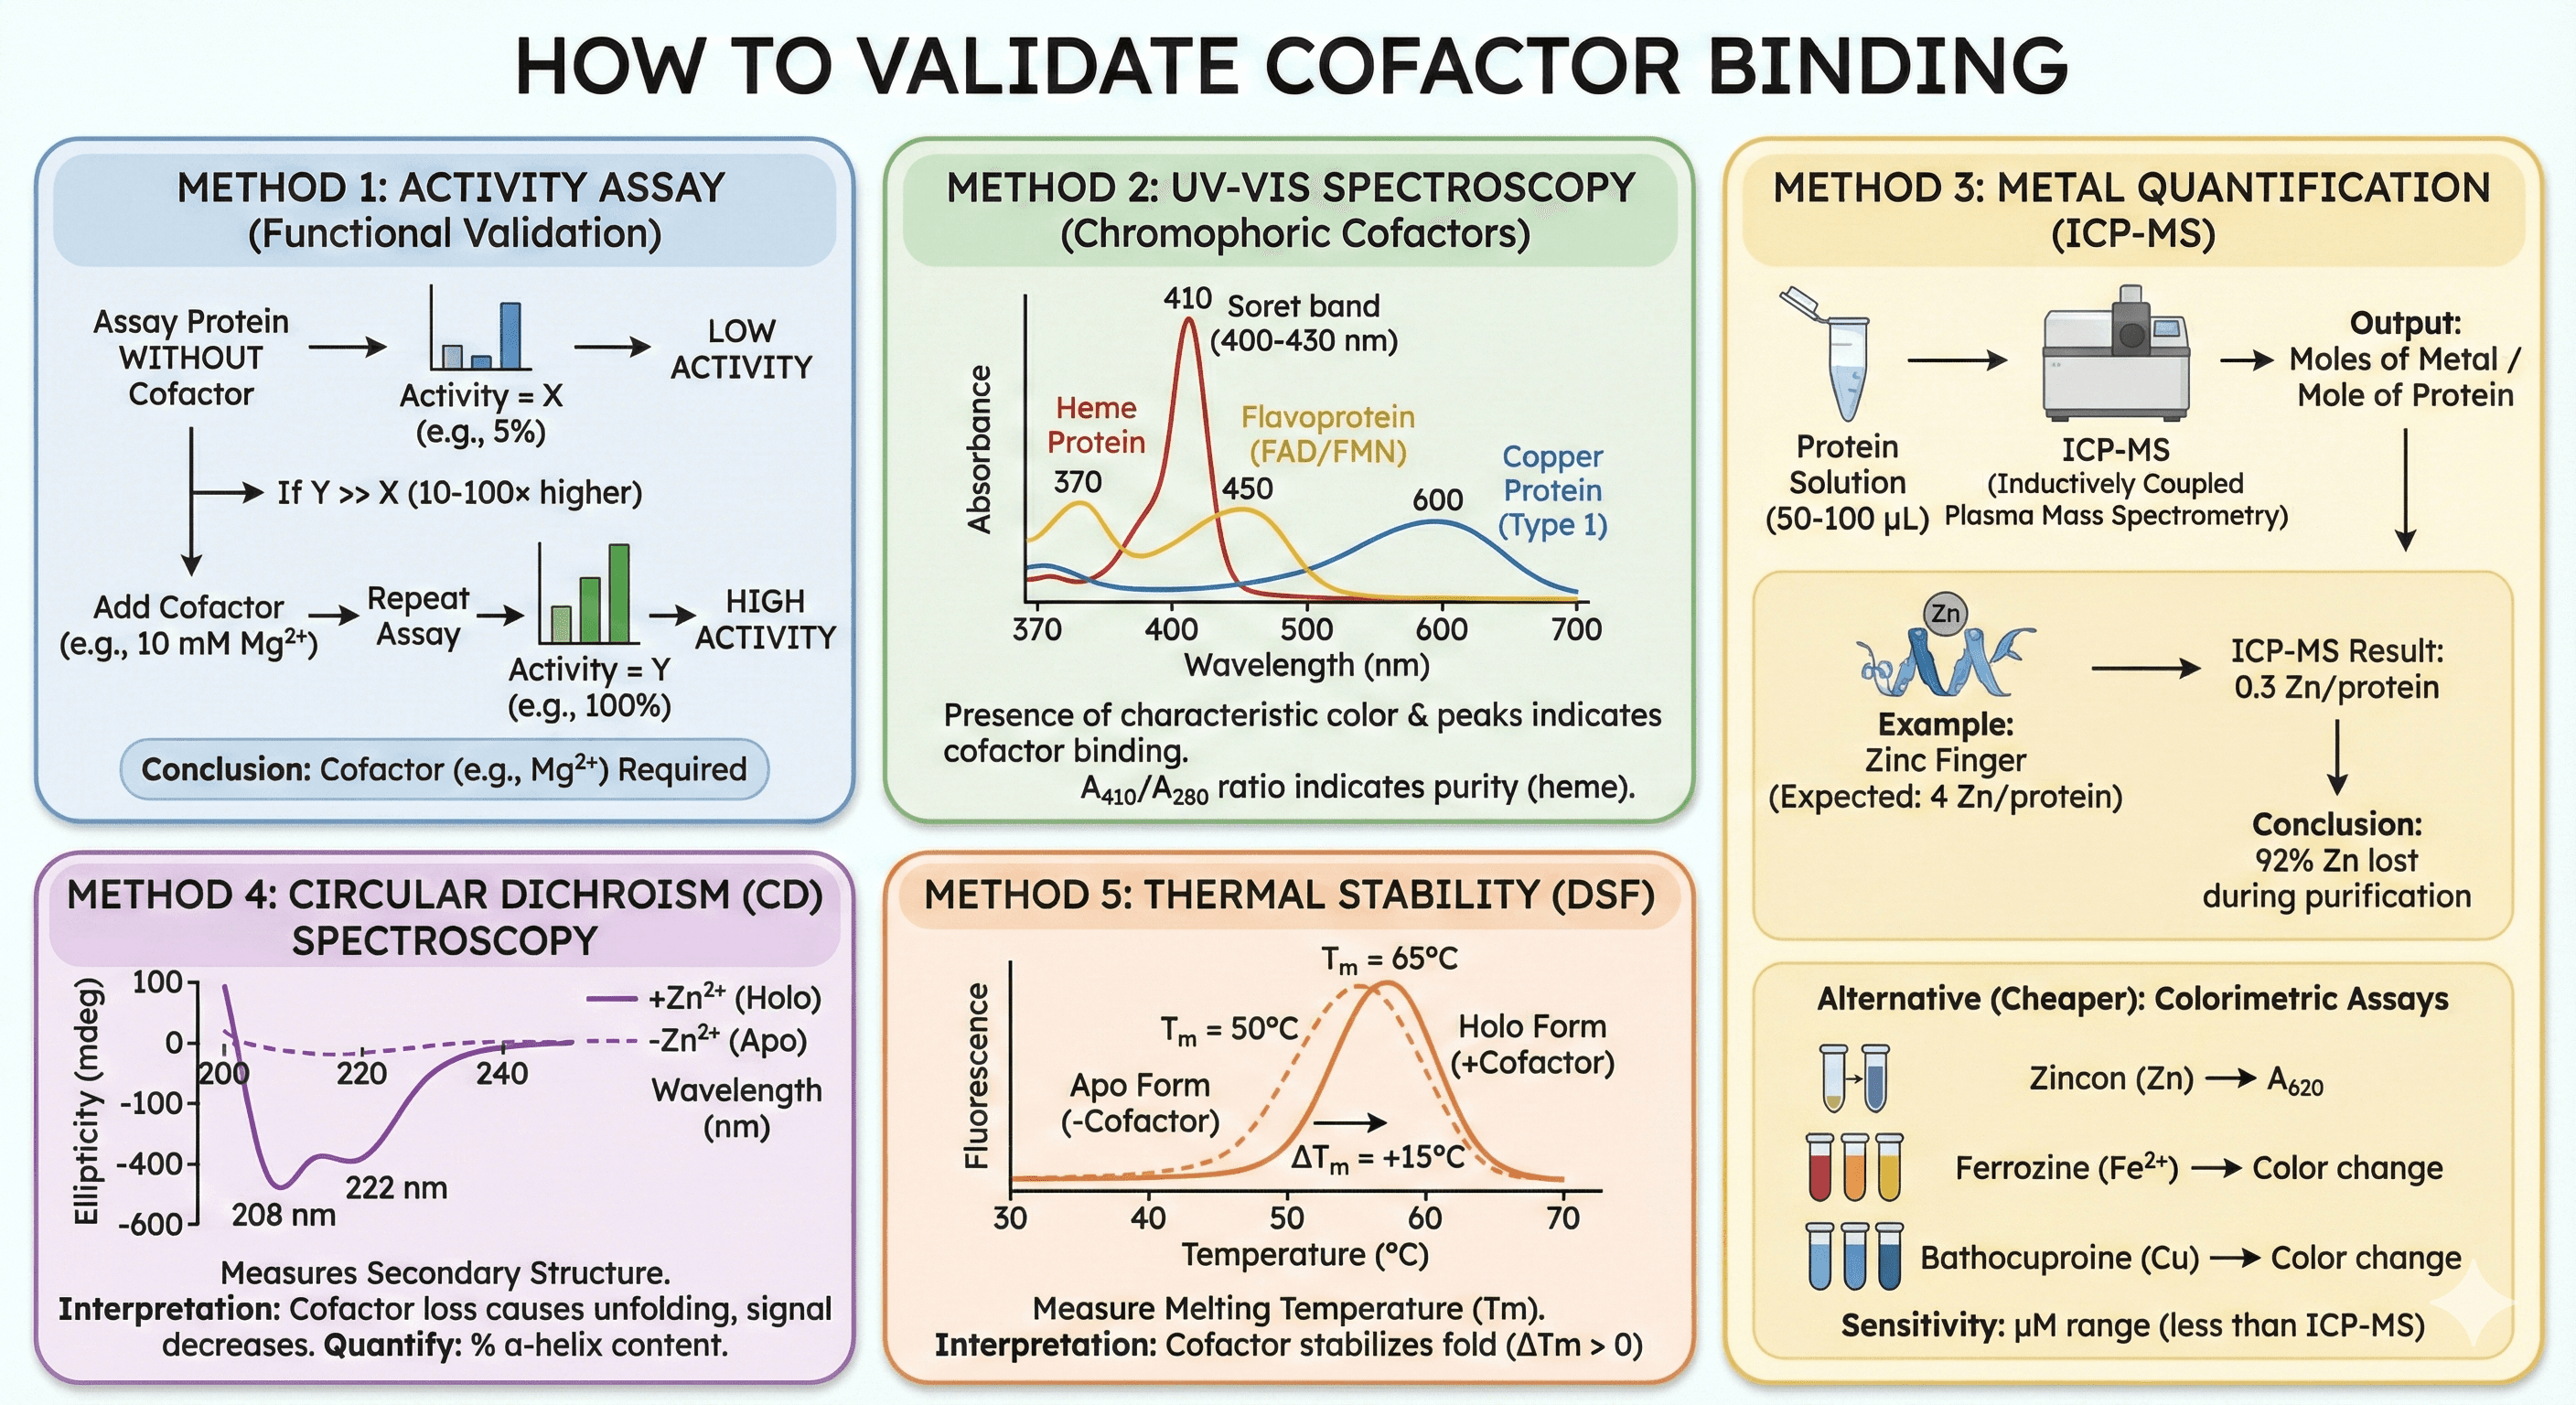
How to Validate Cofactor Binding
Method 1: Activity Assay (Functional Validation)
Test with and without cofactor:
Assay protein without added cofactor → Activity = X
Add cofactor (e.g., 10 mM Mg²⁺), repeat assay → Activity = Y
If Y >> X (10-100× higher), cofactor was missing
Example (kinase):
No Mg²⁺: 5% activity
+10 mM Mg²⁺: 100% activity
Conclusion: Mg²⁺ required
Method 2: UV-Vis Spectroscopy (Chromophoric Cofactors)
For colored cofactors:
Heme proteins:
Soret band: 400-430 nm (strong absorption, ε ~100,000 M⁻¹cm⁻¹)
If present: A₄₀₀₋₄₃₀ > 0.5 (for 1 mg/mL protein)
If absent: No peak
Flavoproteins (FAD/FMN):
Peaks: 370 nm, 450 nm (yellow color)
If absent: Colorless
Copper proteins:
Type 1 Cu: Peak at 600 nm (blue color)
Example spectrum:
Cytochrome c: Soret peak at 410 nm (oxidized) or 415 nm (reduced)
Ratio A₄₁₀/A₂₈₀ (heme:protein) = purity indicator
Method 3: Metal Quantification (ICP-MS)
ICP-MS (Inductively Coupled Plasma Mass Spectrometry):
Quantifies metal content (Zn, Mg, Fe, Ca, Cu, Mn)
Sensitivity: Parts per billion (ppb), pmol levels
Sample: 50-100 μL protein solution
Output: Moles of metal per mole of protein
Example:
Zinc finger protein (expected: 4 Zn per protein)
ICP-MS: 0.3 Zn per protein
Conclusion: 92% of Zn was lost during purification
Alternative (cheaper): Colorimetric Metal Assays
Zincon assay (Zn): Forms colored complex, measure A₆₂₀
Ferrozine assay (Fe²⁺): Detects reduced iron
Bathocuproine (Cu): Detects Cu⁺
Sensitivity: μM range (less sensitive than ICP-MS)
Method 4: Circular Dichroism (CD) Spectroscopy
What it measures: Secondary structure (α-helix, β-sheet)
Application:
Zinc finger +Zn²⁺ → strong α-helix signal (negative peaks at 208, 222 nm)
Zinc finger -Zn²⁺ → loss of structure (flat CD spectrum)
Interpretation:
If cofactor loss causes unfolding, CD signal decreases
Quantify: % α-helix content from CD data
Method 5: Thermal Stability (DSF)
DSF (Differential Scanning Fluorimetry):
Measure melting temperature (Tm) with and without cofactor
Expected result:
Holo form (with cofactor): Tm = 65°C
Apo form (without cofactor): Tm = 50°C
ΔTm = +15°C with cofactor (stabilizing effect)
Interpretation: Cofactor stabilizes fold
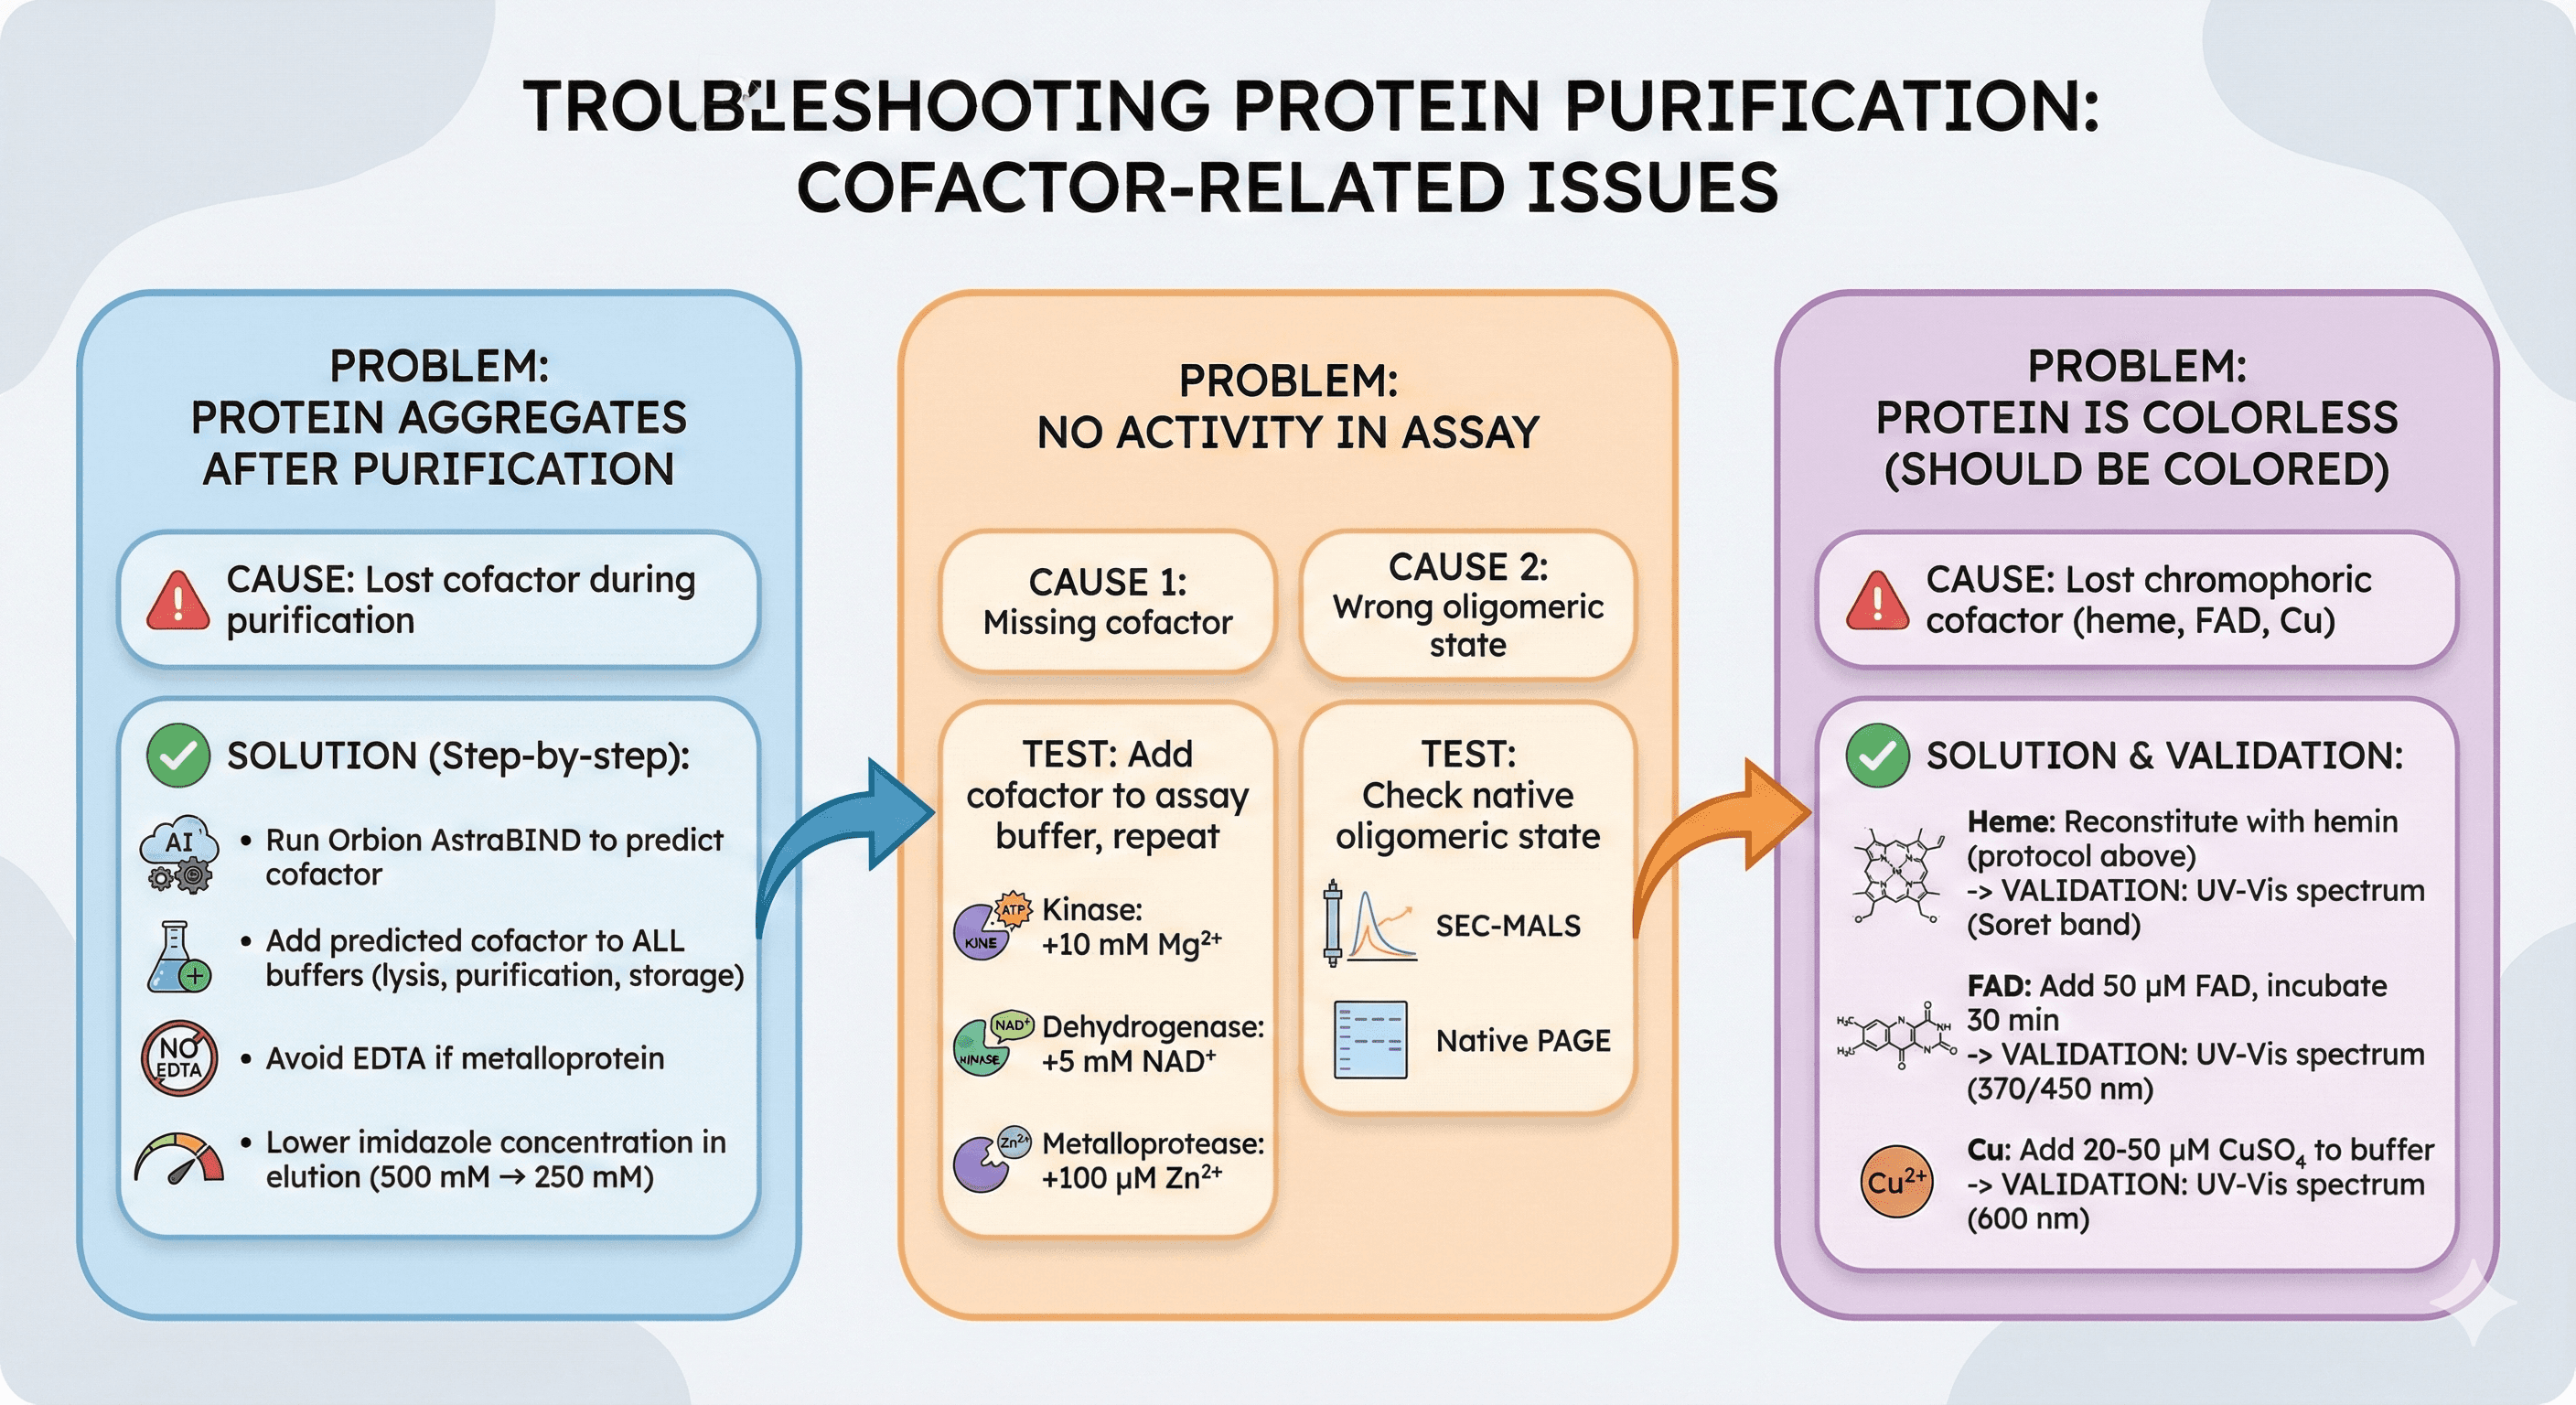
Troubleshooting Guide
Problem: Protein aggregates after purification
Cause: Lost cofactor during purification
Solution:
Run Orbion AstraBIND to predict cofactor
Add predicted cofactor to all buffers (lysis, purification, storage)
Avoid EDTA if metalloprotein
Lower imidazole concentration in elution (500 mM → 250 mM)
Problem: No activity in assay
Cause 1: Missing cofactor
Test: Add cofactor to assay buffer, repeat
Kinase: +10 mM Mg²⁺
Dehydrogenase: +5 mM NAD⁺
Metalloprotease: +100 μM Zn²⁺
Cause 2: Wrong oligomeric state
Test: Check native oligomeric state (SEC-MALS, native PAGE)
Problem: Protein is colorless (should be colored)
Cause: Lost chromophoric cofactor (heme, FAD, Cu)
Solution:
Heme: Reconstitute with hemin (protocol above)
FAD: Add 50 μM FAD, incubate 30 min
Cu: Add 20-50 μM CuSO₄ to buffer
Validation: UV-Vis spectrum (Soret band for heme, 370/450 nm for FAD, 600 nm for Cu)
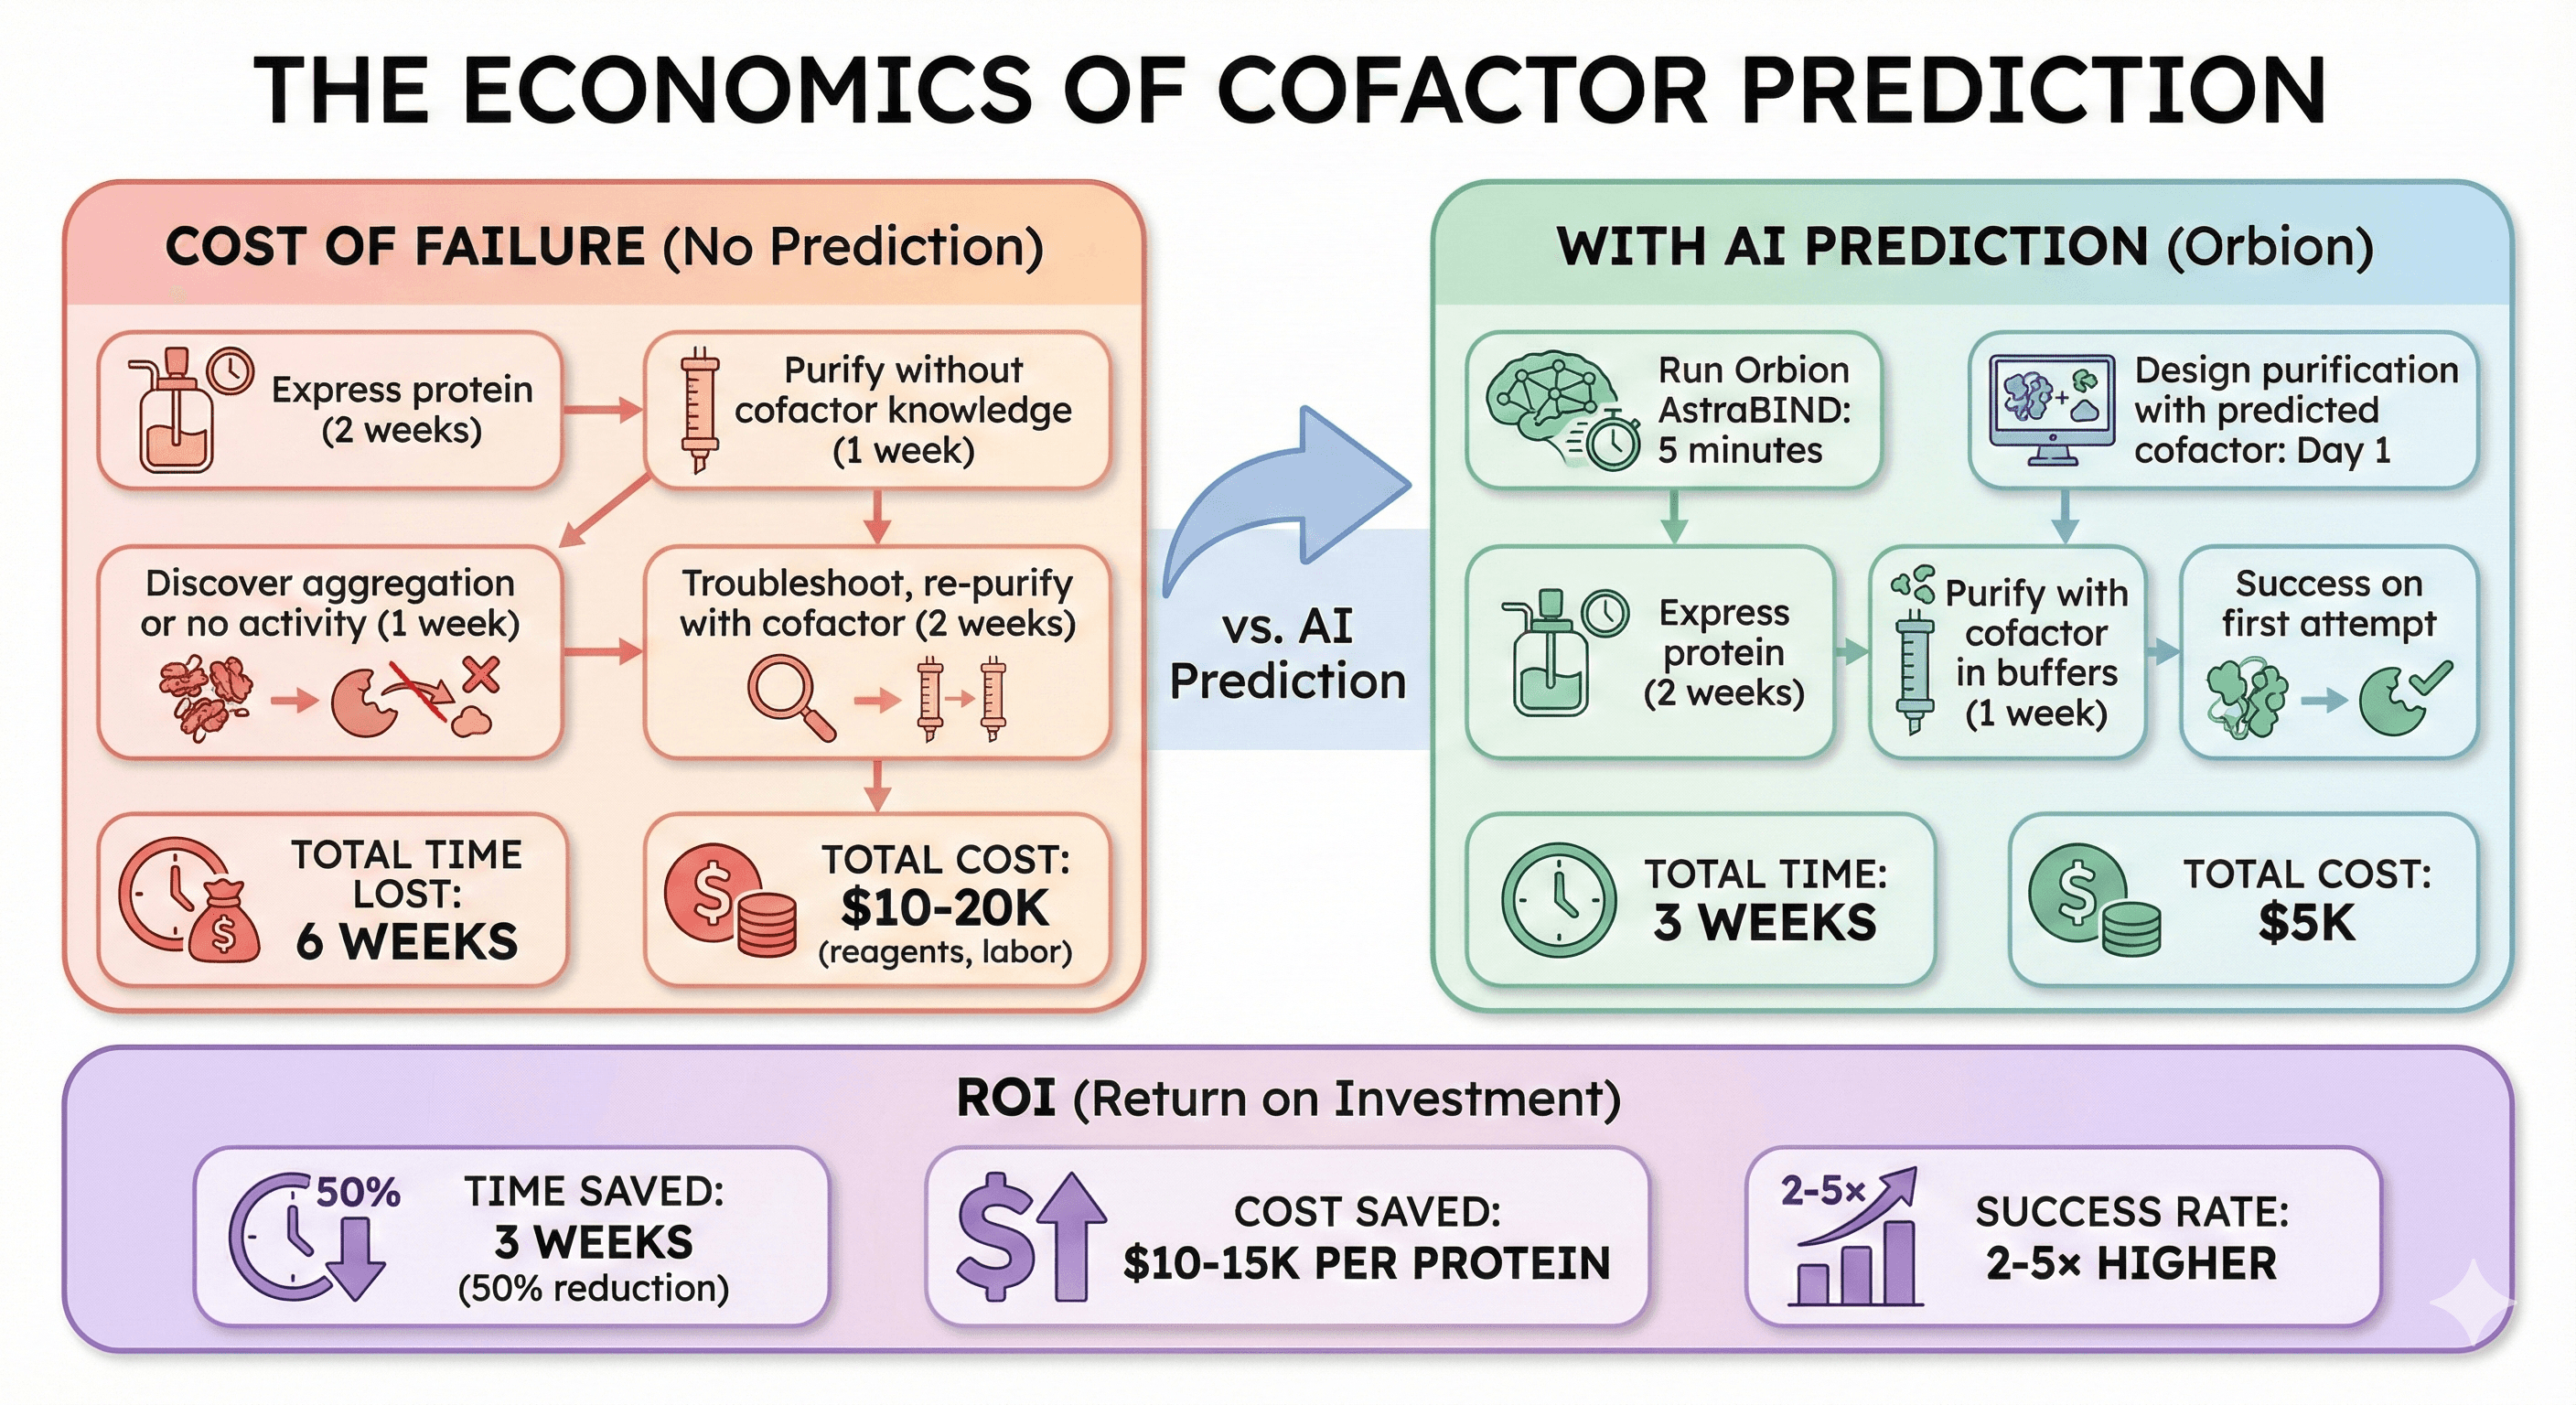
The Economics of Cofactor Prediction
Cost of Failure (No Prediction)
Typical scenario:
Express protein (2 weeks)
Purify without cofactor knowledge (1 week)
Discover aggregation or no activity (1 week)
Troubleshoot, re-purify with cofactor (2 weeks)
Total time lost: 6 weeks
Total cost: $10-20K (reagents, labor)
With AI Prediction (Orbion)
Workflow:
Run Orbion AstraBIND: 5 minutes
Design purification with predicted cofactor: Day 1
Express protein (2 weeks)
Purify with cofactor in buffers (1 week)
Success on first attempt
Total time: 3 weeks
Total cost: $5K
ROI:
Time saved: 3 weeks (50% reduction)
Cost saved: $10-15K per protein
Success rate: 2-5× higher
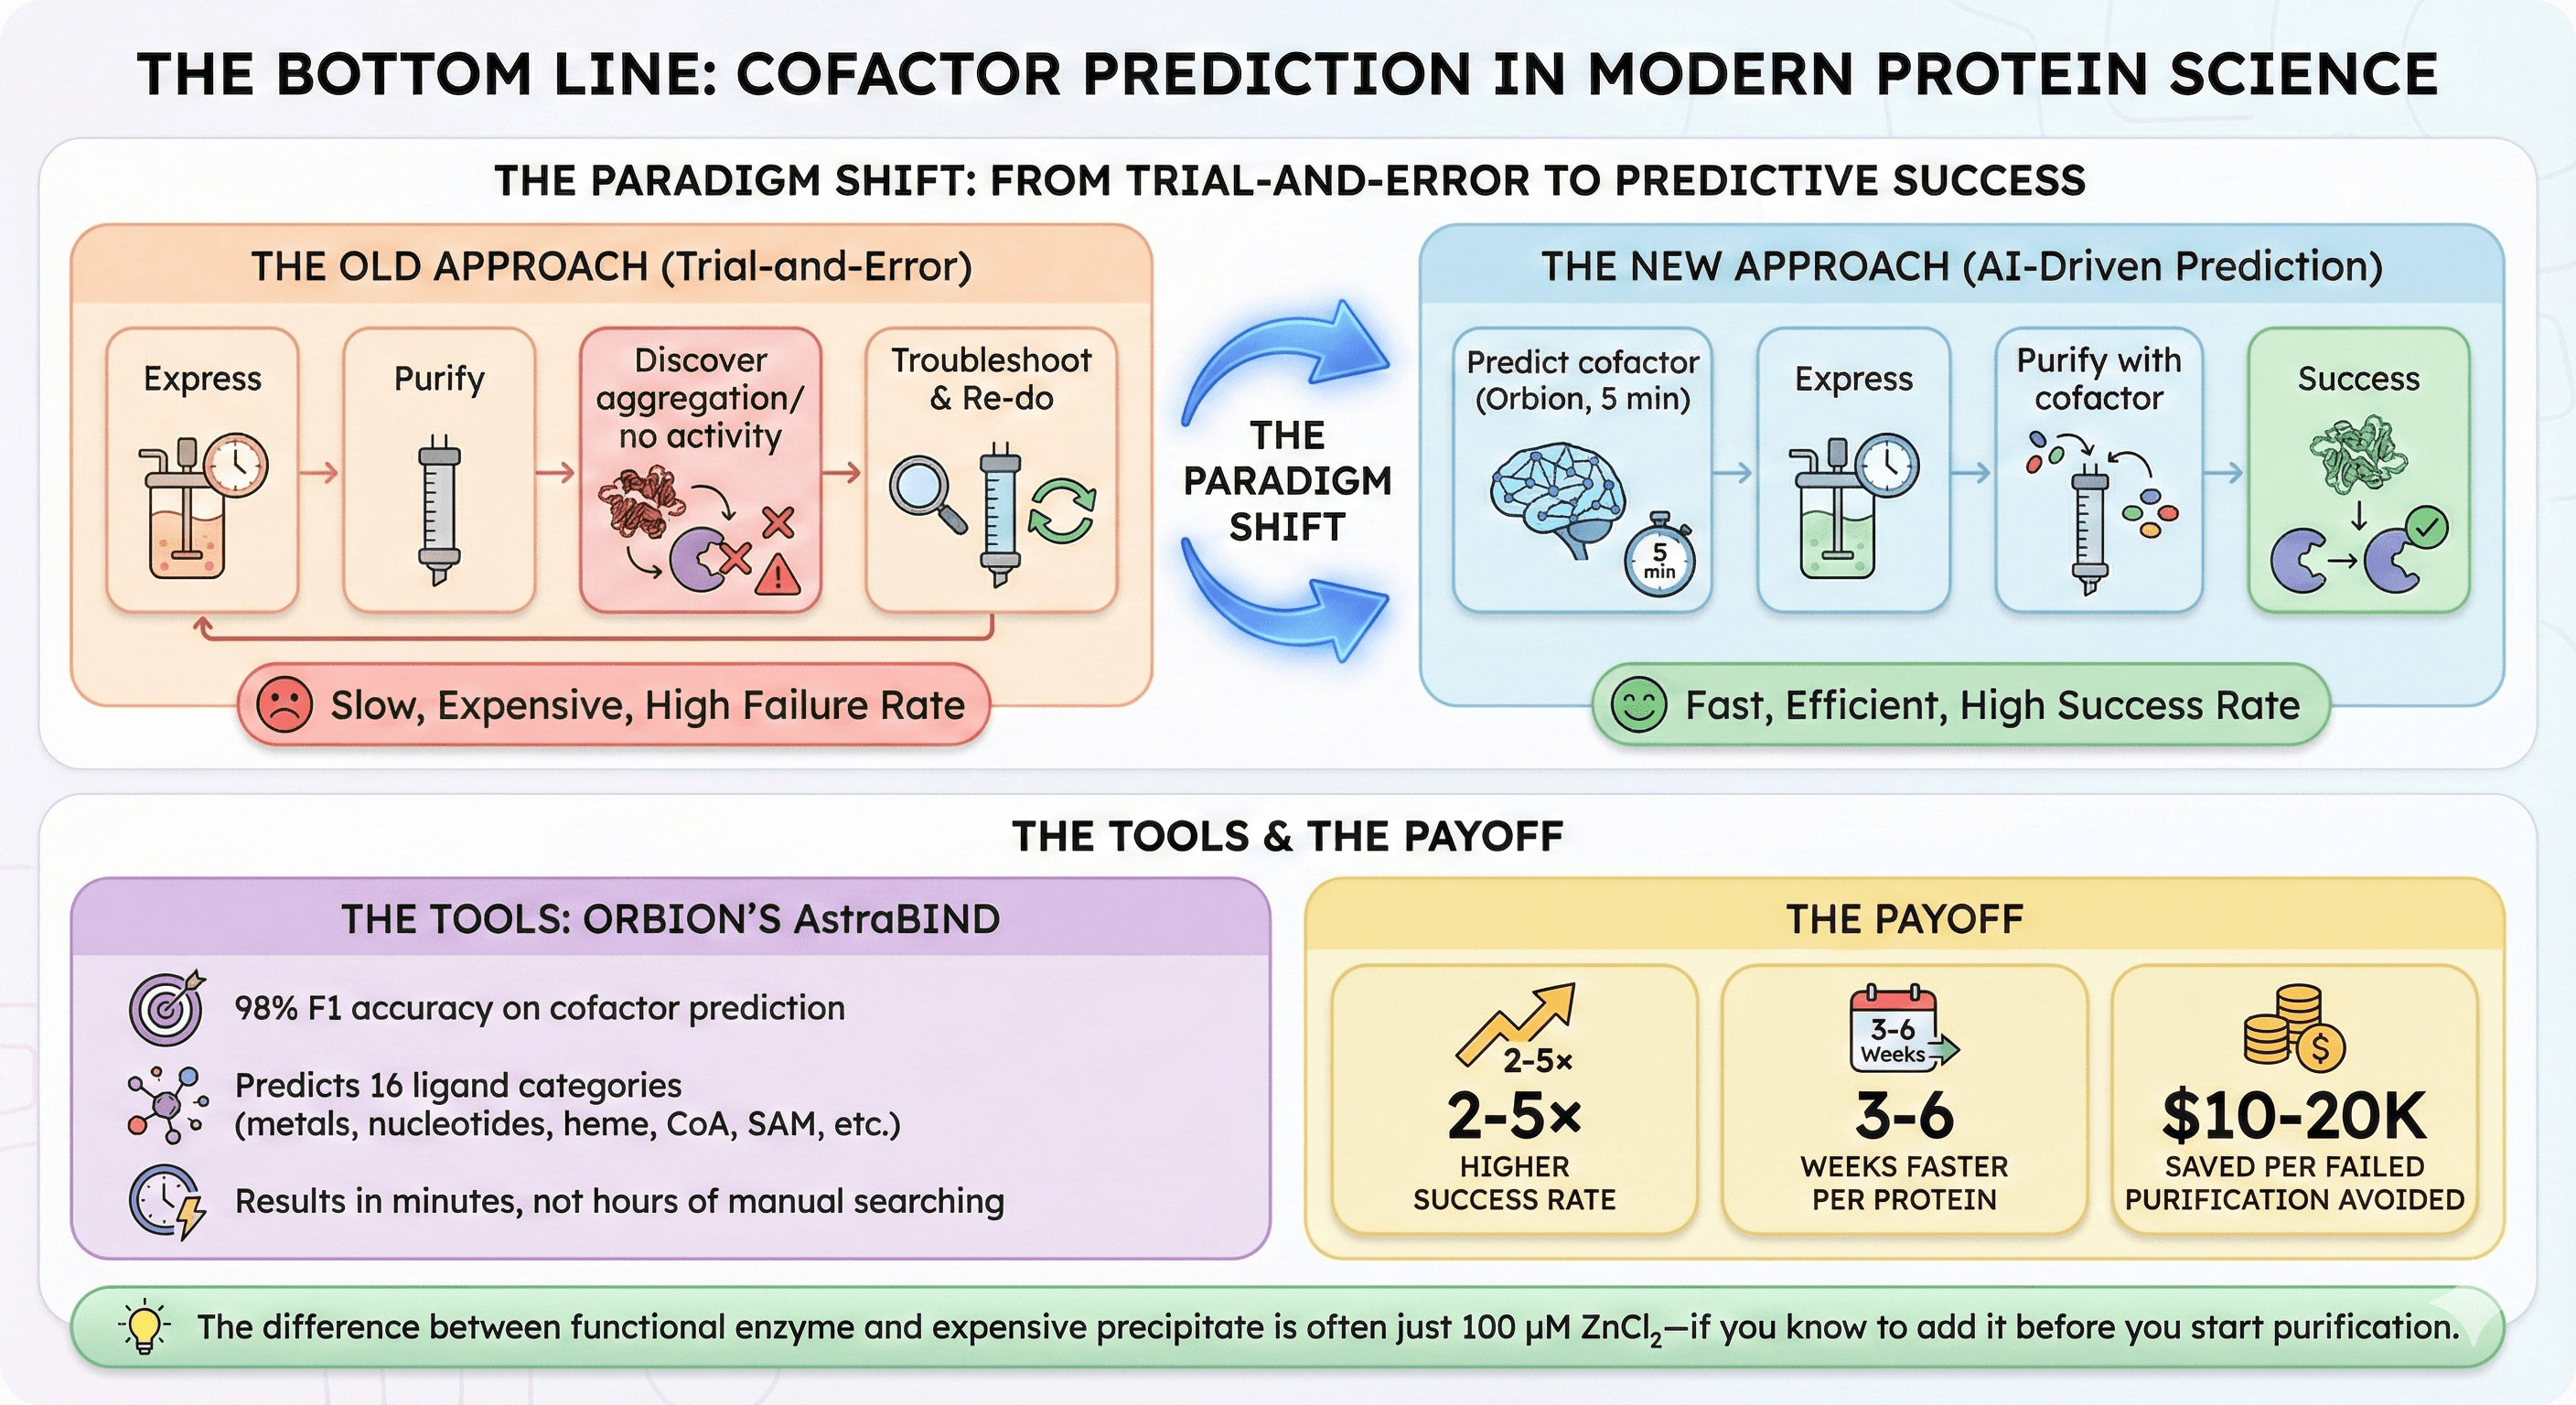
The Bottom Line
Cofactor prediction is no longer optional in modern protein science.
The old approach:
Express → Purify → Discover aggregation/no activity → Troubleshoot → Re-do
The new approach:
Predict cofactor (Orbion, 5 minutes) → Express → Purify with cofactor → Success
The tools:
Orbion's AstraBIND: 98% F1 accuracy on cofactor prediction
Predicts 16 ligand categories (metals, nucleotides, heme, CoA, SAM, etc.)
Results in minutes, not hours of manual searching
The payoff:
2-5× higher success rate
3-6 weeks faster per protein
$10-20K saved per failed purification avoided
The difference between functional enzyme and expensive precipitate is often just 100 μM ZnCl₂—if you know to add it before you start purification.
Ready to Identify Your Protein's Cofactor Requirements?
If you're expressing a new protein and want to know what cofactors it needs before purification, Orbion can help.
Orbion's AstraBIND provides:
Cofactor binding site prediction (16 ligand categories)
Metal coordination site identification (Zn, Mg, Fe, Ca, Cu, Mn)
Nucleotide binding prediction (ATP, NAD, FAD)
Heme binding site detection
98% F1 accuracy (best in class)
Results in minutes (vs hours of manual searches)
Book a 20-Minute Demo
Sign up free for unlimited Overview runs — summary, sequence-based analysis, homology search. For the full Characterization — PTMs, binding sites, stability variants, construct design — book a demo and we'll run your target live.
