Blog
Orbion Team
How to Interpret AlphaFold Confidence Scores for Multi-Chain Complexes

You ran AlphaFold-Multimer on your protein complex. The structure looks beautiful—two chains wrapped around each other in an intricate dance. The pLDDT scores are deep blue (>90) across both proteins. You're ready to publish. But wait: those chains might not actually interact. That beautiful interface might be a computational artifact.
Welcome to the most misunderstood aspect of AlphaFold: confidence scores for complexes are fundamentally different from monomers, and misreading them leads to wrong biological conclusions.
Key Takeaways
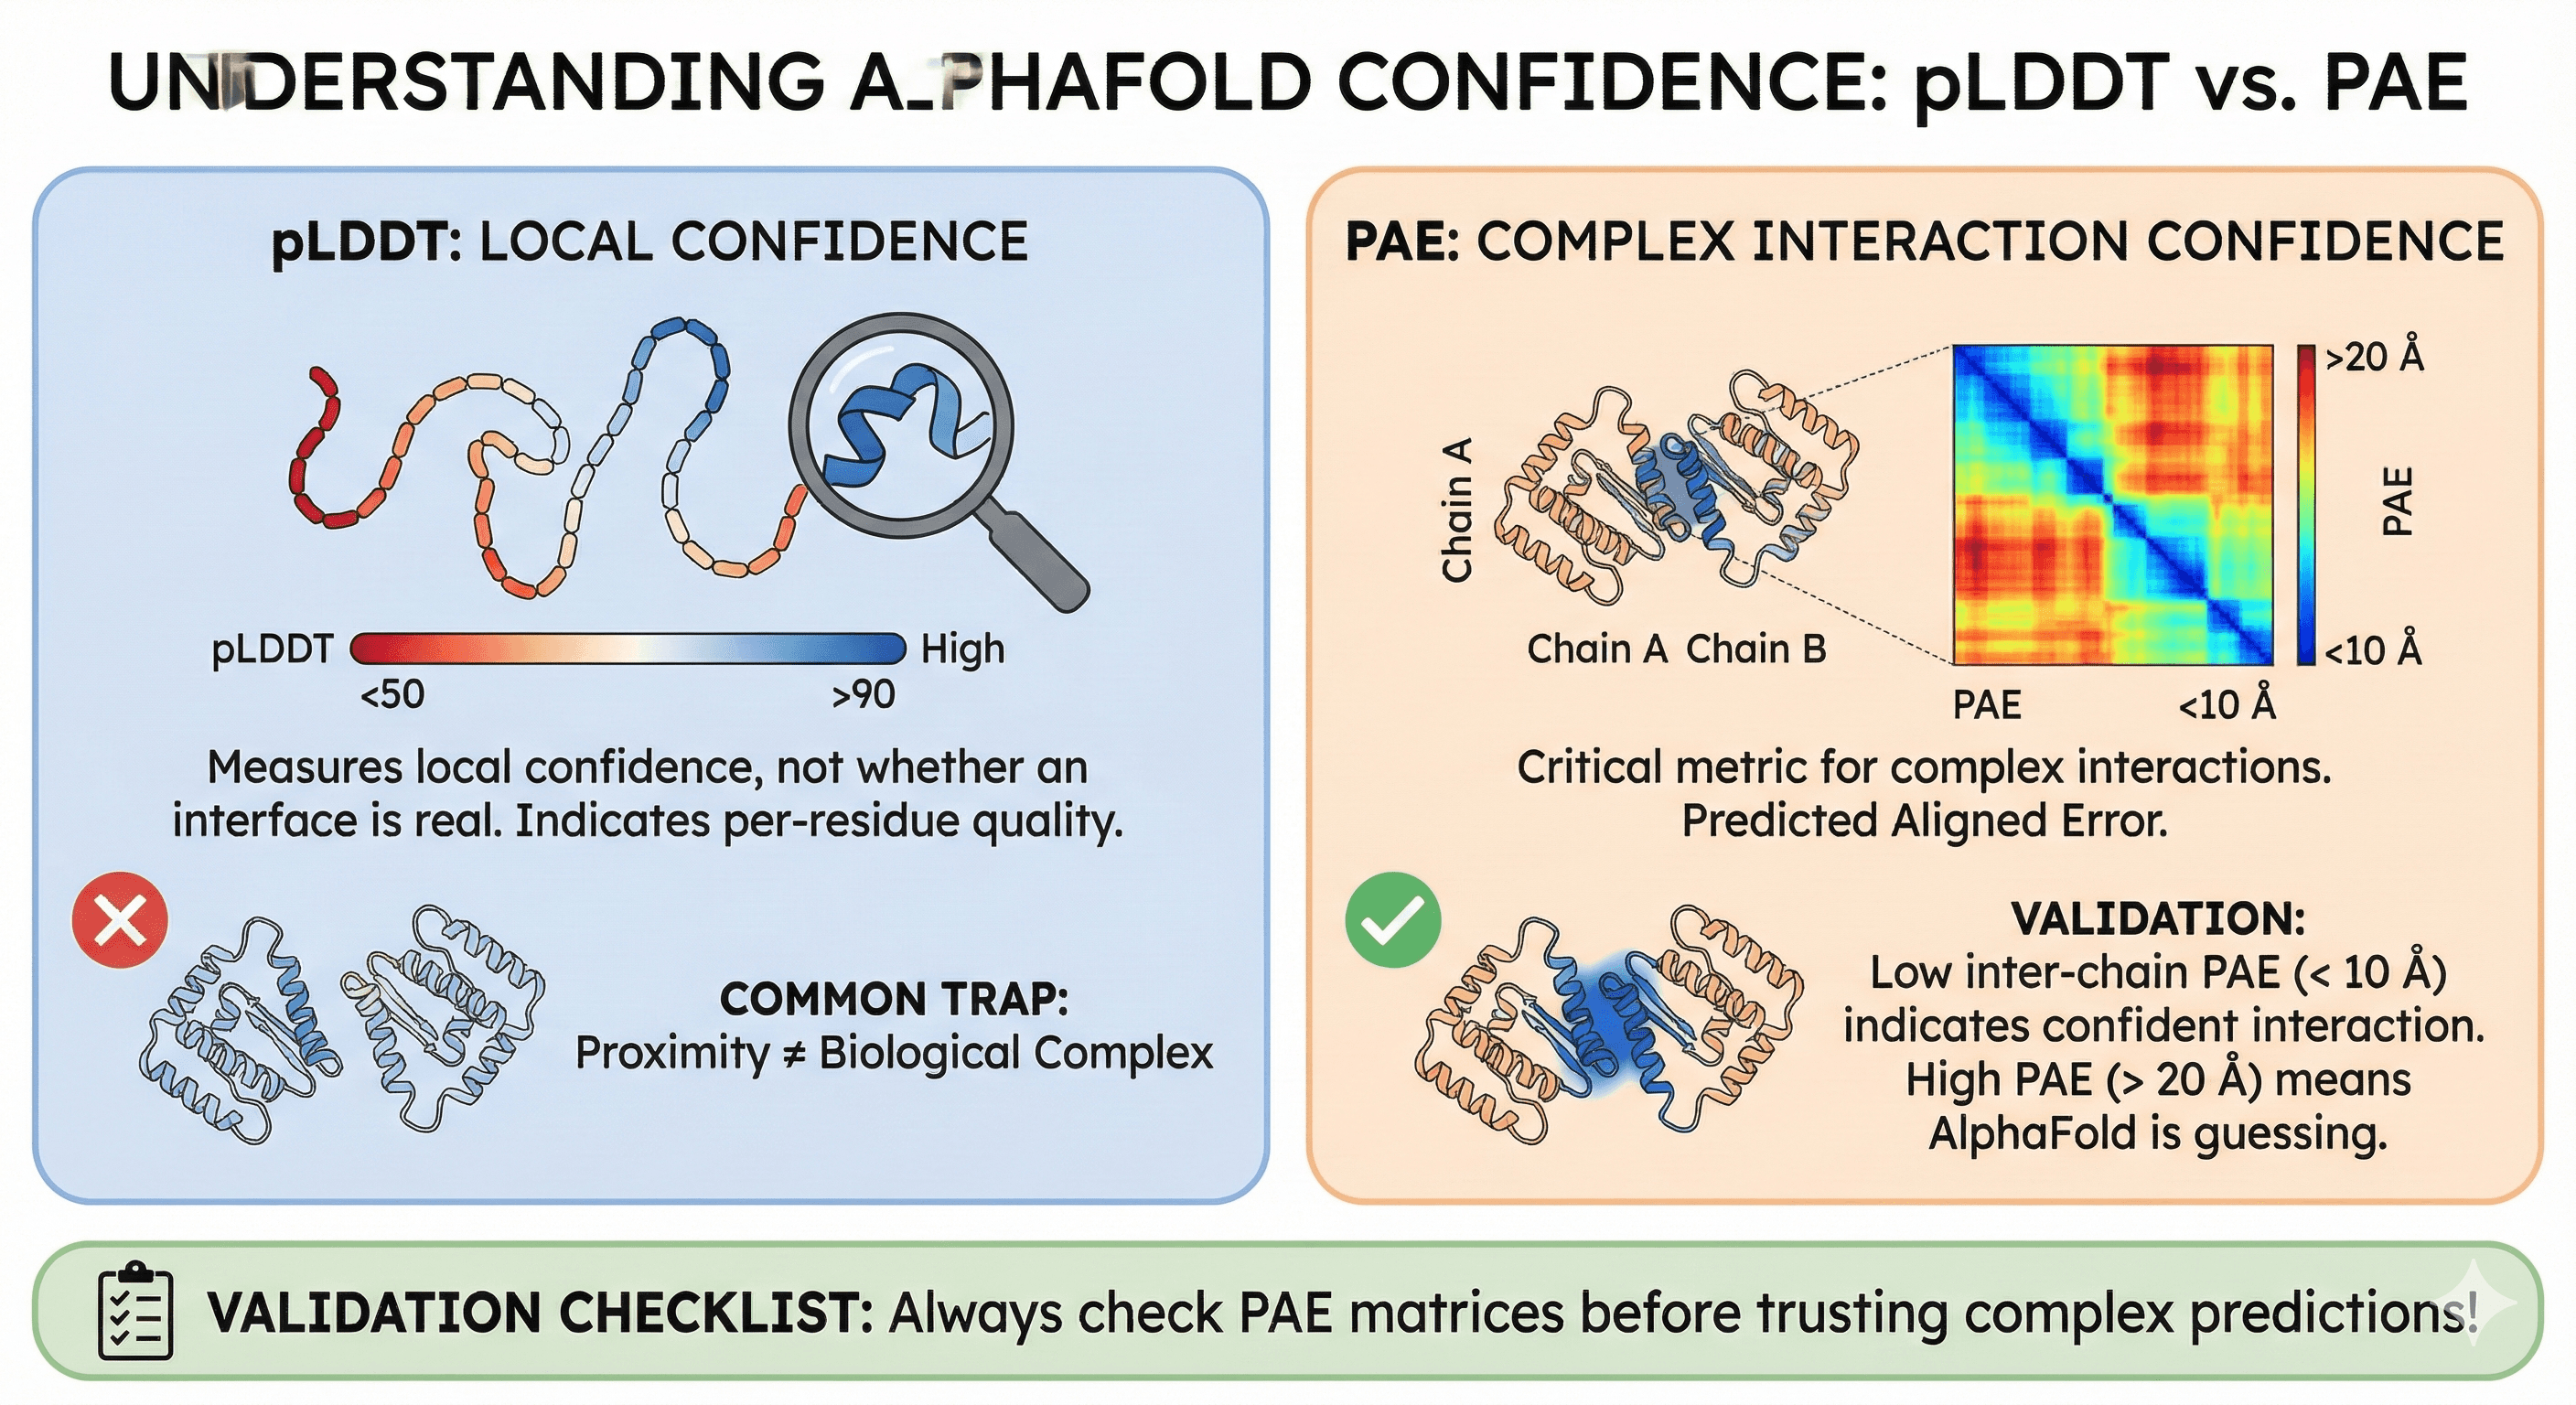
pLDDT measures local confidence, not whether an interface is real
PAE (Predicted Aligned Error) is the critical metric for complex interactions
Low inter-chain PAE (< 10 Å) indicates confident interaction; high PAE (> 20 Å) means AlphaFold is guessing
Common trap: Two well-folded chains placed near each other ≠ biological complex
Validation: Always check PAE matrices before trusting complex predictions
The Two Confidence Metrics: pLDDT vs PAE
AlphaFold reports two confidence metrics. For monomers, pLDDT is usually sufficient. For complexes, PAE becomes essential.
pLDDT: Per-Residue Confidence
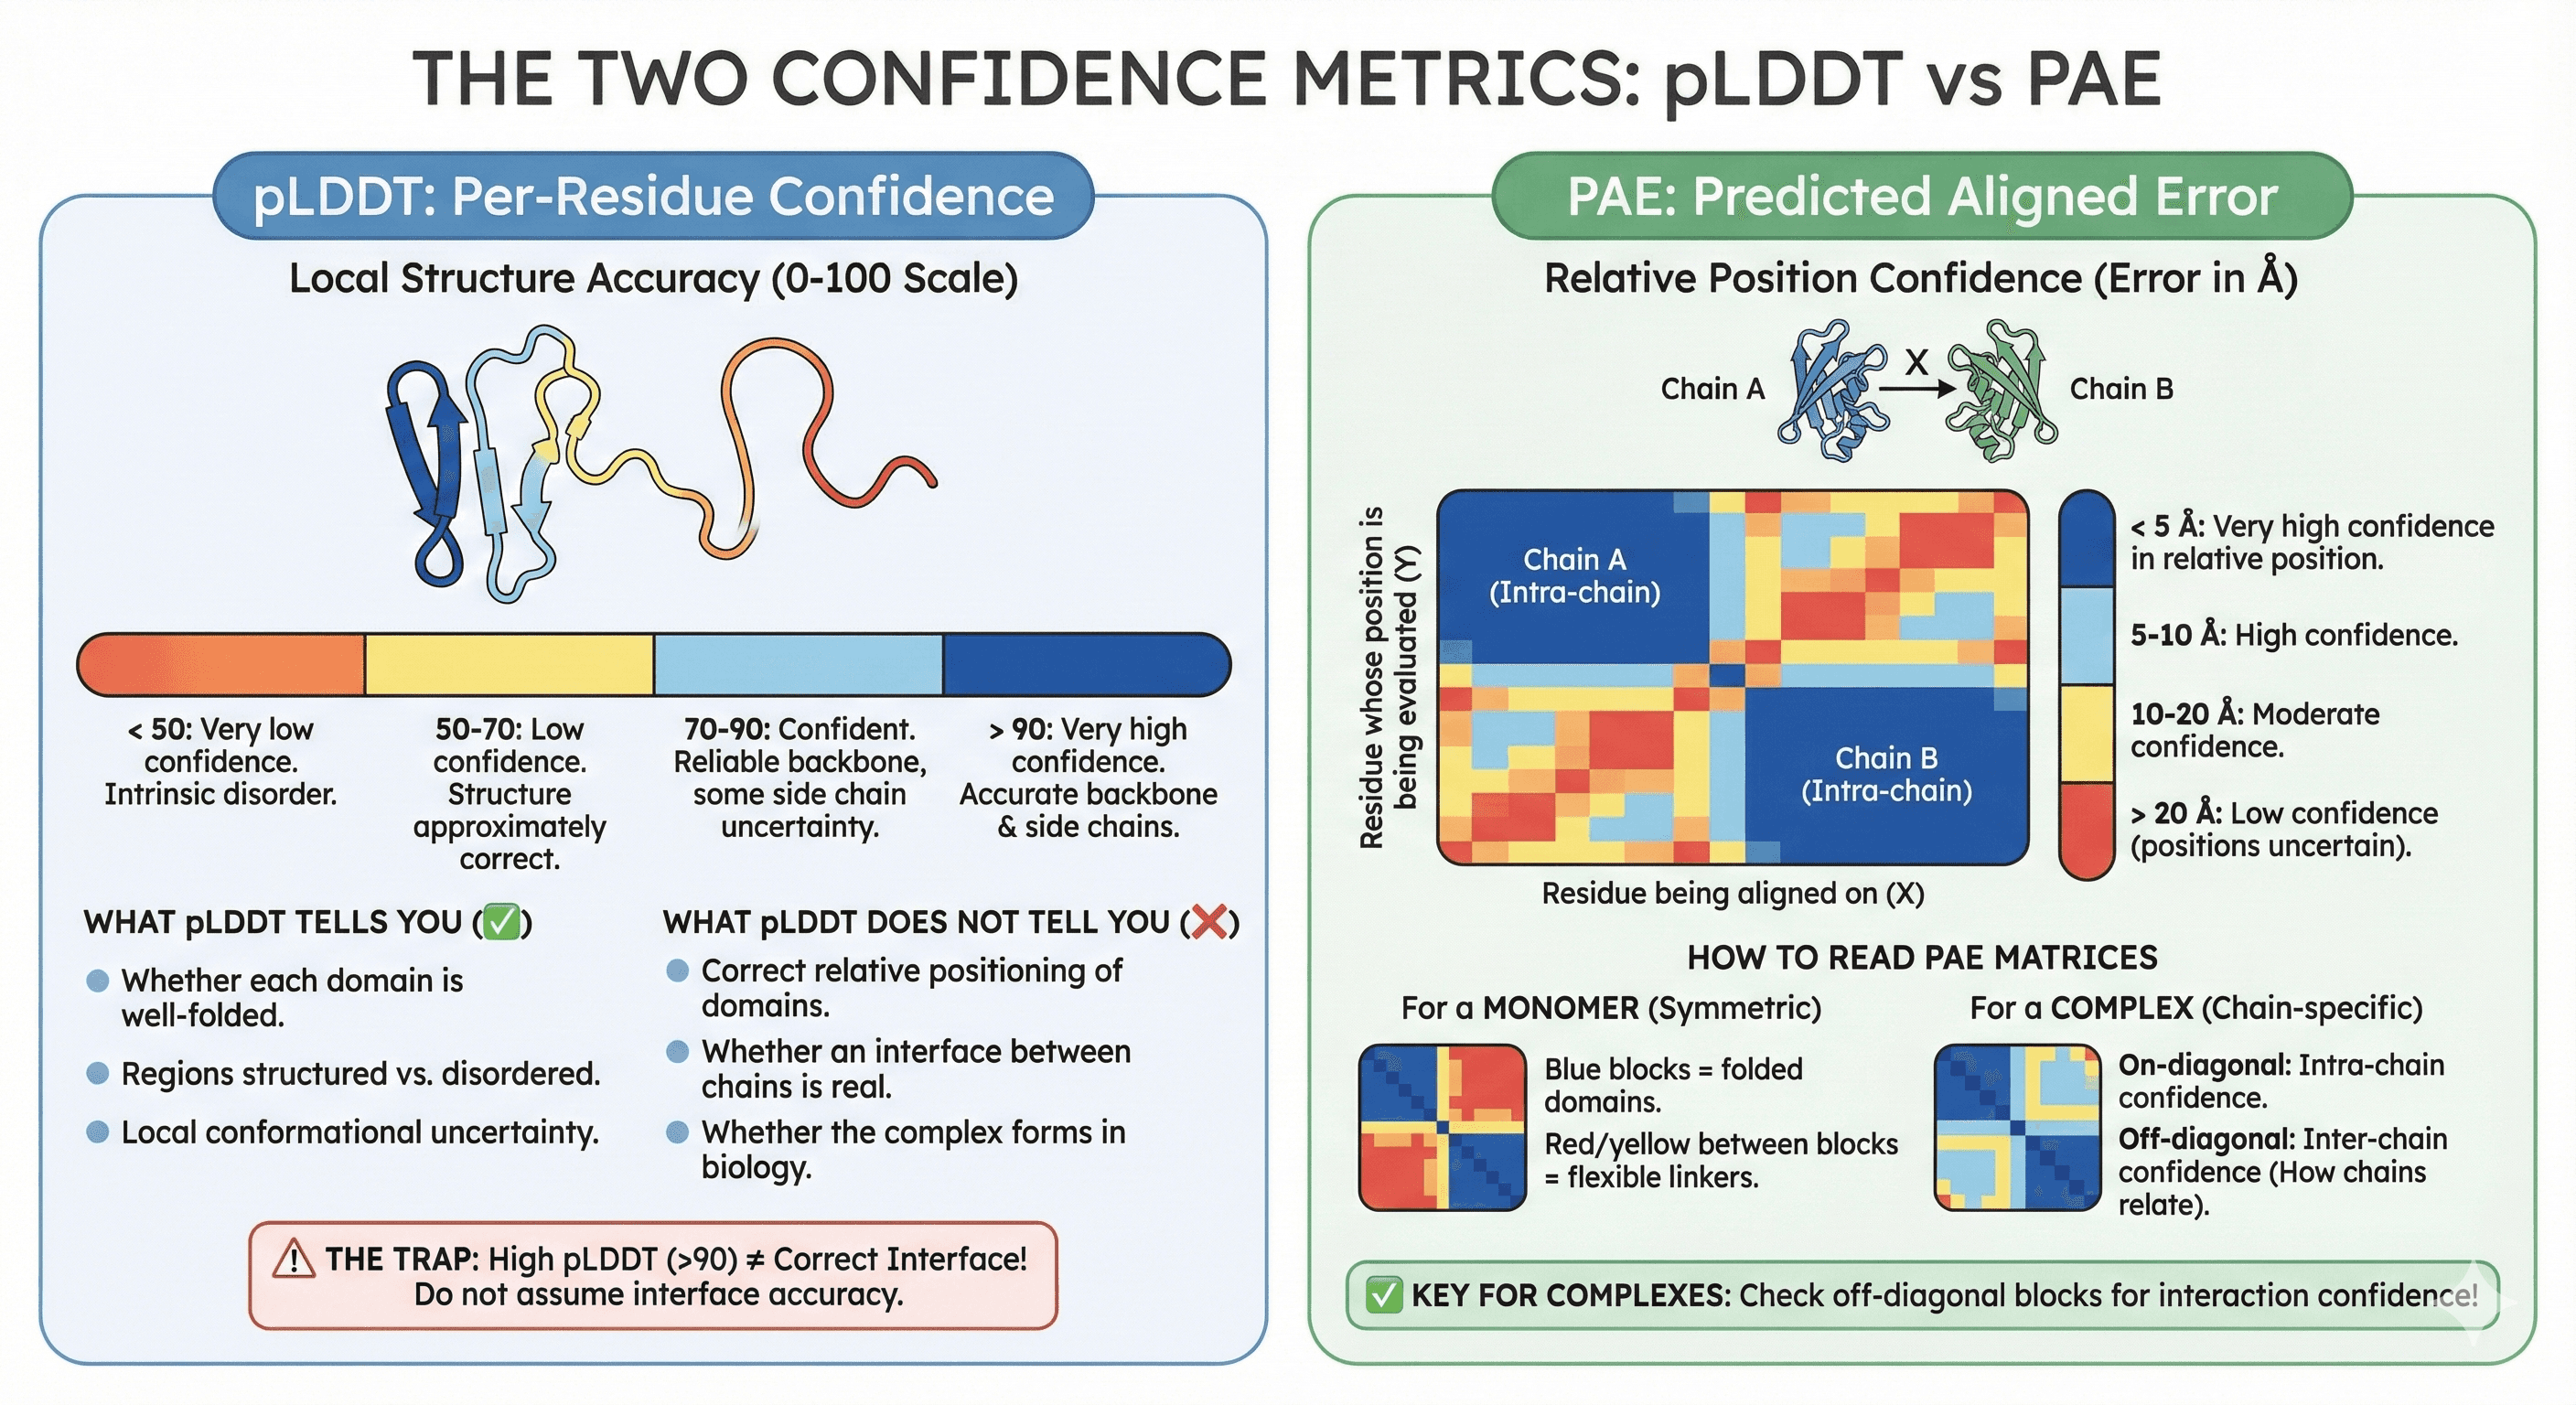
What it measures: How confident is AlphaFold in the local structure around each residue? The pLDDT (predicted Local Distance Difference Test) provides a per-residue confidence score on a scale from 0 to 100 (Jumper et al., 2021).
The scale (EBI AlphaFold Training):
> 90 (deep blue): Very high confidence. Backbone and side chains likely accurate.
70-90 (light blue): Confident. Backbone reliable, some side chain uncertainty.
50-70 (yellow): Low confidence. Structure may be approximately correct.
< 50 (orange/red): Very low confidence. Often indicates intrinsic disorder.
What pLDDT tells you:
Whether each domain is well-folded
Which regions are structured vs disordered
Where the model is uncertain about local conformation
What pLDDT does NOT tell you:
Whether two domains are correctly positioned relative to each other
Whether an interface between chains is real
Whether the complex actually forms in biology
The trap: A complex can have pLDDT > 90 everywhere and still be completely wrong about the interface.
PAE: Predicted Aligned Error
What it measures: The PAE (Predicted Aligned Error) provides confidence in the relative position of two residues—if you align the structure on residue X, how confident is AlphaFold about the position of residue Y? (Evans et al., 2022)
The scale:
< 5 Å: Very high confidence in relative positioning
5-10 Å: High confidence
10-20 Å: Moderate confidence
> 20 Å: Low confidence—positions are essentially uncertain
How to read PAE matrices:
The PAE is displayed as a heatmap where:
X-axis: Residue being aligned on (the "reference")
Y-axis: Residue whose position is being evaluated
Color: Expected error in position (blue = low error = confident)
For a monomer:
The matrix is symmetric
Well-folded domains show blue blocks along the diagonal
Flexible linkers between domains show high PAE (red/yellow) between the domain blocks
For a complex:
The matrix has blocks for each chain
On-diagonal blocks: Intra-chain confidence (each chain's internal structure)
Off-diagonal blocks: Inter-chain confidence (how chains relate to each other)
Reading PAE for Complexes: The Critical Skill
What a Real Interaction Looks Like
When AlphaFold confidently predicts that two chains interact:
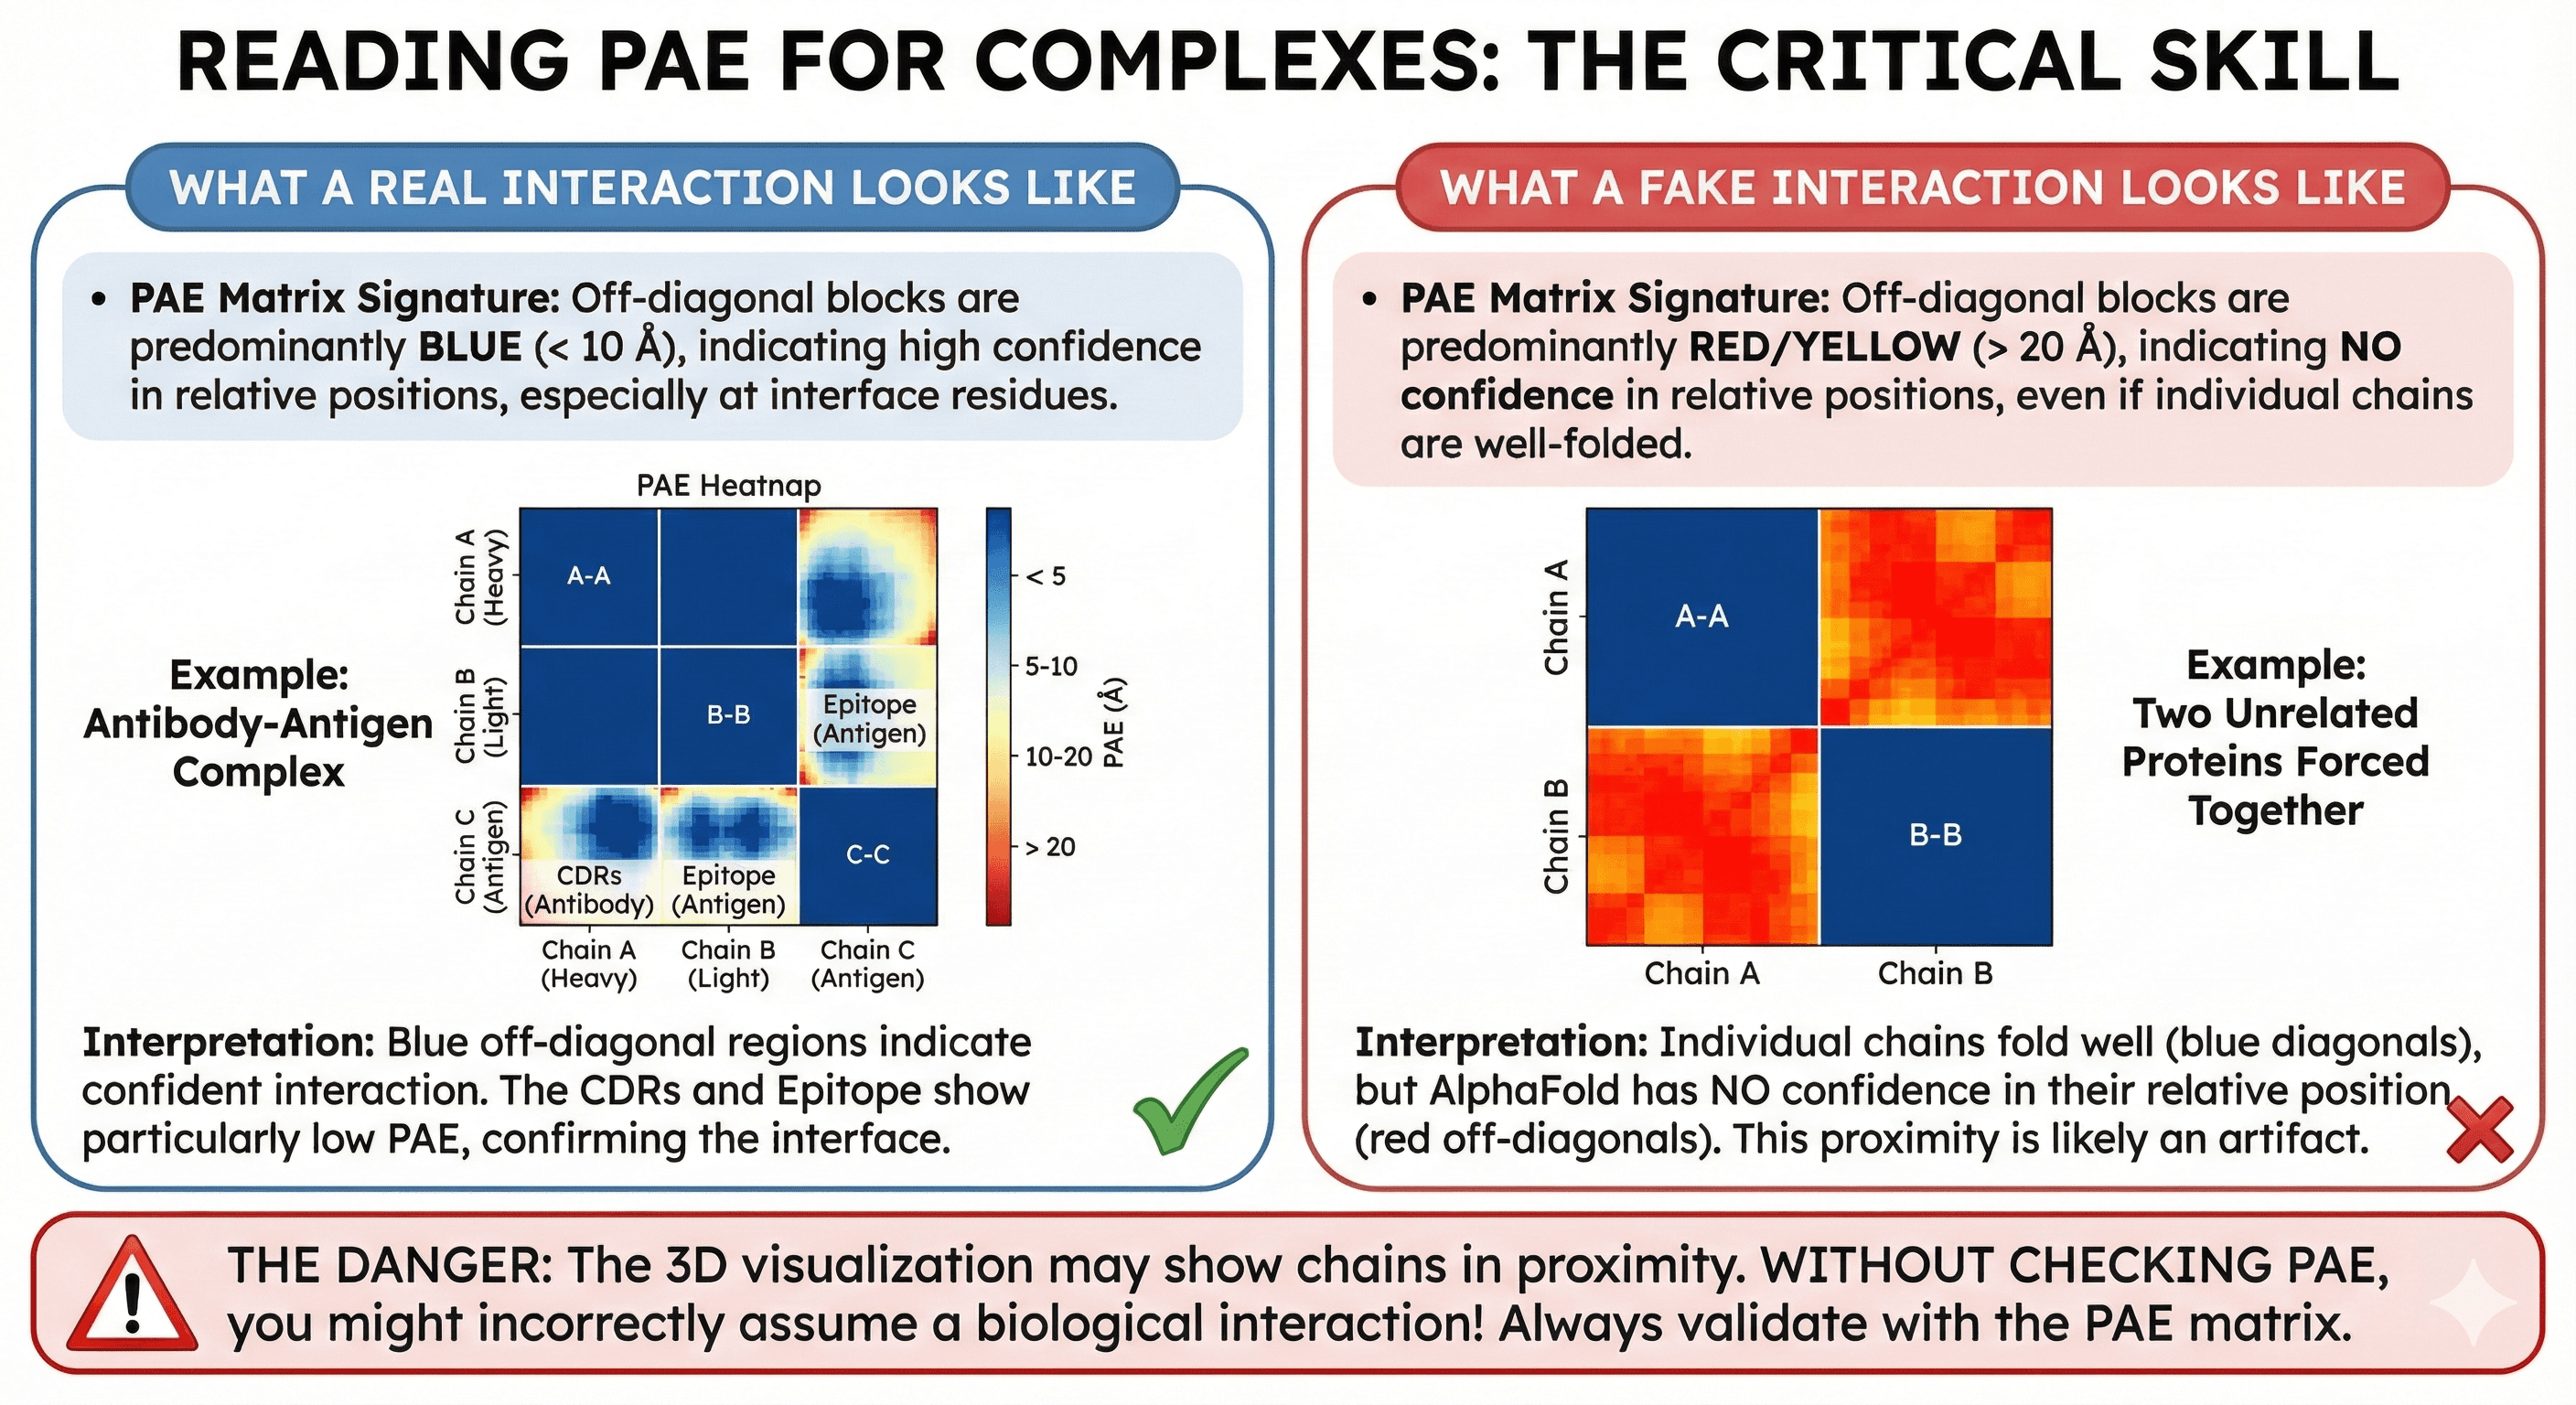
PAE matrix signature:
Off-diagonal blocks are predominantly blue (< 10 Å)
The pattern is often asymmetric but shows clear low-error regions
Interface residues show particularly low PAE to each other
Example: Antibody-Antigen Complex
The off-diagonal blue regions indicate where AlphaFold is confident about the interface. The CDRs of the antibody show low PAE to the epitope on the antigen.
What a Fake Interaction Looks Like
When AlphaFold doesn't have evolutionary evidence for an interaction, but places chains near each other anyway:
PAE matrix signature:
Off-diagonal blocks are predominantly red/yellow (> 20 Å)
Each chain's diagonal block may be blue (chains fold well individually)
But the inter-chain regions show no confidence
Example: Two Unrelated Proteins Forced Together
Both chains are well-folded (blue diagonals), but AlphaFold has no confidence in their relative positions (red off-diagonals). This complex is likely an artifact.
The danger: The 3D visualization still shows the chains in proximity. Without checking PAE, you might think they interact.
Common Misinterpretations (And How to Avoid Them)
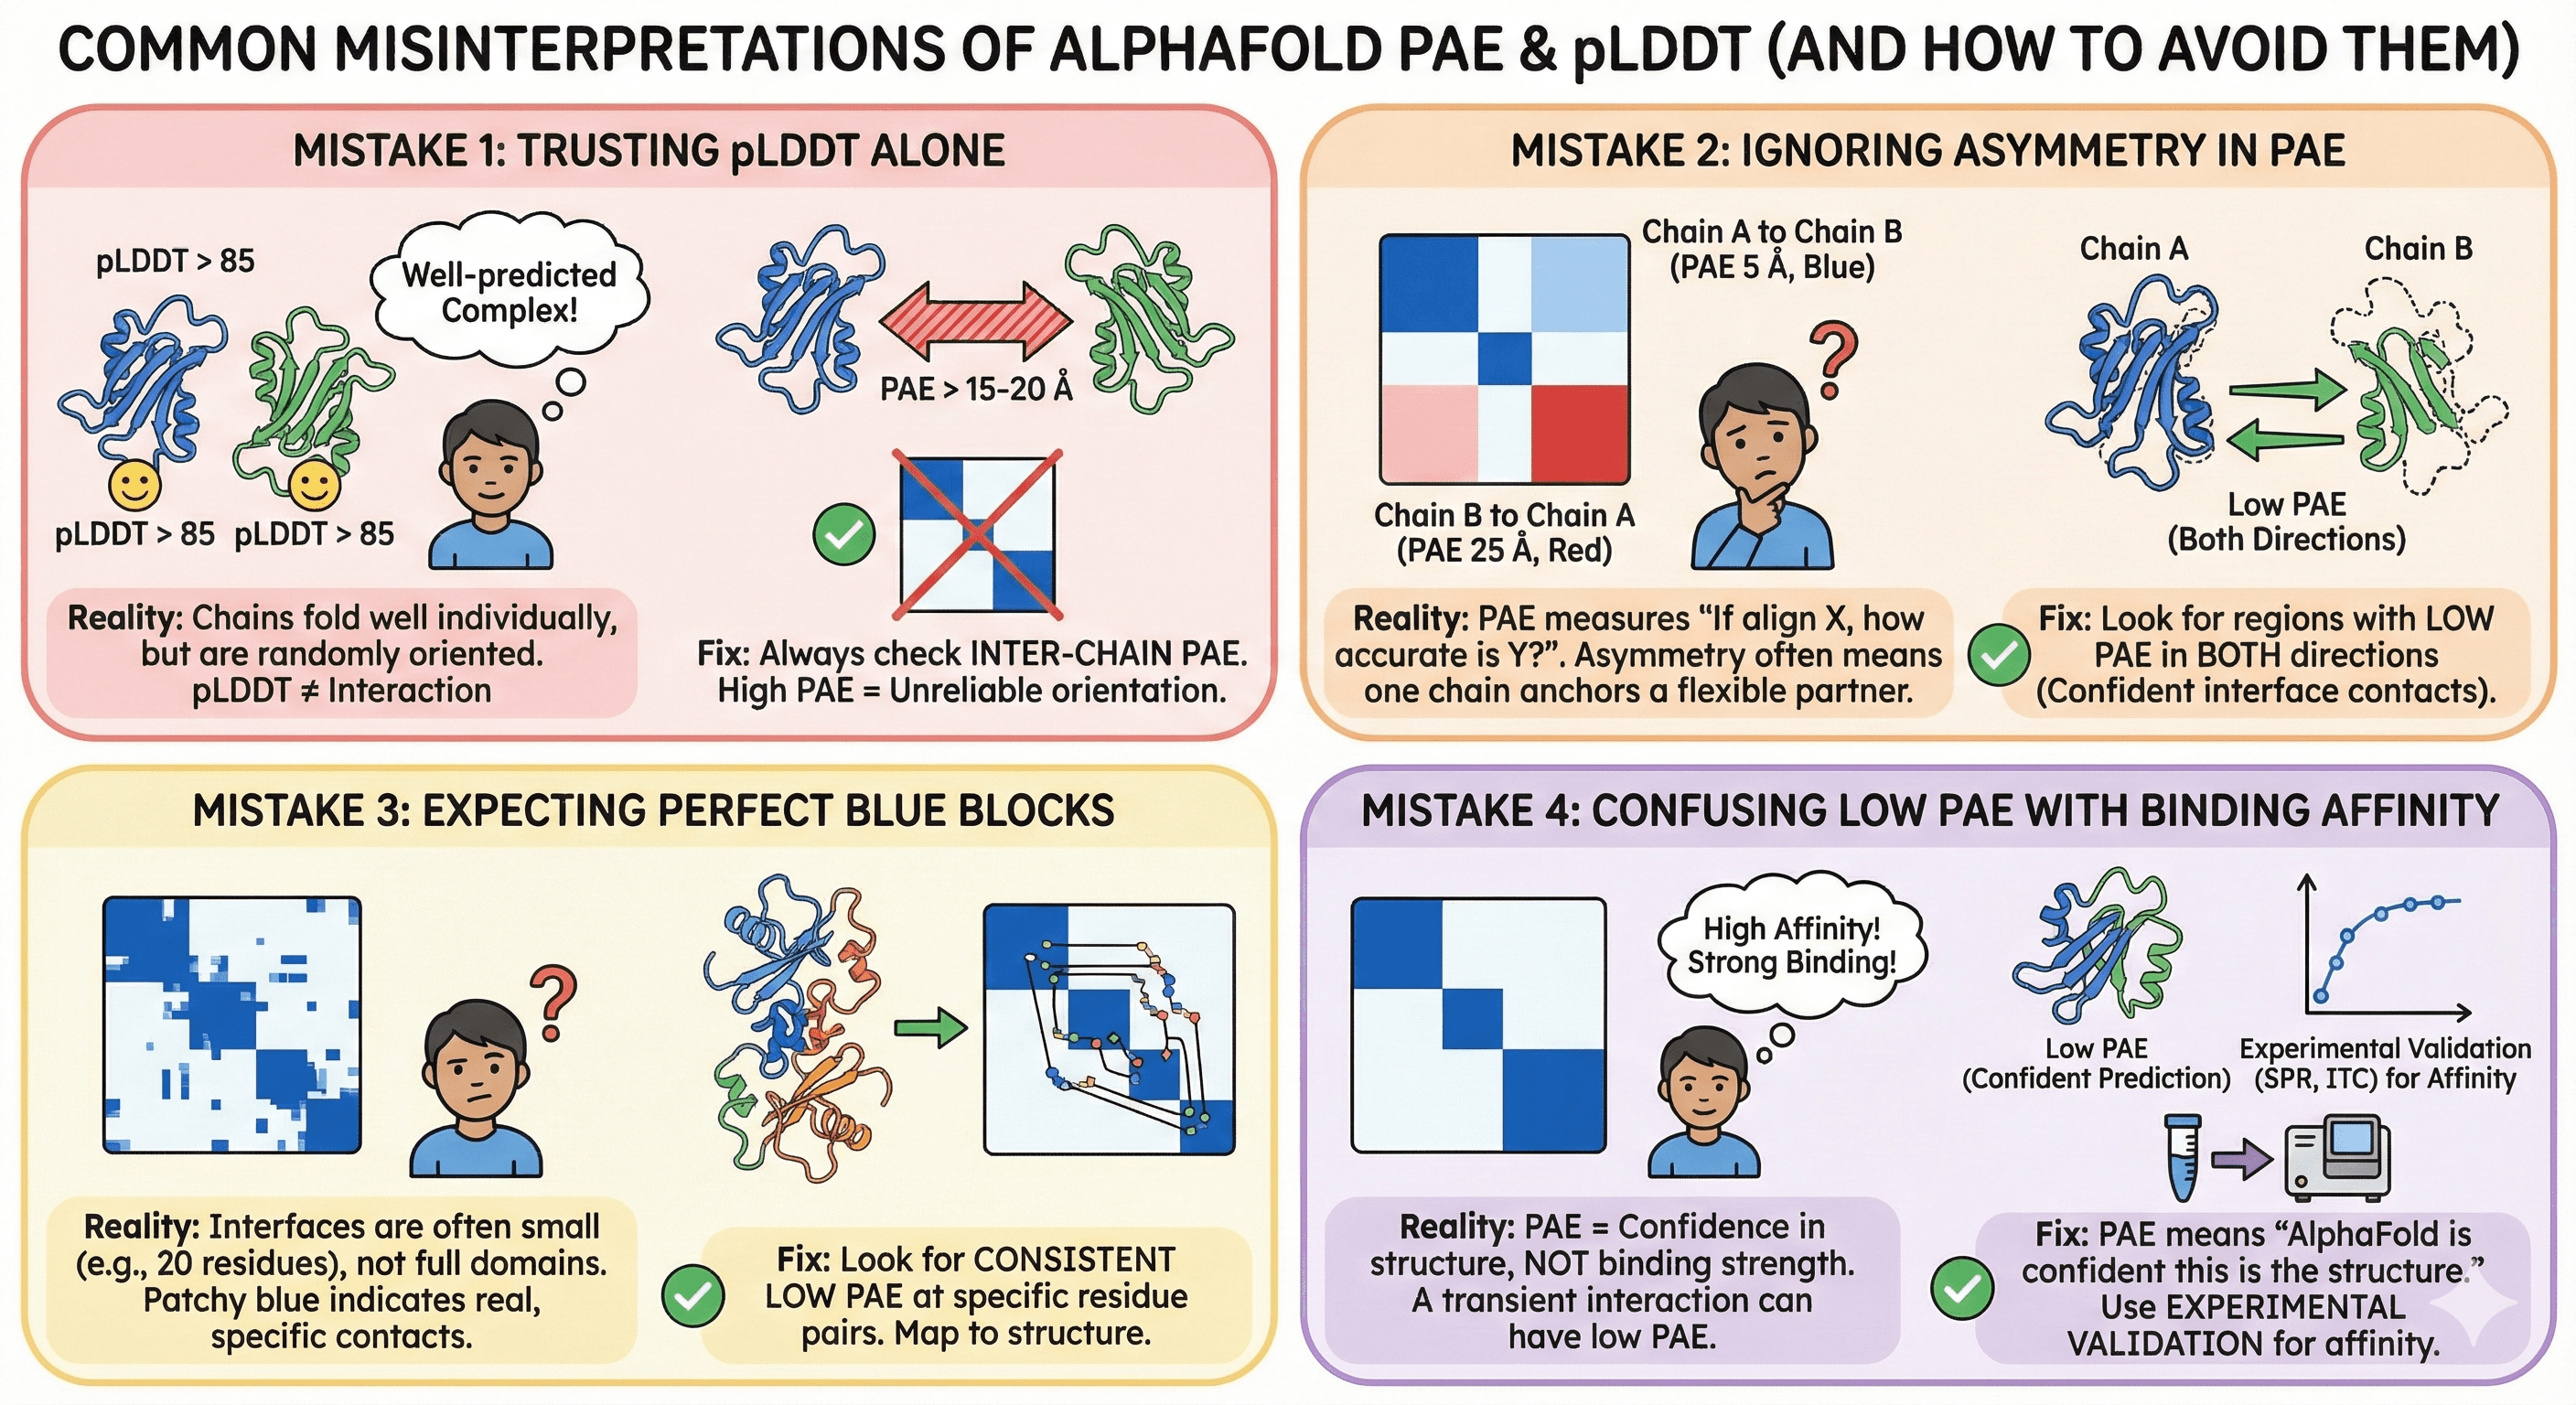
Mistake 1: Trusting pLDDT Alone
The scenario:
You predict a heterodimer
Both chains have pLDDT > 85
You conclude the complex is well-predicted
The reality:
High pLDDT means both chains fold well individually
It says nothing about whether they interact
The chains might be randomly oriented
The fix: Always check the inter-chain PAE. If it's > 15-20 Å, the relative orientation is not reliable.
Mistake 2: Ignoring Asymmetry in PAE
The scenario:
Chain A to Chain B PAE is low (5 Å)
Chain B to Chain A PAE is high (25 Å)
You're confused
What this means:
PAE measures: "If I align on X, how accurate is Y?"
Asymmetry often occurs when one chain is well-anchored and the other is flexible
The interaction might be real, but one partner has conformational flexibility
The fix: Look for regions where BOTH directions show low PAE. These are the confident interface contacts.
Mistake 3: Expecting Perfect Blue Blocks
The scenario:
Your complex shows patchy blue in the off-diagonal regions
It's not a clean block like within-chain regions
You're unsure if the interaction is real
The reality:
Interfaces are often smaller than full domains
A 20-residue interface will show a small blue patch, not a large block
Patchy blue at specific positions often indicates real contacts
The fix: Look for consistent low PAE at specific residue pairs, not overall blue blocks. Map these residues to the structure—they should be at the interface.
Mistake 4: Confusing Low PAE with Binding Affinity
The scenario:
Your complex shows beautiful low PAE at the interface
You conclude it's a high-affinity interaction
The reality:
PAE measures prediction confidence, not binding strength
A transient, low-affinity interaction can show low PAE if there's evolutionary evidence
A high-affinity interaction might show high PAE if it's novel or poorly represented in sequences
The fix: PAE tells you "AlphaFold is confident this is the structure." It doesn't tell you "this interaction is strong." Use experimental validation (SPR, ITC) for affinity.
The Interface Confidence Checklist
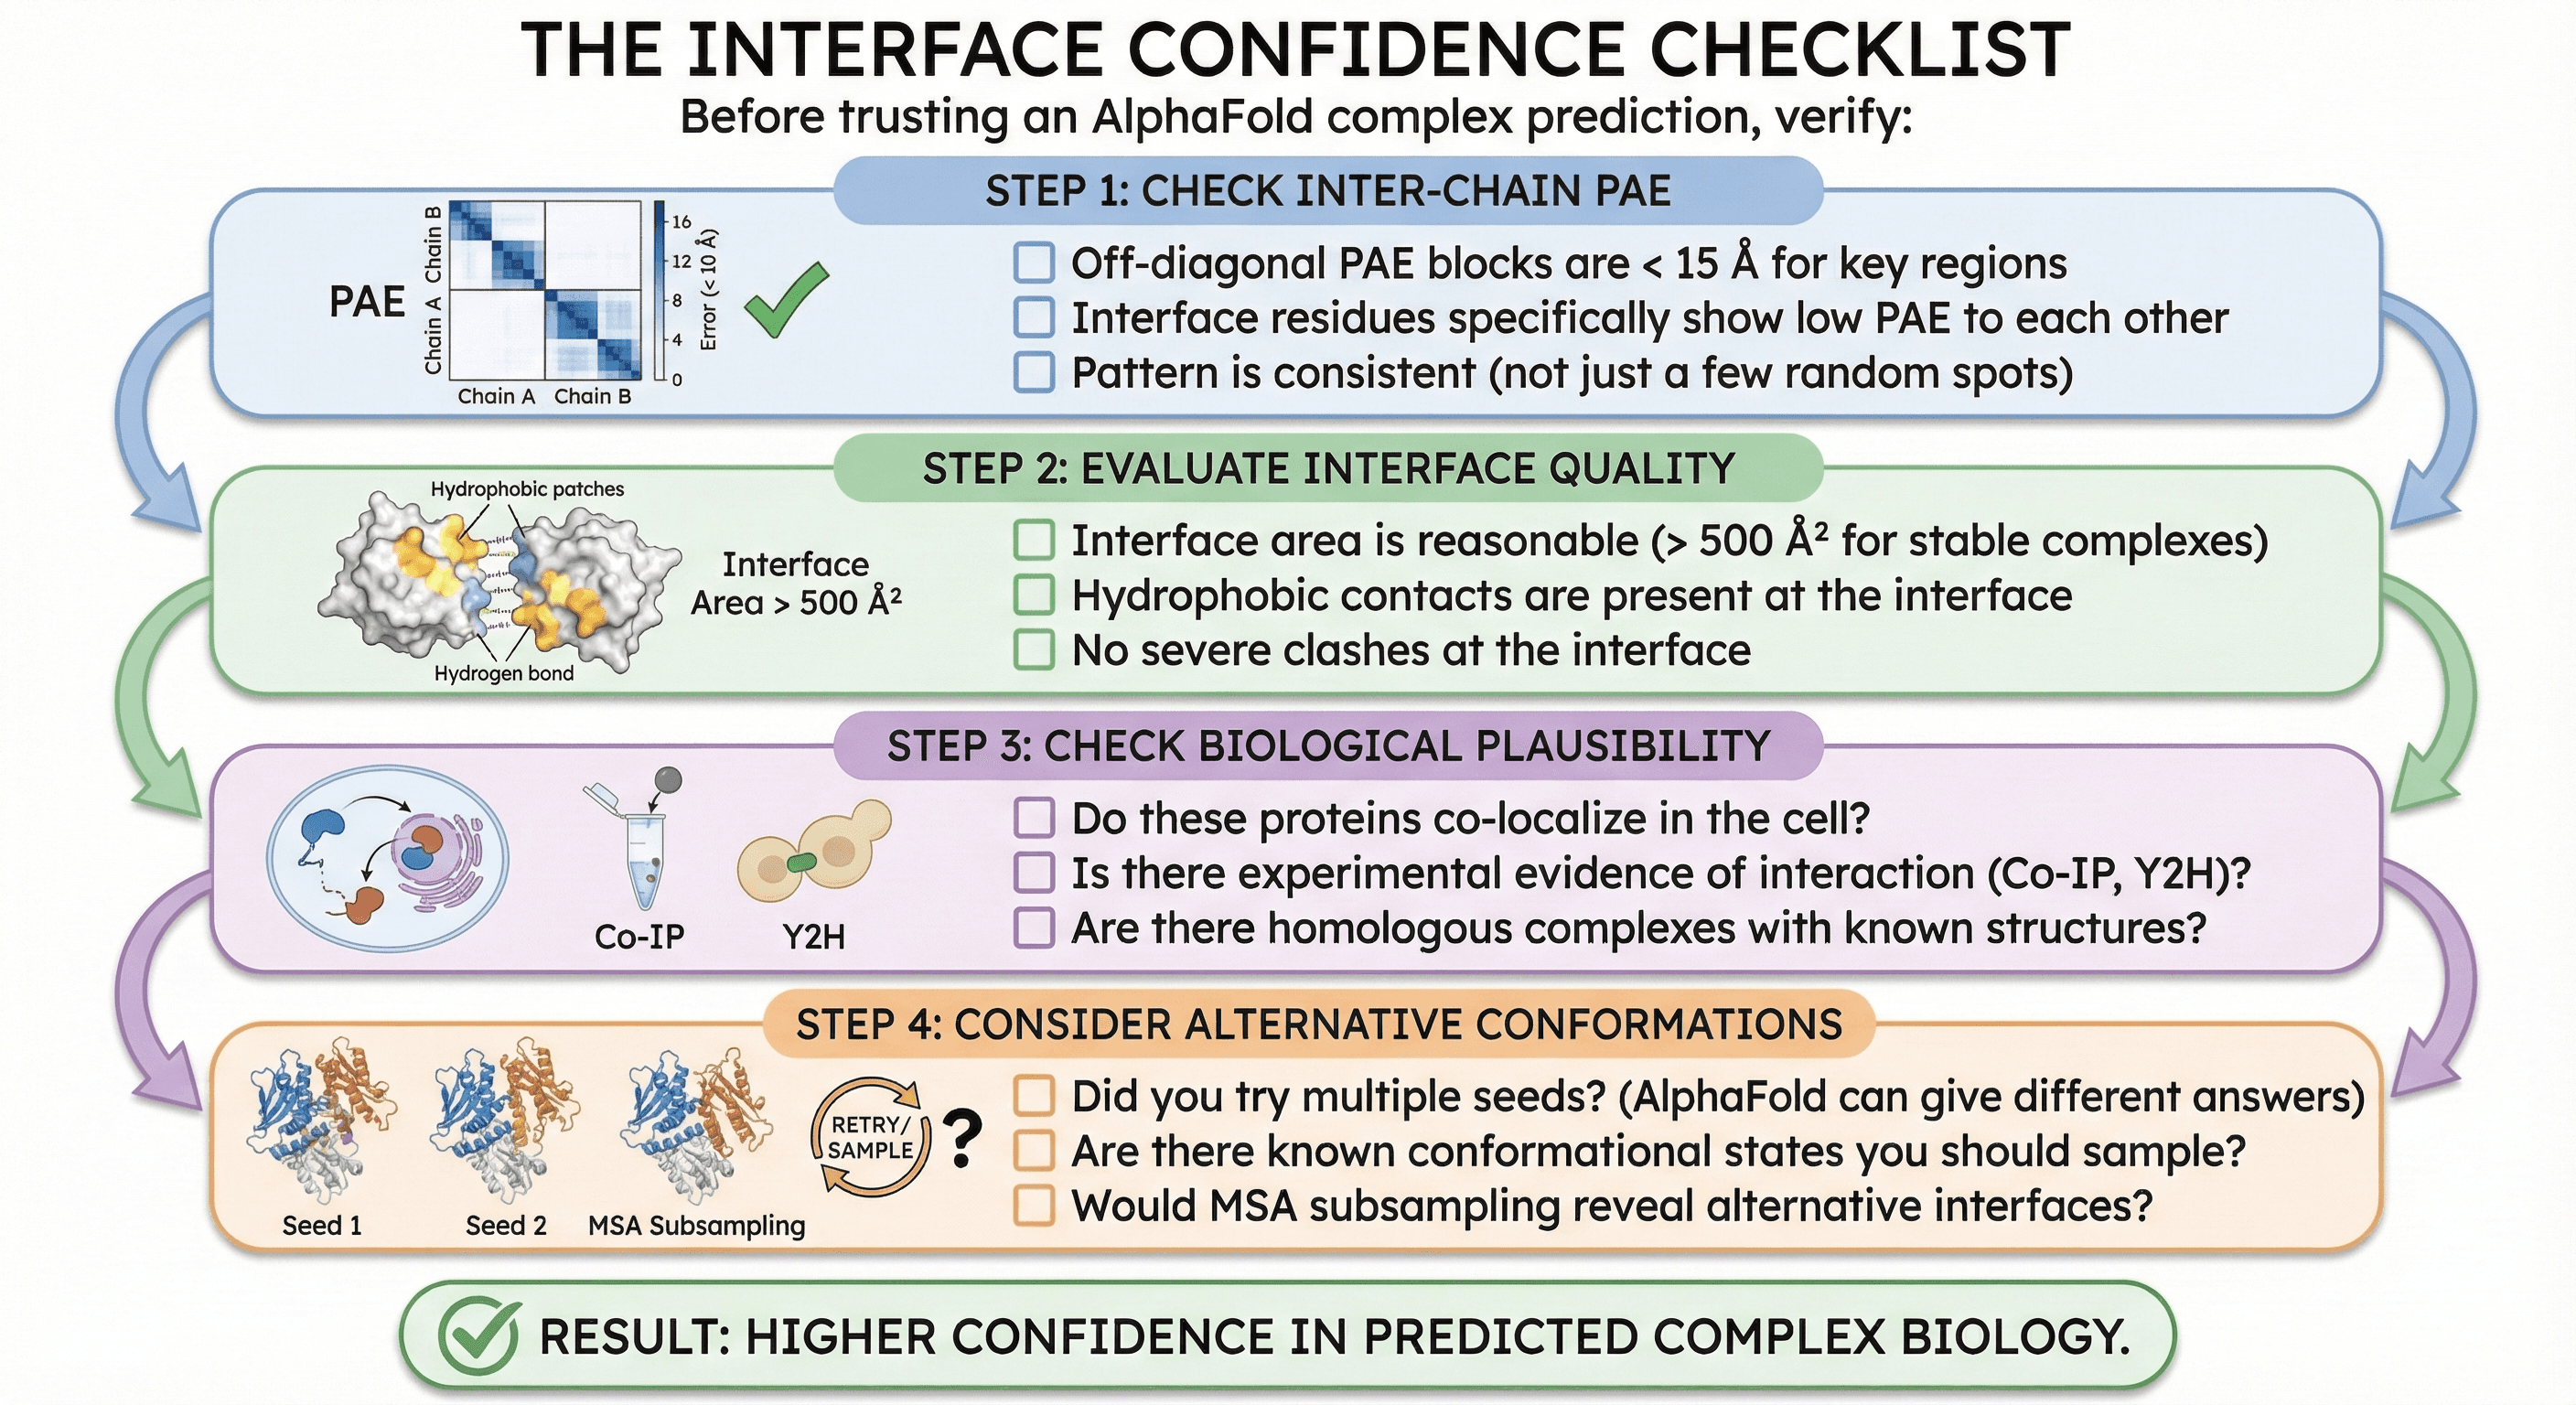
Before trusting an AlphaFold complex prediction, verify:
Step 1: Check Inter-Chain PAE
[ ] Off-diagonal PAE blocks are < 15 Å for key regions
[ ] Interface residues specifically show low PAE to each other
[ ] Pattern is consistent (not just a few random low-PAE spots)
Step 2: Evaluate Interface Quality
[ ] Interface area is reasonable (> 500 Ų for stable complexes)
[ ] Hydrophobic contacts are present at the interface
[ ] No severe clashes at the interface
Step 3: Check Biological Plausibility
[ ] Do these proteins co-localize in the cell?
[ ] Is there experimental evidence of interaction (Co-IP, yeast two-hybrid)?
[ ] Are there homologous complexes with known structures?
Step 4: Consider Alternative Conformations
[ ] Did you try multiple seeds? (AlphaFold can give different answers)
[ ] Are there known conformational states you should sample?
[ ] Would MSA subsampling reveal alternative interfaces?
Quantifying Interface Confidence
Beyond visual inspection, you can quantify interface confidence:
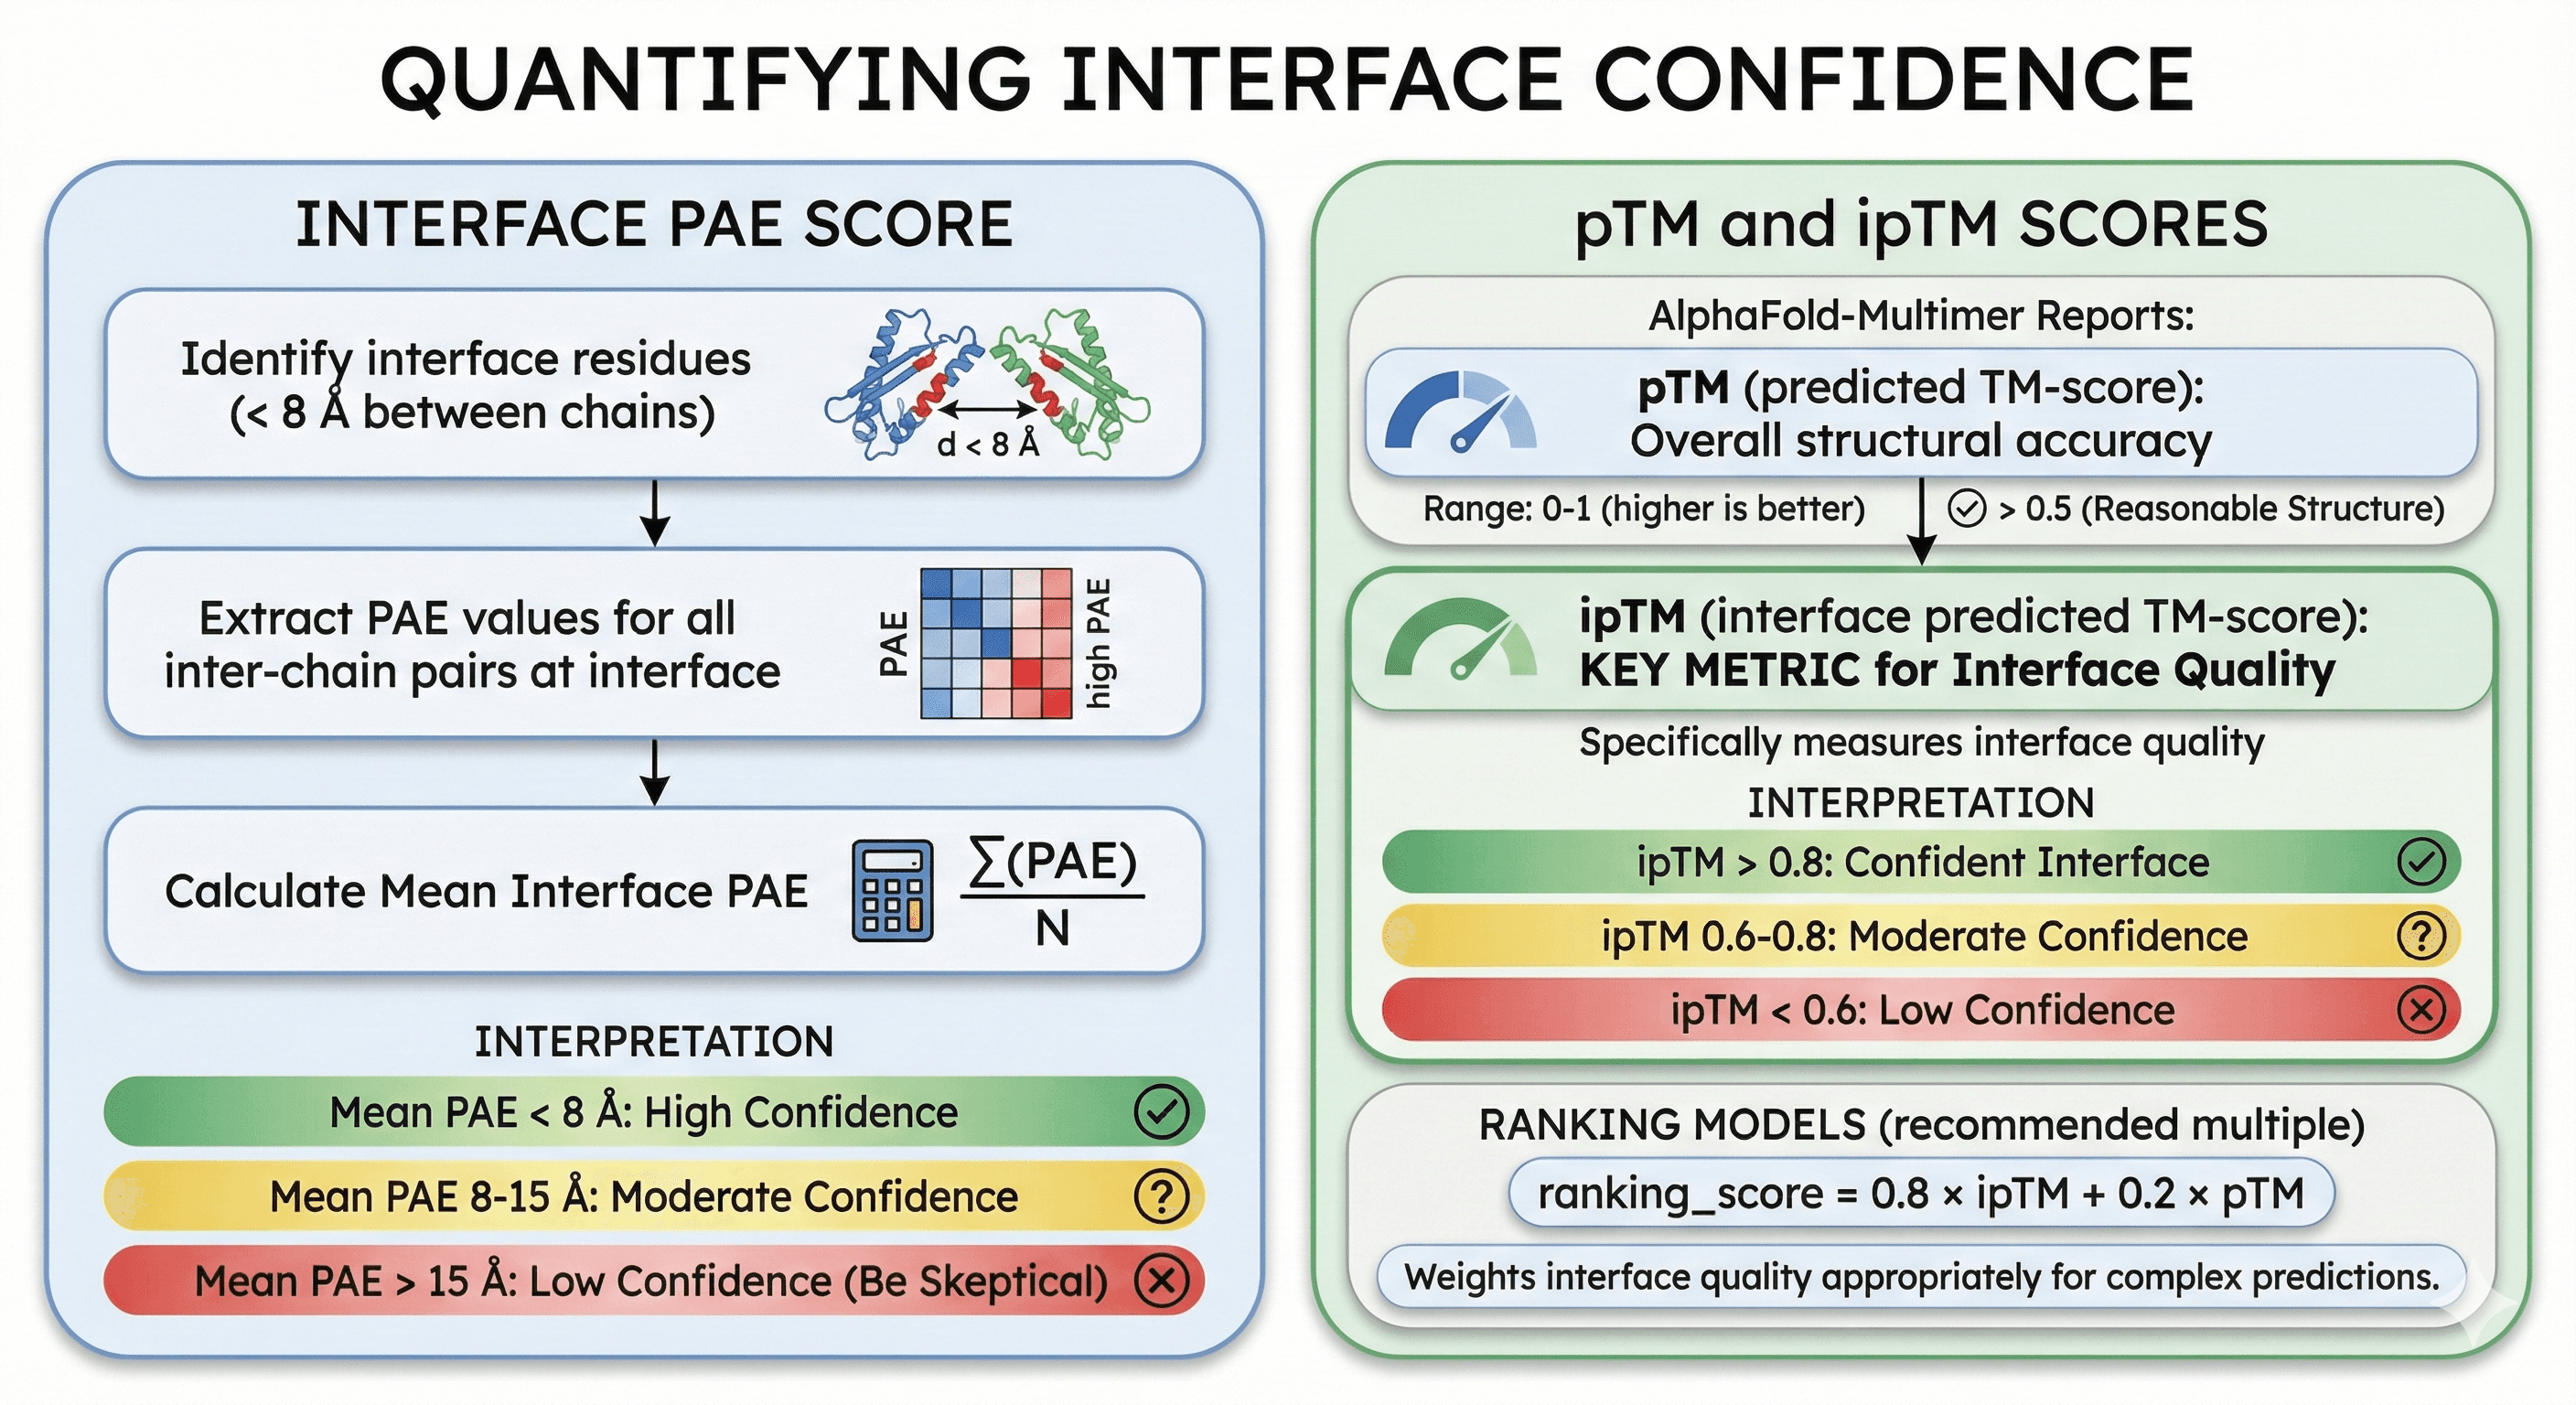
Interface PAE Score
Calculate the mean PAE for all residue pairs at the interface:
Identify interface residues (< 8 Å between chains)
Extract PAE values for all inter-chain pairs at interface
Calculate mean
Interpretation:
Mean interface PAE < 8 Å: High confidence interface
Mean interface PAE 8-15 Å: Moderate confidence
Mean interface PAE > 15 Å: Low confidence—be skeptical
pTM and ipTM Scores
AlphaFold-Multimer reports:
pTM (predicted TM-score):
Overall structural accuracy metric
Range: 0-1 (higher is better)
pTM > 0.5 suggests reasonable overall structure
ipTM (interface predicted TM-score) (Bryant et al., 2022):
Specifically measures interface quality
This is the key metric for complexes
ipTM > 0.8: Confident interface
ipTM 0.6-0.8: Moderate confidence
ipTM < 0.6: Low confidence
Ranking models: If you generate multiple models (recommended), rank by:
This weights interface quality appropriately for complex predictions.
Case Study: The Deceptive Dimer
The Setup
A research group wanted to understand how two signaling proteins interact. They:
Ran AlphaFold-Multimer with both sequences
Got a beautiful dimer structure
Observed pLDDT > 85 across both chains
Saw the proteins "touching" in the 3D view
Designed mutations at the putative interface
Spent 6 months making and testing mutants
The Result
None of the mutations disrupted the interaction in biochemical assays. The proteins still co-immunoprecipitated. Pull-downs still worked.
What Went Wrong
When they finally checked the PAE matrix:
Chain A internal: PAE < 5 Å (blue)
Chain B internal: PAE < 5 Å (blue)
Chain A to Chain B: PAE > 25 Å (red)
Chain B to Chain A: PAE > 25 Å (red)
AlphaFold was confident about each protein individually, but had no idea how they interacted. The dimer structure was essentially random—AlphaFold placed two well-folded proteins near each other, but the interface was imaginary.
The Lesson
The "interface" mutations weren't at the real interface. They were at a computationally-generated artifact. The real interface was elsewhere entirely—and required experimental structure determination to identify.
Time lost: 6 months of mutagenesis and biochemistry How to prevent: 10 minutes checking the PAE matrix
When Can You Trust Complex Predictions?
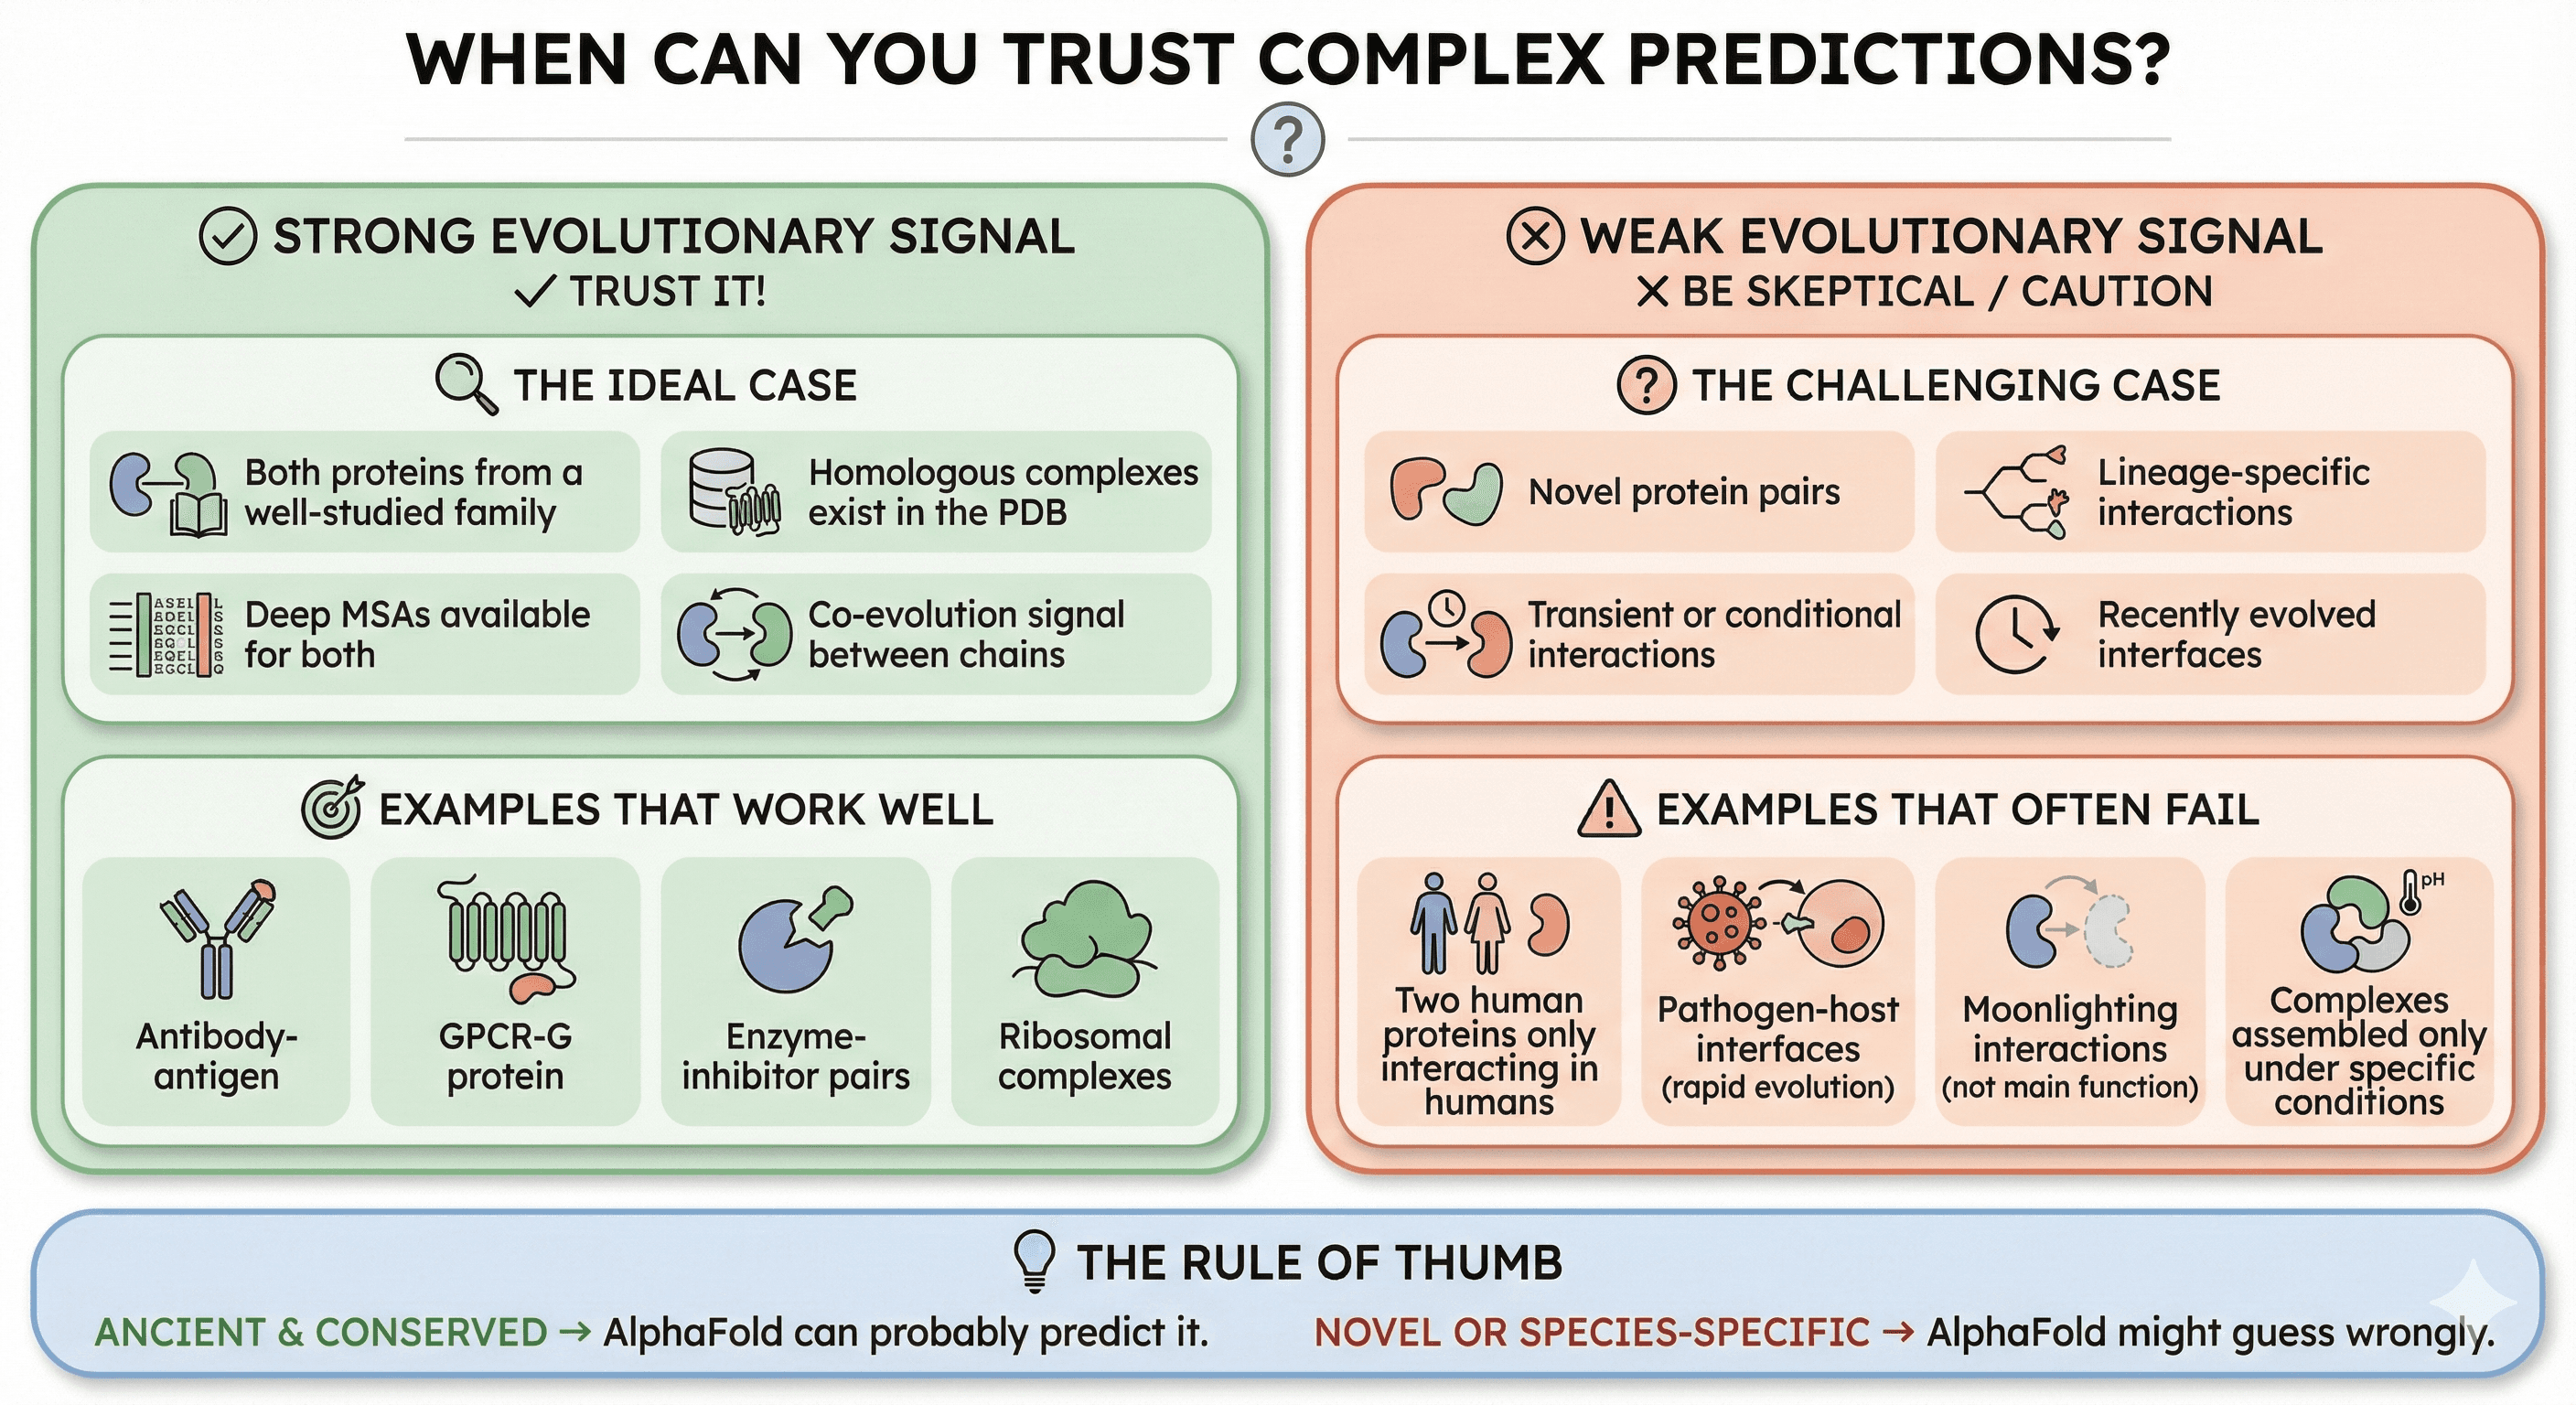
AlphaFold-Multimer works best when:
Strong Evolutionary Signal
The ideal case:
Both proteins are from a well-studied family
Homologous complexes exist in the PDB
Deep MSAs are available for both proteins
Co-evolution signal exists between chains
Examples that work well:
Antibody-antigen (many structures available)
GPCR-G protein (conserved interface)
Enzyme-inhibitor pairs (co-evolved)
Ribosomal complexes (extremely conserved)
Weak Evolutionary Signal
The challenging case:
Novel protein pairs
Lineage-specific interactions
Transient or conditional interactions
Recently evolved interfaces
Examples that often fail:
Two human proteins that only interact in humans
Pathogen-host interfaces (rapid evolution)
Moonlighting interactions (not the "main" function)
Complexes assembled only under specific conditions
The Rule of Thumb
If the interaction is:
Ancient and conserved → AlphaFold can probably predict it
Novel or species-specific → AlphaFold might guess wrongly
Improving Complex Predictions
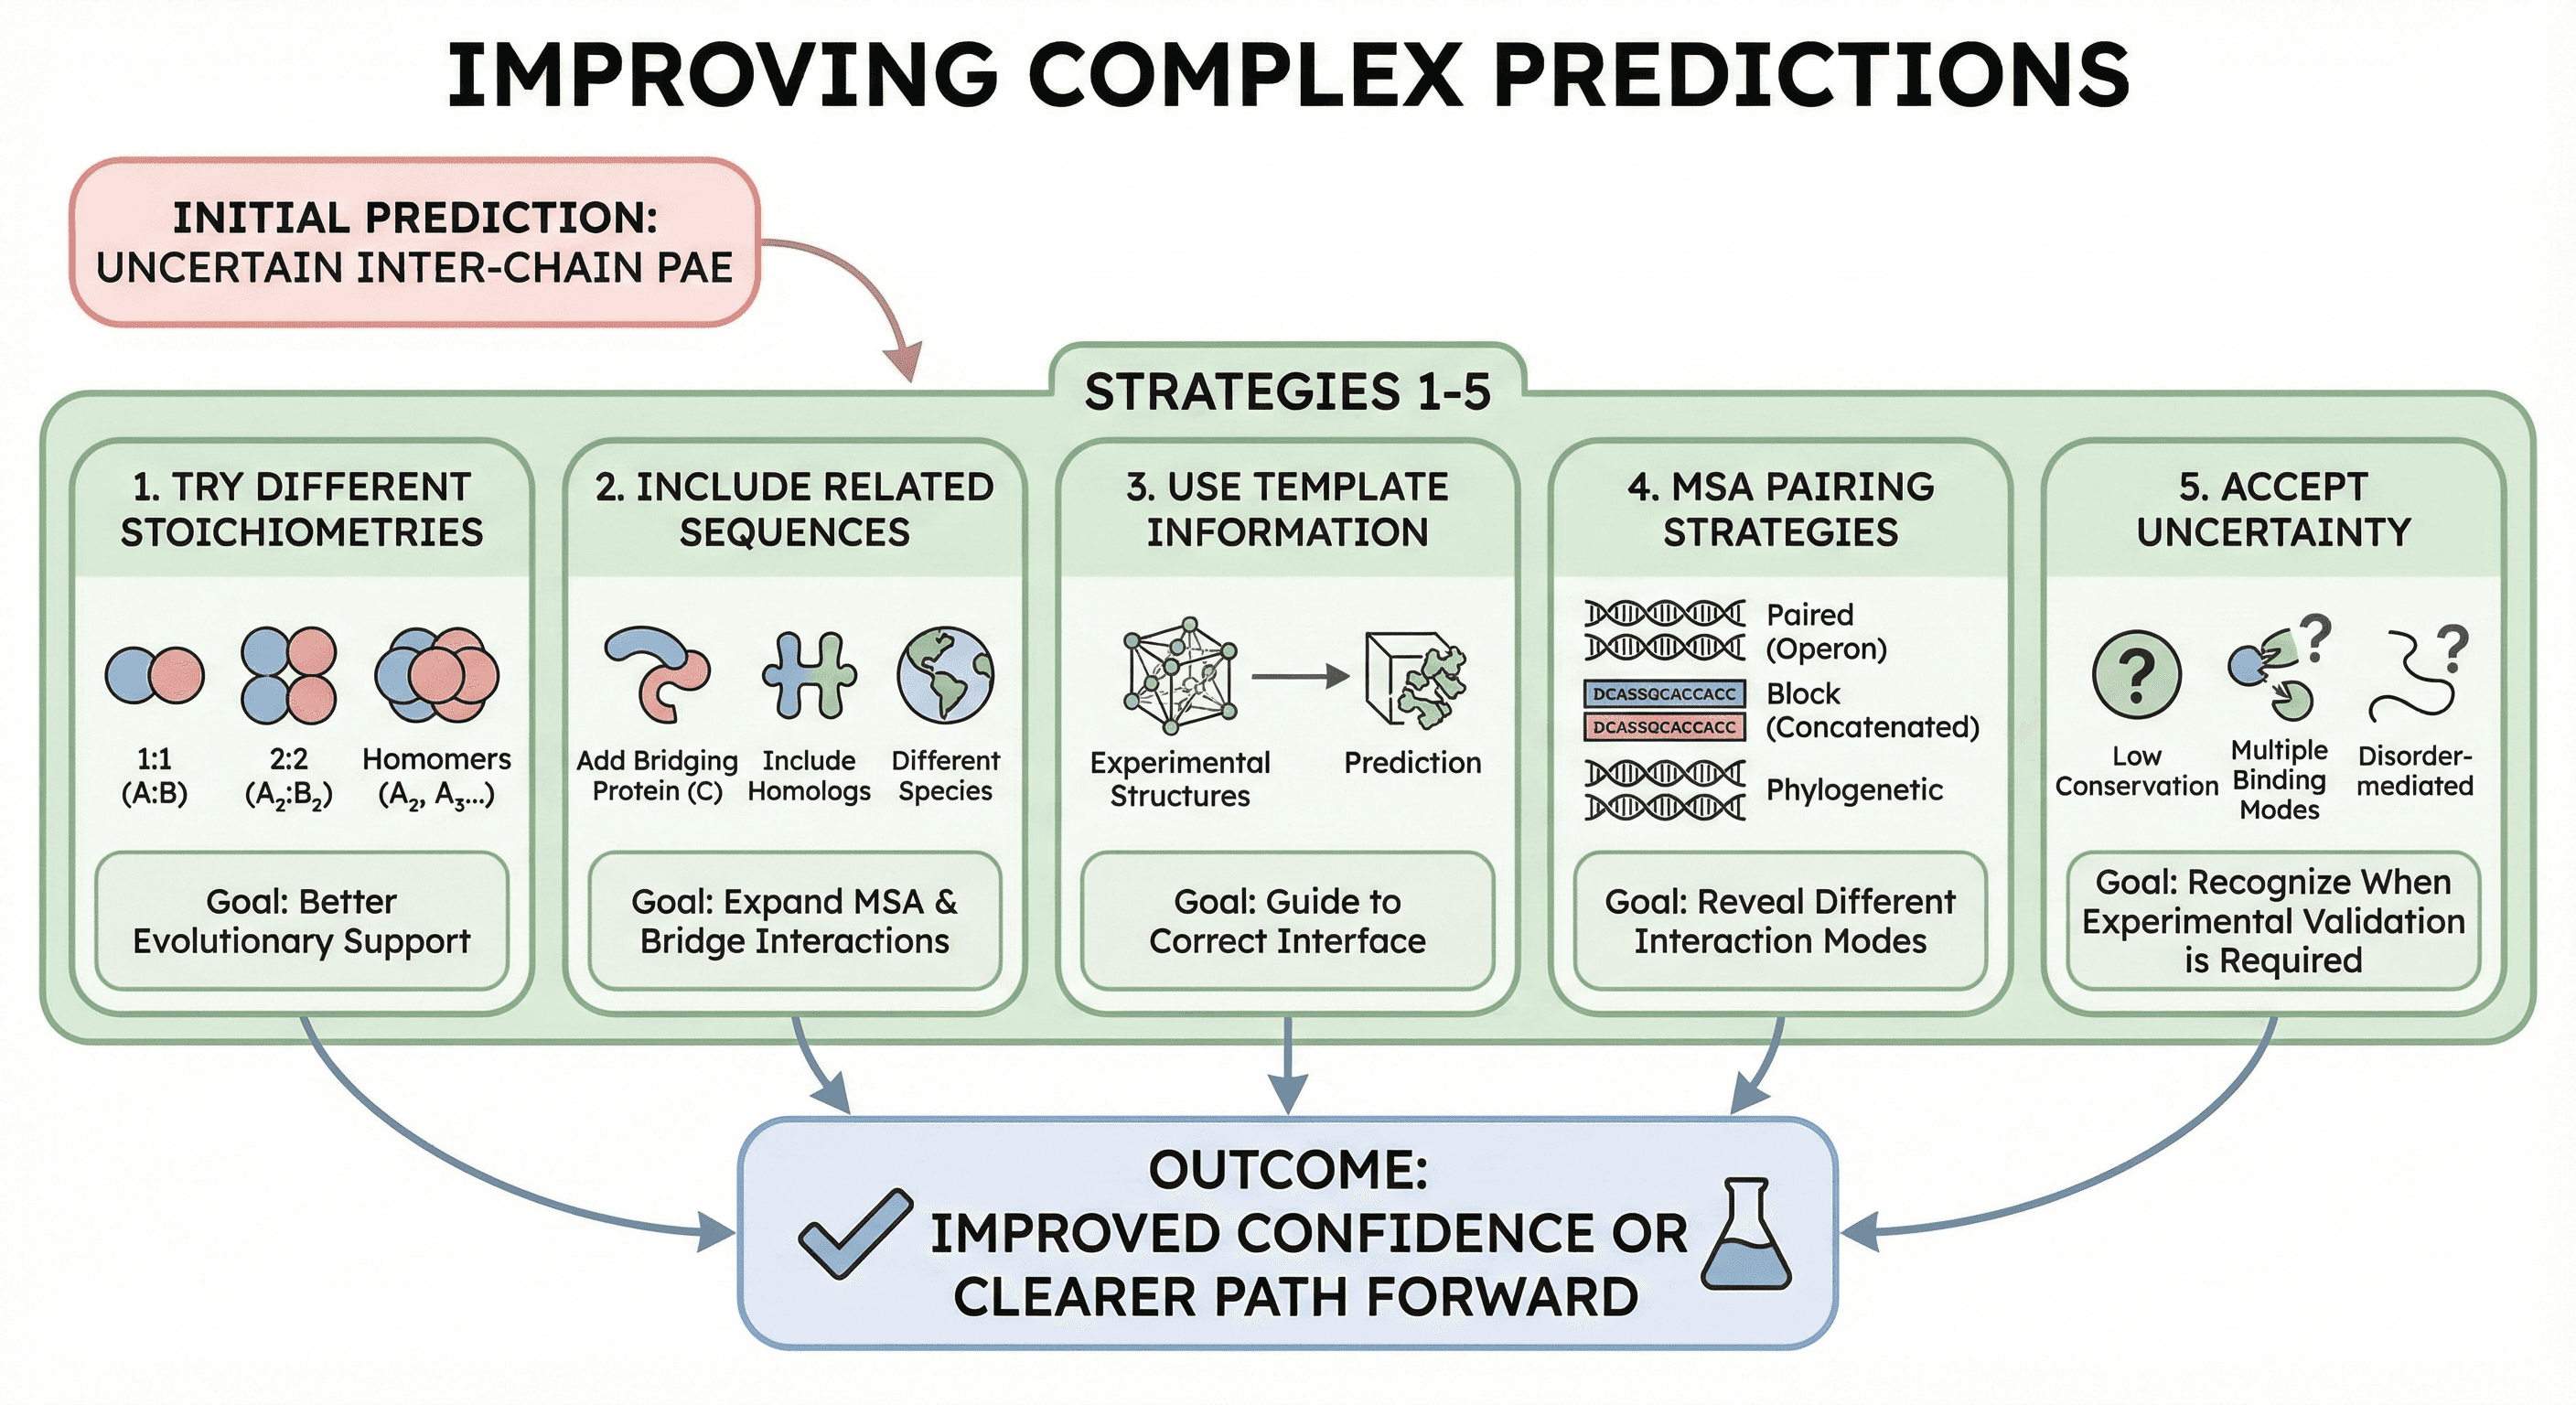
If your first prediction shows uncertain inter-chain PAE:
Strategy 1: Try Different Stoichiometries
AlphaFold-Multimer can predict:
1:1 heterodimers (A:B)
2:2 heterotetramers (A₂:B₂)
Homomers with different symmetry (A₂, A₃, A₄...)
The "true" stoichiometry might have better evolutionary support.
Strategy 2: Include Related Sequences
If your two proteins don't co-evolve, try:
Adding a third protein that bridges them
Including homologs that might have better MSA coverage
Running the prediction with proteins from a different species
Strategy 3: Use Template Information
If experimental structures exist for related complexes:
Provide them as templates
This can guide the prediction toward the correct interface
Strategy 4: MSA Pairing Strategies
Different MSA pairing methods can reveal different interactions:
Paired MSAs (same operon/genomic context)
Block MSAs (independent MSAs concatenated)
Phylogenetically paired MSAs
Strategy 5: Accept Uncertainty
Sometimes the interaction genuinely isn't predictable:
Low conservation → no evolutionary signal
Multiple binding modes → AlphaFold picks one (maybe wrong)
Disorder-mediated interaction → hard to predict
In these cases, experimental validation is required.
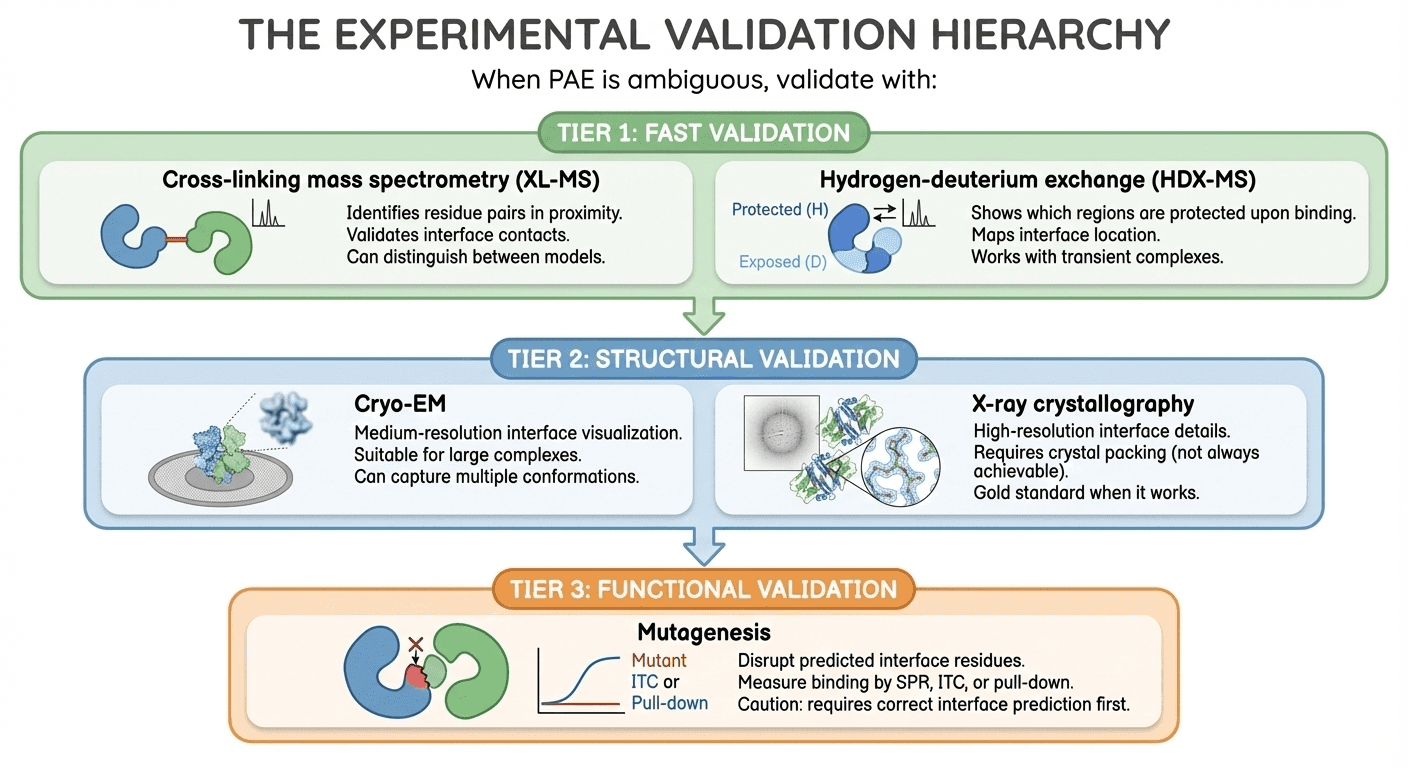
The Experimental Validation Hierarchy
When PAE is ambiguous, validate with:
Tier 1: Fast Validation
Cross-linking mass spectrometry (XL-MS):
Identifies residue pairs in proximity
Validates interface contacts
Can distinguish between models
Hydrogen-deuterium exchange (HDX-MS):
Shows which regions are protected upon binding
Maps interface location
Works with transient complexes
Tier 2: Structural Validation
Cryo-EM:
Medium-resolution interface visualization
Suitable for large complexes
Can capture multiple conformations
X-ray crystallography:
High-resolution interface details
Requires crystal packing (not always achievable)
Gold standard when it works
Tier 3: Functional Validation
Mutagenesis:
Disrupt predicted interface residues
Measure binding by SPR, ITC, or pull-down
Caution: requires correct interface prediction first
Summary: The Complex Prediction Workflow
The Bottom Line
AlphaFold-Multimer is a powerful tool for predicting protein complexes, but it requires careful interpretation:
Metric | What It Tells You | What It Doesn't Tell You |
|---|---|---|
pLDDT | Local structure confidence | Whether chains interact |
PAE (intra-chain) | Domain structure confidence | Inter-domain flexibility |
PAE (inter-chain) | Interface confidence | Binding affinity |
ipTM | Overall interface quality | Which interface is correct |
The most important rule: Never trust a complex prediction without checking the inter-chain PAE.
A beautiful 3D structure with two proteins touching means nothing if the PAE says AlphaFold was guessing. Conversely, a somewhat rough-looking interface with low PAE might be biologically accurate.
Streamlining Complex Analysis
For researchers working with multi-chain predictions, analyzing PAE matrices and interface metrics manually is tedious. Platforms like Orbion automate this workflow:
Automatic interface detection from AlphaFold-Multimer outputs
Interface area and contact residue calculation
Per-chain characterization (PTMs, binding sites, topology)
Confidence visualization highlighting reliable vs uncertain regions
The goal is to move from "here's a complex structure" to "here's what you can actually trust about this interaction"—before you design experiments based on potentially unreliable predictions.
References
Jumper J, et al. (2021). Highly accurate protein structure prediction with AlphaFold. Nature, 596:583-589. Link
Evans R, et al. (2022). Protein complex prediction with AlphaFold-Multimer. bioRxiv. Link
Bryant P, et al. (2023). Evaluation of AlphaFold-Multimer prediction on multi-chain protein complexes. Bioinformatics, 39(7):btad424. Link
Guo H, et al. (2023). PAE viewer: a webserver for the interactive visualization of the predicted aligned error. Nucleic Acids Research, 51(W1):W404-W410. PMC10320053
EBI Training. pLDDT: Understanding local confidence. AlphaFold Course. Link
Ruff KM & Pappu RV. (2021). AlphaFold and Implications for Intrinsically Disordered Proteins. Journal of Molecular Biology, 433(20):167208. Link
Book a 20-Minute Demo
Sign up free for unlimited Overview runs — summary, sequence-based analysis, homology search. For the full Characterization — PTMs, binding sites, stability variants, construct design — book a demo and we'll run your target live.
