You've spent $150K on a high-resolution cryo-EM microscope session. Your protein is pure, stable, and monodisperse. You make grids, collect data, and begin processing. Then you see it: your 2D class averages are a blurry mess. Particles won't align. Half your classes look like noise.
After three days of data collection, you have nothing usable.
Welcome to the most frustrating bottleneck in cryo-EM: sample preparation. While cryo-EM has revolutionized structural biology, the technique's Achilles' heel remains the grid. Get the sample wrong, and $200K of microscope time produces nothing but expensive noise.
This is Part 1 of our cryo-EM troubleshooting guide. Here, we'll diagnose why samples fail. In Part 2, we'll cover how to fix each problem and optimize your workflow.
Key Takeaways
-
60-70% of cryo-EM projects fail due to sample preparation, not microscope limitations
-
Main culprits: Preferred orientation (40%), particle aggregation (25%), denaturation at air-water interface (20%), sample heterogeneity (10%), ice thickness (5%)
-
Average cost per failed session: $150-300K (sample prep, grid screening, data collection)
-
Success rate: 30-40% for challenging targets with traditional approach
-
Modern solution: Computational prediction + systematic optimization reduces failure rate to 20%
The Cryo-EM Revolution's Hidden Bottleneck
The Promise
Cryo-EM solved the "impossible targets":
-
GPCRs in native-like states
-
Large complexes (ribosomes, spliceosome)
-
Membrane proteins without crystallization
-
Flexible proteins
-
Multiple conformational states
Nobel Prize 2017: Jacques Dubochet, Joachim Frank, Richard Henderson
Growth:
-
2010: ~50 structures/year
-
2024: ~3,500 structures/year
-
70× growth in 14 years
The Reality
Cryo-EM success is NOT limited by microscopes. Modern microscopes (Titan Krios, Glacios) are excellent. The bottleneck is sample preparation.
Failure at each stage:
-
Grid preparation: 40% failure (aggregation, orientation, denaturation)
-
Grid screening: 20% failure (ice quality, contamination)
-
Data collection: 10% failure (drift, charging)
-
Processing: 30% failure (heterogeneity, alignment)
Total success rate: 30-40% for challenging targets
Sample Killer 1: Preferred Orientation (40% of Failures)
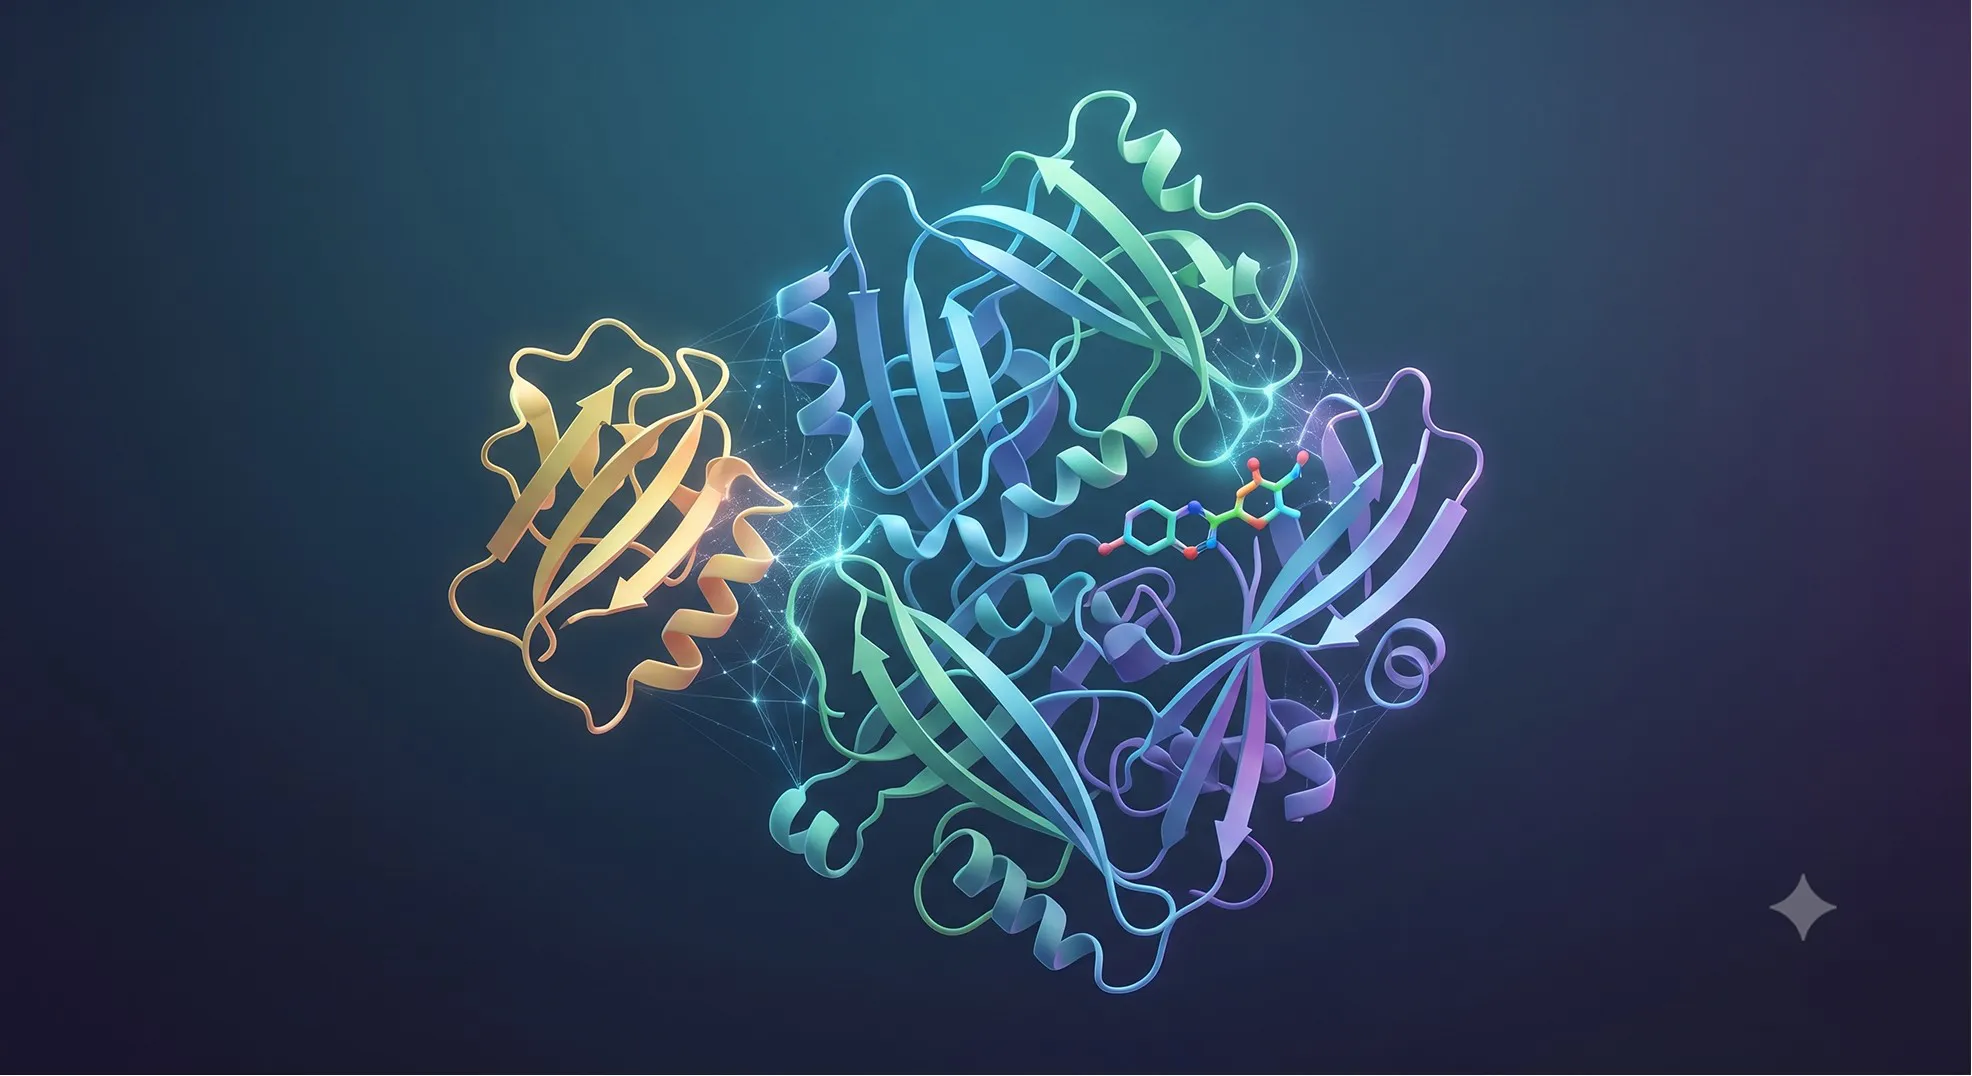
What it means: Particles adopt the same orientation on the grid—typically lying flat. This gives you only one view, making 3D reconstruction impossible.
Why It Happens
The air-water interface problem:
-
When you blot the grid, a thin film of buffer (~50 nm) remains
-
Creates two hydrophobic surfaces: air-water (top) and carbon support (bottom)
-
Proteins adsorb to minimize free energy
-
Result: Proteins orient with most hydrophobic face toward surface
Anisotropic protein shapes:
-
Flat proteins (discs) lie flat
-
Elongated proteins align parallel
-
Asymmetric charge distribution causes bias
Example: GPCRs
-
Disc-shaped (7-TM cylinder)
-
90% lie flat on grid
-
Missing: Side views
-
Result: Cannot resolve structure (anisotropic resolution: 3 Å in X-Y, 8 Å in Z)
How to Diagnose
1. 2D class averages:
-
All classes show same view (e.g., all top-down)
-
No side views, no tilted views
-
Angular distribution plot clusters at 0° or 90°
2. 3D reconstruction:
-
Fourier Shell Correlation (FSC) is anisotropic
-
Resolution in Z-direction much worse than X-Y
-
3D map looks "squashed"
3. Tilt-series test:
-
Collect at 0°, 30°, 45° tilt
-
If particle views don't change → preferred orientation
Sample Killer 2: Particle Aggregation (25% of Failures)
What it means: Particles clump together on the grid, forming aggregates instead of well-dispersed singles.
Why It Happens
Concentration shock:
-
During blotting, buffer evaporates
-
Local concentration spikes from 2 mg/mL → 20-50 mg/mL
-
At high concentration, proteins aggregate
Surface adsorption-induced aggregation:
-
Proteins partially unfold at air-water interface
-
Exposed hydrophobic regions stick together
-
Forms oligomers and larger aggregates
Buffer incompatibility:
-
Low salt → charge-charge aggregation
-
pH near pI → reduced charge repulsion
-
Missing stabilizers → aggregation
How to Diagnose
1. Micrographs:
-
Particles clustered (not evenly distributed)
-
Large dark blobs instead of individual particles
-
Holes either empty or completely filled
2. 2D class averages:
-
Classes show merged particles (overlapping densities)
-
Cannot distinguish individuals
-
Low-resolution classes
3. Particle picking:
-
Autopicking fails (too many false positives)
-
50% of "particles" are actually aggregates
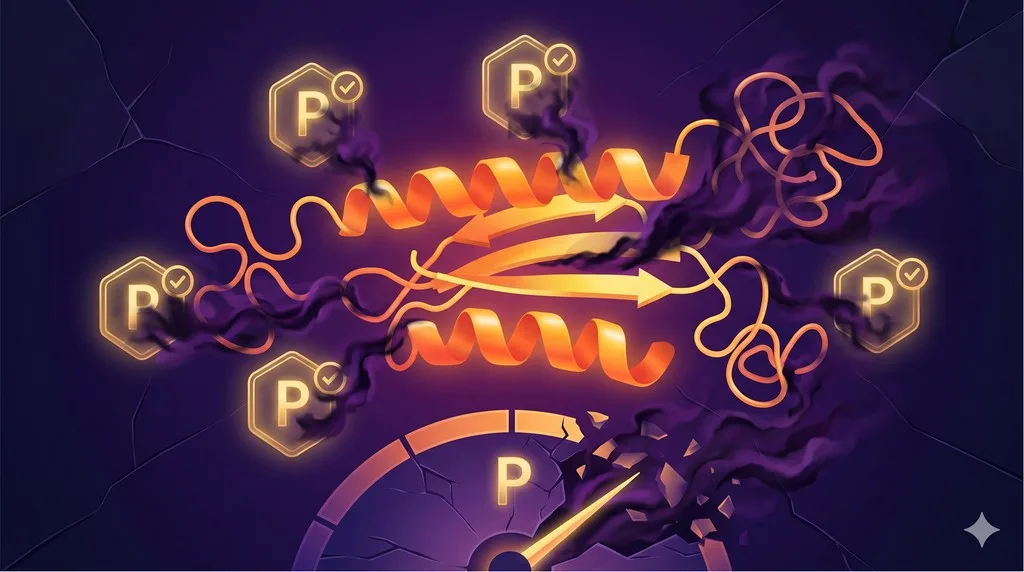
Sample Killer 3: Denaturation at Air-Water Interface (20% of Failures)
What it means: Protein unfolds or partially denatures when it contacts the air-water interface during blotting.
Why It Happens
Hostile interface:
-
Air-water interface has high surface tension (~70 mN/m)
-
Proteins unfold to maximize hydrophobic contacts with air
-
Unfolded proteins cannot be reconstructed
Rapid buffer exchange:
-
Volatile buffer components evaporate (ammonia, CO₂)
-
pH shifts by 1-2 units in seconds
-
Protein unfolds if outside stability range
Mechanical stress:
-
Blotting applies shear forces
-
Thin film (<50 nm) confines proteins
-
Weak proteins unfold
How to Diagnose
1. 2D class averages:
-
Particles lack defined features (fuzzy, low-contrast)
-
Cannot distinguish domains
-
High variability between classes
2. 3D reconstruction:
-
Cannot refine beyond 10-15 Å (protein disordered)
-
Map is blobby (no secondary structure)
3. Compare to negative stain:
-
Negative stain shows defined particles
-
Cryo shows fuzzy particles
-
Conclusion: Stable in solution, denatures on cryo grid
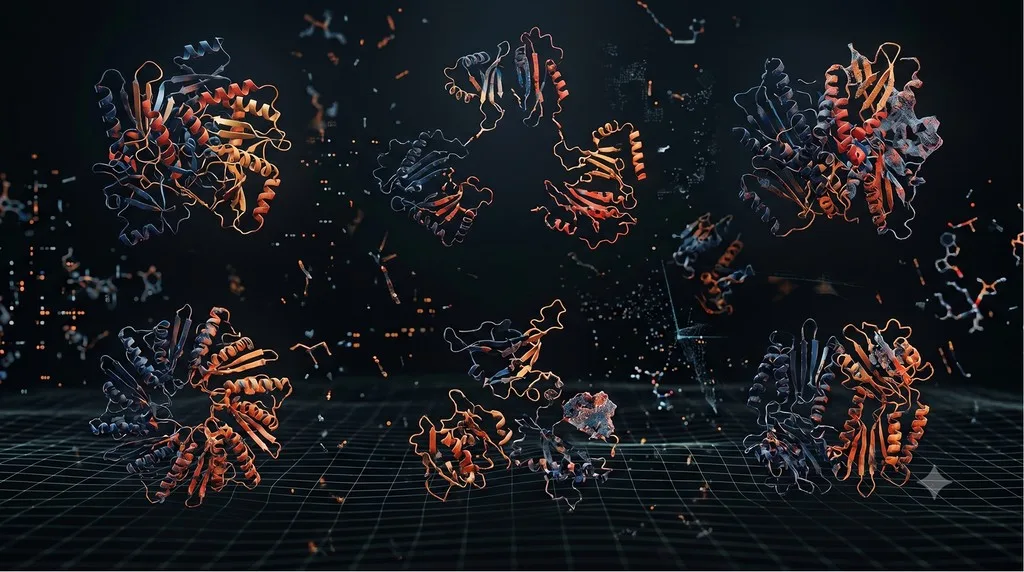
Sample Killer 4: Sample Heterogeneity (10% of Failures)
What it means: Your "pure" sample is a mixture of conformations, oligomeric states, or PTMs. Cryo-EM requires homogeneity for high-resolution.
Sources of Heterogeneity
A. Post-Translational Modifications (PTMs)
The problem:
-
Glycosylation produces 10-100 different glycoforms
-
Each has different mass/shape
-
Result: Fuzzy density where glycans are
Example: GPCR glycosylation
-
2-4 N-glycosylation sites
-
Each site: 5-10 glycan structures
-
Total: 25 to 10,000 glycoforms
-
Cannot achieve high resolution with this heterogeneity
B. Conformational heterogeneity
-
Protein in multiple states (open/closed, active/inactive)
-
Without ligand, samples all states
-
Result: Mixture that cannot reconstruct
C. Oligomeric state heterogeneity
-
Mixture of monomers, dimers, tetramers
-
Different sizes/shapes
-
Classification struggles to separate
How to Diagnose
1. 2D classification:
-
Classes show variability (different sizes, shapes)
-
Cannot achieve good averages (fuzzy features)
-
Need 20-50 classes (vs 5-10 for homogeneous)
2. 3D classification:
-
Multiple classes (each different conformation/oligomer)
-
Cannot refine to high resolution
3. Local resolution map:
-
Some regions high-res (3-4 Å)
-
Other regions low-res (8-12 Å)
-
Low-res regions = flexible loops or PTMs
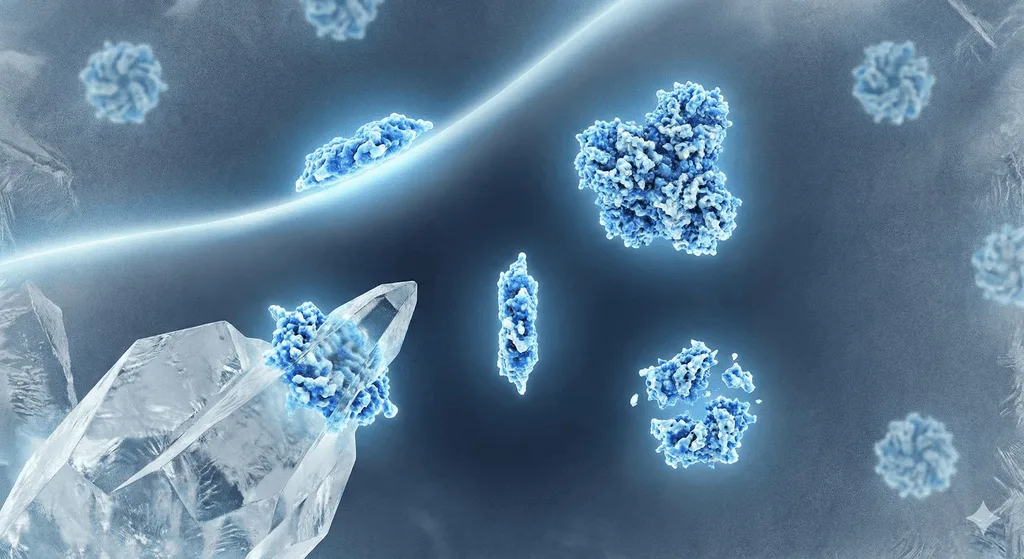
Sample Killer 5: Ice Thickness and Quality Issues (5% of Failures)
What it means: The vitreous ice layer is too thick, too thin, contaminated, or crystalline.
Why It Happens
Ice too thick:
-
Blotting time too short → thick film remains
-
Result: Poor contrast, particles hard to see
Ice too thin:
-
Blotting time too long → almost all buffer removed
-
Result: Particles flattened, denatured, or dry
Crystalline ice:
-
Freezing too slow → water crystallizes
-
Contamination nucleates crystals
-
Result: Diffraction rings in FFT, unusable micrographs
How to Diagnose
1. Micrograph inspection:
-
Ice too thick: Low contrast, particles barely visible
-
Ice too thin: Particles touching carbon, no buffer
-
Crystalline: Bright spots in FFT, diffraction rings
2. Power spectrum (FFT):
-
Vitreous ice: Smooth, featureless background
-
Crystalline ice: Sharp rings at specific frequencies
3. Particle distribution:
-
Good ice: Particles evenly distributed in holes
-
Bad ice: Particles only on carbon edge or holes empty
The PTM Heterogeneity Problem: A Deep Dive
This is where most projects underestimate the challenge.
Why PTMs Kill Reconstruction
Glycosylation:
-
Single site can produce 10-50 glycoforms
-
Each has different mass (0.5-5 kDa)
-
Each has different shape and charge
-
Result: Particles not identical → classification fails
Case Study: GPCR Glycosylation Disaster
Target: Novel GPCR
Attempt 1: Full-length (mammalian expression)
-
Purification: Excellent
-
Grids: 50 made, 20 screened
-
Data: 5,000 micrographs, 500,000 particles
-
Result: Cannot refine beyond 8 Å resolution
Diagnosis:
-
2D classes fuzzy in extracellular region
-
3D: Extracellular loops 8-12 Å, TM core 4-5 Å
-
Cause: N-glycosylation (3 sites in loops)
Solution: Remove glycosylation sites
-
Predict with Orbion: N6, N15, N194
-
Mutate: N6Q, N15Q, N194Q
-
Re-express, re-purify
Attempt 2: Deglycosylated mutant
-
Grids: 20 made
-
Data: 3,000 micrographs, 400,000 particles
-
Result: 3.2 Å structure (uniform resolution)
Lesson: PTM heterogeneity was the limiting factor.
Understanding Your Problem: Quick Diagnostic
| Symptom | Likely Problem | Quick Test |
|---|---|---|
| All 2D classes show same view | Preferred orientation | Check angular distribution |
| Particles clustered in micrographs | Aggregation | DLS at crystallization concentration |
| 2D classes fuzzy, no features | Denaturation | Compare to negative stain |
| Many 3D classes needed | Heterogeneity | Check for PTMs, oligomers |
| Bright spots in FFT | Crystalline ice | Check blotting parameters |
| Very dark or very light holes | Ice thickness | Optimize blot time |
Key Takeaway
Cryo-EM sample preparation isn't random trial-and-error. It's a predictable engineering problem with known failure modes:
-
Preferred orientation (40%): Particles lie flat
-
Aggregation (25%): Clumping at high concentration
-
Denaturation (20%): Unfolding at air-water interface
-
Heterogeneity (10%): PTMs, conformational states
-
Ice quality (5%): Too thick, thin, or crystalline
Understanding your failure mode is the first step to solving it.