Blog
Orbion Team
Crystallization Optimization Beyond the Sparse Matrix Screen

You ran a 96-condition sparse matrix screen and three drops contain something. One has a shower of needle clusters, one shows a 30-micron birefringent rod nested in precipitate, and one has a flat plate so thin it bends in the loop. They diffract to 8 Å, if at all. This is not a failure—it is the start of crystallization. The sparse matrix gave you a region of phase space that produces order. Everything that follows is engineering: turning a hit into a crystal that gives a structure.
The gap between "I have crystals" and "I have a dataset" is where most projects stall. Optimization is not a single screen; it is a deliberate traversal of the supersaturation landscape, an additive campaign informed by mechanism, and—often overlooked—a return to the construct itself.
Key Takeaways
A hit is not a crystal. Distinguish ordered crystalline matter from salt, urea bundles, and pseudo-crystalline aggregates before optimizing.
Phase diagrams beat grid screens. Nucleation and growth zones are distinct; you cannot reach both from the same starting condition.
Microseeding (MMS) is the highest-yield single technique in modern crystallography and remains underused outside dedicated structural groups.
Additives work by mechanism, not by magic; pick them based on what they do to surface, solvent, or oligomeric state.
When chemistry stalls, fix the protein. Domain trimming, surface entropy reduction, and disorder removal often unlock conditions that screens cannot.
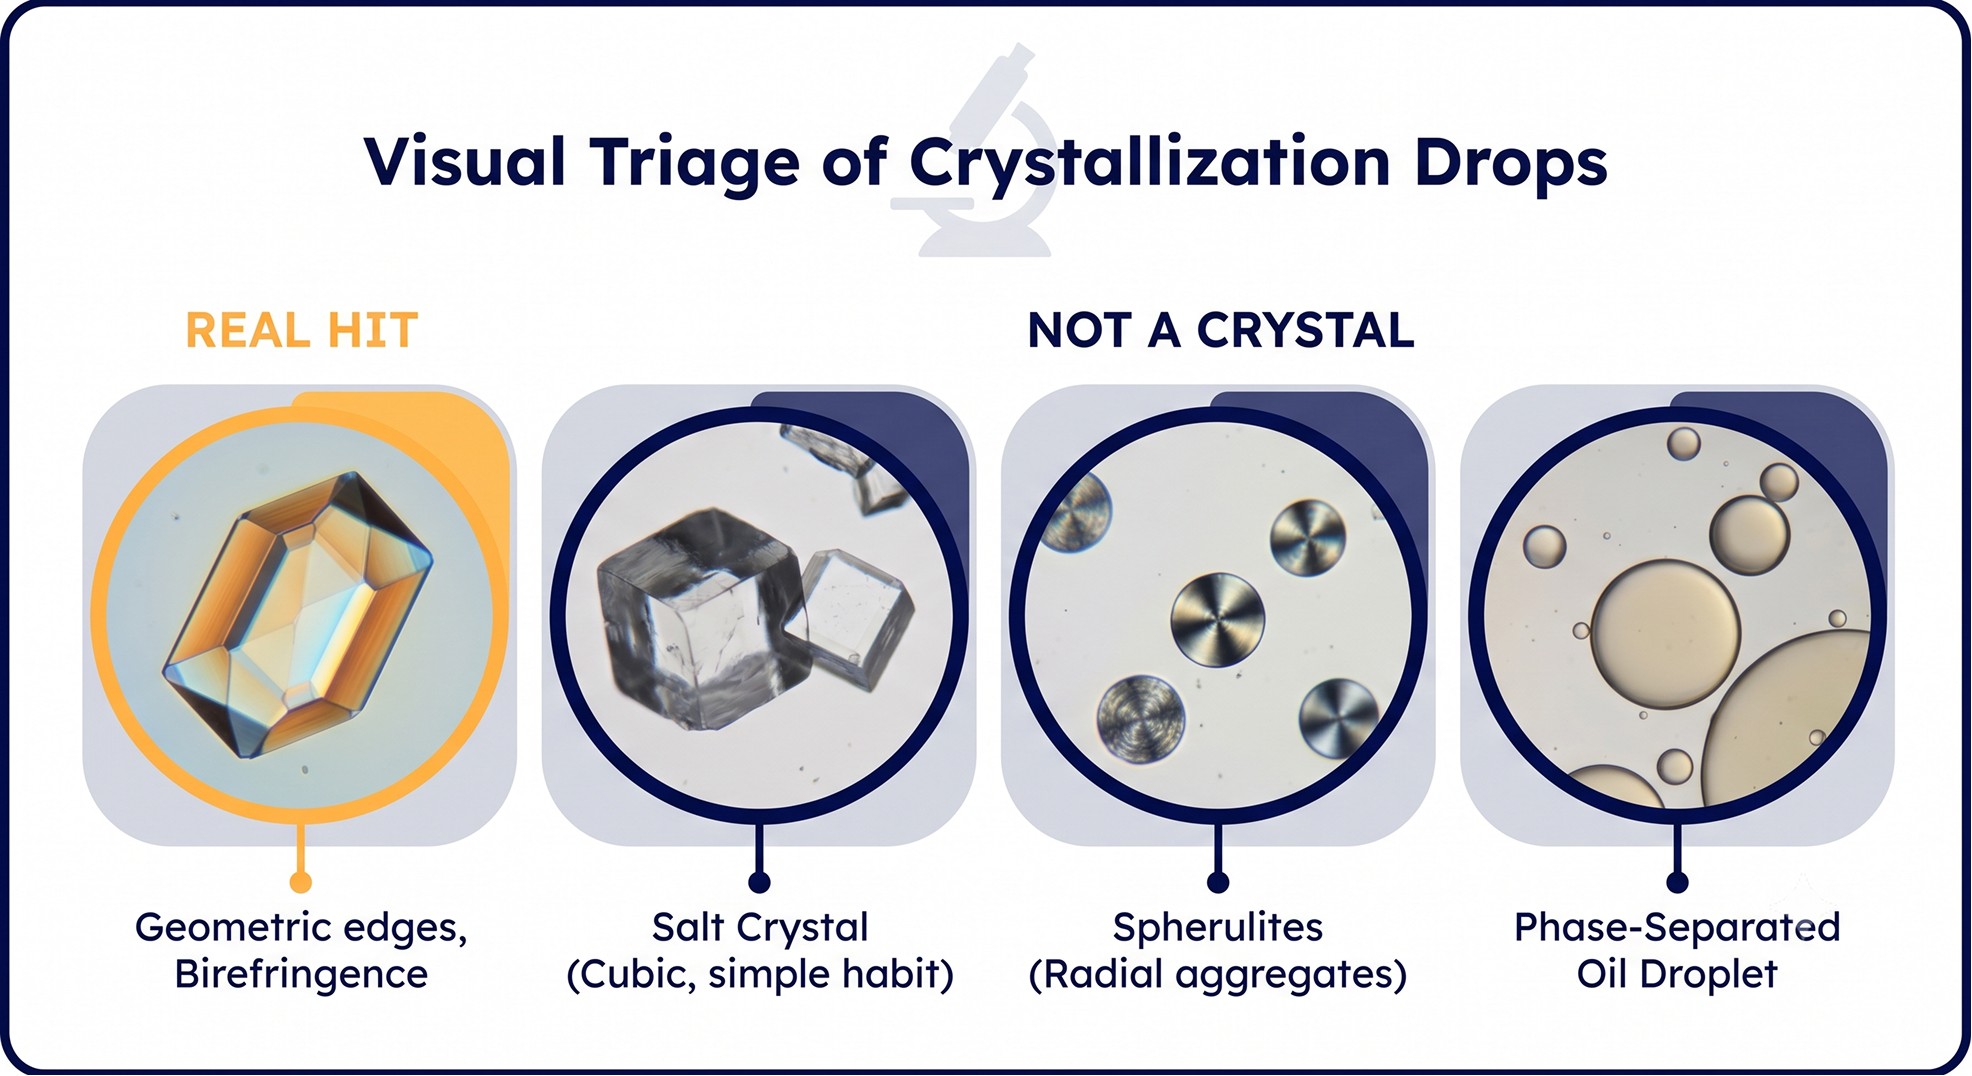
What Counts as a Hit
Before optimizing anything, you must know what you are optimizing. Drops from a sparse matrix can contain a dozen things that look crystalline and are not.
Visual Triage
Real protein crystals:
Sharp, geometric edges (though plates and needles are common early forms)
Birefringence under cross-polarized light (with the exception of cubic crystals, which extinguish at all angles)
Nucleation pattern consistent with a Poisson process (not identical shapes in every drop)
Growth over hours to days, not seconds
Imposters:
Salt crystals: appear in seconds to minutes, often cubic or octahedral, very birefringent, do not crush with a probe
Urea or precipitant crystallites: appear in concentrated buffer drops without protein
Phase-separated oil: spherical droplets, no birefringence, coalesce on tapping
Spherulites: radial fibrous balls, weakly birefringent, almost never diffract usefully
Quasi-crystals / sea urchins: ordered enough to nucleate but disordered along radial axis; treat as a phase-diagram signal, not a target
Discriminating Tools
Tool | What it confirms | Cost / complexity |
|---|---|---|
Cross-polarized microscopy | Birefringence → likely ordered | Standard on most imagers |
UV fluorescence imaging (280 nm) | Tryptophan/tyrosine presence → protein, not salt | Common in modern Formulatrix/RockImager systems |
Izit / methylene blue dye | Dye uptake → protein crystal | Cheap, destructive |
In situ PXRD or microfocus diffraction | Definitive ordering, even at 6–8 Å | Synchrotron only |
SONICC (SHG) | Non-centrosymmetric protein crystals → confirms protein | Requires specialty imager |
If your imager does not have UV, run drops with and without protein at the same conditions. Anything that appears in the no-protein control is not your target.
Diffraction as Truth
A 5-micron crystal that diffracts to 7 Å is a real hit. A 200-micron plate that gives only ice rings is not. Always shoot a hit at the synchrotron (or in-house) before investing weeks in optimization. The relationship between visual quality and diffraction quality is loose; large clear crystals can be twinned, mosaic, or poorly ordered along one axis.
The Optimization Variable Map
A sparse matrix samples one point in a high-dimensional landscape. Optimization is the systematic traversal of that landscape around your hit.
The Core Variables
Variable | Typical range around hit | What it controls |
|---|---|---|
Precipitant concentration | ±30% in 5–10% steps | Supersaturation level |
pH | ±1.0 unit in 0.2 steps | Protein surface charge, oligomeric state |
Salt (kosmotrope/chaotrope) | 0–500 mM in 50–100 mM steps | Ionic strength, Hofmeister effects |
Temperature | 4 / 12 / 18 / 22 °C | Solubility, kinetics, oligomeric equilibrium |
Protein concentration | 0.5×, 1×, 1.5×, 2× | Supersaturation, nucleation kinetics |
Drop ratio (P:R) | 1:2, 1:1, 2:1, 3:1 | Equilibration rate, final concentrations |
Reservoir volume | 100, 250, 500, 1000 µL | Equilibration speed |
The mistake is to vary only precipitant and pH—the textbook "grid screen." This works occasionally but ignores the levers that often matter most: temperature, drop ratio, and protein concentration.
A First-Round Optimization Grid
For a hit at 20% PEG 3350 / 0.2 M Na citrate / pH 6.5 / 18 °C, a defensible 96-condition follow-up might be:
6 PEG concentrations (12, 16, 20, 24, 28, 32%)
4 pH values (5.5, 6.0, 6.5, 7.0)
4 conditions per cell (replicates and drop ratio variation)
Run in duplicate at 4 °C and 18 °C
This is 192 drops if you split temperatures across plates. It is also the wrong screen to run if you do not know whether your hit is in the nucleation zone or the growth zone.
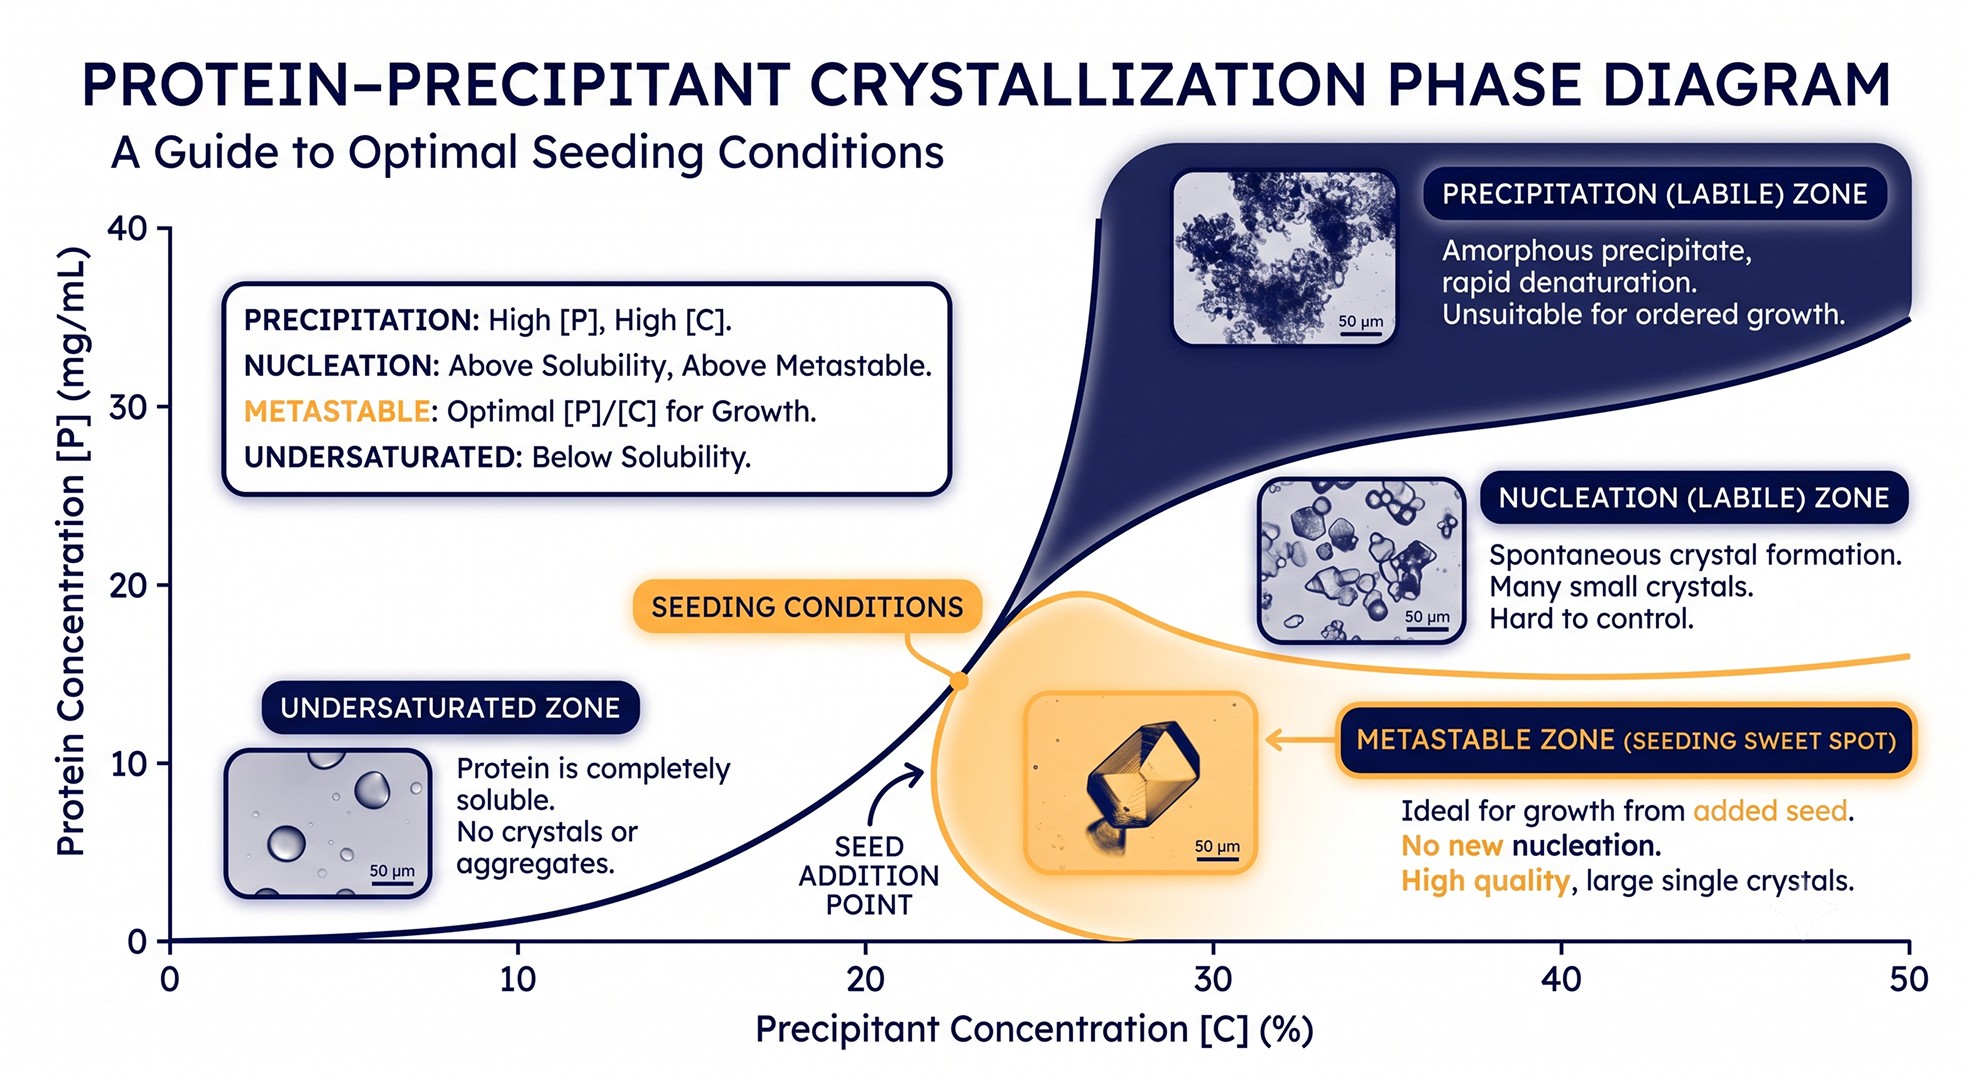
Phase Diagram Thinking
The single most useful conceptual shift between crystallographer and method-developer is moving from "find conditions that produce crystals" to "find conditions where I can independently control nucleation and growth."
The Four Zones
For a binary precipitant–protein phase diagram (Asherie, 2004):
Zone | Behavior | Use |
|---|---|---|
Undersaturated | Protein soluble; nothing forms | Storage buffer; seed dissolution |
Metastable | Existing crystals grow; no new nuclei | Seeding target zone |
Nucleation (labile) | Spontaneous nucleation + growth | Initial hit hunting |
Precipitation | Amorphous precipitate, often kinetically trapped | Avoid |
A sparse matrix hit usually lands in the nucleation zone. The problem with the nucleation zone is that everything happens simultaneously—nuclei form, grow, deplete the drop, and the result is many small crystals rather than one large one.
The Seeding Strategy
The textbook fix:
Identify a metastable condition (slightly lower precipitant or protein concentration) where pre-formed crystals would grow but new ones do not nucleate.
Add seeds into that metastable condition.
Growth proceeds without competition; crystals grow large.
Identifying Your Zones
A "pre-crystallization test" (PCT) or a simple PEG ladder against protein concentration takes one day:
Plate 8 protein concentrations × 8 precipitant concentrations in a coarse grid
Look for the line dividing clear drops from cloudy/precipitated drops
The metastable zone hugs this line on the clear side
The nucleation zone is one step into the cloudy side
Run this before optimization, not after. It costs 64 drops and saves weeks of guesswork.
Phase Diagram Cases
Scenario | Drop appearance after 24 h | Likely zone | Next move |
|---|---|---|---|
Clear | Soluble | Undersaturated | Raise precipitant or protein |
Light haze, no crystals after 7 d | Metastable | Metastable | Seed it |
Many small crystals | Saturated nucleation | Labile | Lower precipitant or seed at metastable |
Crystals on amorphous precipitate | Borderline labile/precip | Labile edge | Lower precipitant 10–20% |
Sea urchins, spherulites | Deep labile | Far into labile | Significantly reduce protein or precipitant |
Amorphous precipitate only | Precipitation | Precipitation | Major reformulation needed |
Additive Screening: Mechanism Over Magic
The Hampton Additive Screen and similar (Silver Bullets, JBS Additives) contain 96 small molecules at fixed concentrations. The temptation is to run the screen and report "additive 23 worked." The discipline is to understand why.
Additive Classes and Their Mechanisms
Class | Examples | Mechanism | When to try |
|---|---|---|---|
Divalent cations | Mg²⁺, Ca²⁺, Zn²⁺ | Crosslink crystal contacts, stabilize loops | Acidic surface proteins; nucleic-acid binders |
Monovalent salts | NaCl, KCl, LiCl, NH₄Cl | Modulate ionic strength, Hofmeister | Always worth a few points |
Polyamines | Spermine, spermidine | Bridge negatively charged surfaces | Nucleic acid–protein complexes |
Small alcohols | Ethanol, isopropanol, MPD | Lower dielectric, weaken hydrophobic interactions | Crystals with hydrophobic packing |
Polyols | Glycerol, ethylene glycol, sucrose | Preferential exclusion → stabilize | Protein looks marginally stable |
Detergents | β-OG, LDAO, C12E8 | Disrupt soluble aggregates, occupy hydrophobic patches | Membrane proteins; persistent precipitate |
Reducing agents | DTT, TCEP, β-ME | Maintain free cysteines | Cys-rich proteins, oxidation-sensitive |
Chelators | EDTA, EGTA | Remove adventitious metals | Inconsistent crystallization |
Small molecule ligands | Substrates, products, analogs | Lock conformation, reduce flexibility | Enzyme targets |
Cryo-protectants | Glycerol, PEG 400, MPD | Sometimes seed-friendly at growth conditions | Test late |
Systematic Additive Strategy
Luft and DeTitta's foundational additive screen (1999) established the principle: rather than dumping 96 random chemicals, group them and follow up:
First pass: Hampton Additive Screen at 1:10 dilution into your hit condition.
Hit verification: Re-test apparent hits in triplicate; many additive "hits" are noise.
Concentration response: A real additive shows a concentration-dependent effect (better at 5 mM than 1 mM, or vice versa).
Mechanistic follow-up: If divalent cations help, screen Mg / Ca / Mn / Zn at multiple concentrations. If polyols help, vary type and percentage.
Treat the additive screen as a hypothesis generator, not a final formulation.

Microseeding: The Most Underused Technique
If a crystallographer asks for one piece of advice, give them this: learn to do matrix microseeding (MMS).
The Method (D'Arcy et al., 2007)
Take any crystals you have—even bad ones, even crushed needles.
Vortex with a Seed Bead (Hampton) or by repeated pipetting in stabilization buffer.
Dilute the resulting seed stock 1:100 to 1:10,000.
Add seed stock as a small fraction (5–10%) of every drop in a new sparse matrix screen—not just optimization conditions.
The insight: seeds from one condition often nucleate crystals in entirely different conditions, sometimes with better morphology, different space group, or higher resolution. D'Arcy and colleagues showed hit rates increasing 2- to 10-fold when MMS is layered onto standard sparse matrix screens.
Streak Seeding
For optimizing a specific condition, streak seeding remains the precise tool:
Touch a cat whisker, acupuncture needle, or fiber to a crystal.
Streak across a fresh equilibrated drop at the metastable condition.
Crystals nucleate along the streak path.
Streak seeding gives you spatial control over nucleation density—useful when you have a metastable condition that almost works but never nucleates.
Seed Stock Hygiene
Store seed stocks at –80 °C in aliquots; freeze–thaw degrades them.
Test seed dilution series; the right dilution gives 1–5 crystals per drop, not 100 or 0.
Re-make seed stocks every few months; bacterial growth and slow dissolution kill old stocks.
The data is unambiguous: MMS is the single highest-yield change a crystallographer can make to their workflow. The reason it remains underused is cultural—it feels like cheating compared to a clean sparse matrix hit. The structure does not know whether the crystal was seeded.
Surface Entropy Reduction as a Parallel Strategy
When optimization stalls on the chemistry side, the protein itself is often the bottleneck. Goldschmidt, Cooper, Eisenberg and the Derewenda group established the principle of surface entropy reduction (SER): identify clusters of high-entropy surface residues (Lys, Glu, Gln) and mutate them to alanine to reduce the entropic cost of crystal packing (Derewenda, 2011).
When to Consider SER
You have a stable, well-behaved protein that refuses to crystallize despite extensive screening.
Your crystals are small or poorly diffracting and no chemistry change helps.
Sequence analysis shows obvious Lys/Glu-rich patches predicted to be flexible on the surface.
The SER Workflow
Predict surface residue entropy. Original SERp server used residue burial + entropy; modern equivalents use AlphaFold pLDDT plus surface accessibility plus a residue-type prior.
Identify clusters: 2–3 adjacent surface residues from {K, E, Q} on the same face.
Mutate the cluster to alanine (sometimes serine, threonine, or tyrosine as alternatives).
Express the mutant; verify it folds (CD, thermal shift) and retains function.
Re-screen.
SER mutants often crystallize in conditions where the wild type never did, and frequently produce different space groups with better resolution. The cost is one round of cloning and a small re-screen.

Construct Engineering: Fix the Molecule
When sparse matrix, optimization, additives, seeding, and SER all fail, the message is that the molecule you are crystallizing is not the molecule you should be crystallizing.
Domain Boundary Trimming
Flexible termini and inter-domain linkers are crystallization poison. They contribute conformational entropy, disorder crystal contacts, and create the "many small crystals" pattern that signals heterogeneity.
Identify candidate trim points using:
Multiple sequence alignment: trim where conservation drops
Predicted disorder (IUPred, PONDR, AlphaFold pLDDT < 60)
Limited proteolysis: digest with trypsin or chymotrypsin and N-terminal sequence the stable core
Hydrogen-deuterium exchange: trim regions with very high exchange rates
A typical successful trim removes 10–30 residues from the N-terminus, 5–20 from the C-terminus, or a flexible insert in a loop region.
Deglycosylation and PTM Control
Glycoproteins crystallize poorly when glycan heterogeneity is preserved. Standard options:
Endo H or PNGase F treatment (where structure allows)
Express in HEK293 GnTI⁻ or Lec3.2.8.1 CHO for homogeneous Man₅
Co-expression with kifunensine (high-mannose forms)
Site-directed mutagenesis of non-essential N-glycosylation consensus sites (N → Q)
The same logic applies to phosphorylation, ubiquitination, and other heterogeneous modifications.
Surface Mutations Beyond SER
Cys → Ser to remove free thiols that cause crosslinking
Met → Leu / Ile where Met is on the surface and causes oxidation heterogeneity
Engineered disulfides to rigidify flexible loops
Fusion Partners and Tags
Crystallization chaperones (T4 lysozyme, BRIL, MBP, GFP) work for membrane proteins and small flexible proteins by providing a rigid crystal-contact surface. The strategy is well established for GPCRs; the choice between BRIL and T4L is empirical.
For soluble proteins, cleavable tags (His, SUMO, MBP) should usually be removed before crystallization—uncleaved tags introduce flexibility and reduce homogeneity. If the tag must remain, design a short, rigid linker.
Crystal Quality Diagnostics
You collected a dataset. Is the crystal worth more optimization, or is this as good as it gets?
Resolution and I/σI
A useful resolution cutoff is the highest shell with mean I/σI ≥ 2 (or ≥ 1 for anisotropic datasets when combined with CC½ > 0.3). Resolution at the edge tells you about lattice order; resolution in the middle shells tells you about general crystal quality.
I/σI behavior | Interpretation |
|---|---|
High overall, falls sharply at edge | Real resolution limit reached |
Moderate overall, gentle decline | Underexposed or small crystal; collect more |
High overall, sudden drop in middle shells | Possible ice rings, beamstop shadow, or detector issue |
Anisotropic I/σI by direction | Lattice disorder along one axis; consider STARANISO |
Mosaicity
Crystal mosaicity reflects the angular spread of mosaic blocks within the crystal. Values:
< 0.2°: Excellent
0.2–0.5°: Typical for well-ordered protein crystals
0.5–1.0°: Acceptable but limits resolution
> 1.0°: Disordered; often the limit on crystal quality
High mosaicity often correlates with crystals that grew too fast (deep into the labile zone) or were damaged by cryoprotection. It can sometimes be improved with annealing or by re-optimizing toward the metastable side.
Radiation Damage and RIDL
For long datasets or weak crystals, radiation damage will limit usable data before the crystal physically disintegrates. Monitor:
Decay of high-resolution intensity vs dose
Specific damage to Cys, Glu, Met side chains
Change in unit cell parameters during data collection
Tools like RIDL quantify specific damage on a per-residue basis (Bury et al., 2018). When damage limits resolution, the answer is more crystals or helical/multi-position data collection rather than longer exposure.
Twinning and Pathologies
A crystal that looks beautiful and diffracts to high resolution can still be unusable if it is twinned or otherwise pathological. The common pathologies and their fingerprints:
Pathology | Symptom in data | Origin | Remediation |
|---|---|---|---|
Merohedral twinning | Intensity statistics deviate from Wilson; L-test fails | Crystallographic symmetry permits multiple orientations | Detwin if fraction < 0.4; try different cryo-protection; new crystal form |
Pseudo-merohedral twinning | Higher symmetry suggested but Rmerge poor | Approximate higher symmetry from cell parameters | Process in lower symmetry; new crystal form via SER or different precipitant |
Lattice translocation | Streaky reflections, split spots | Crystal stacking faults | Slower growth (move to metastable); seeding |
Anisotropic diffraction | Strong along one axis, weak along another | Lattice order varies by direction | STARANISO or anisotropy correction; new crystal form preferred |
Ice rings | Sharp powder rings at 3.7, 2.25 Å | Inadequate cryoprotection | Re-screen cryoprotectants; oil cryo |
Multiple lattices | Overlapping spot patterns | Two or more crystals in beam | Smaller beam; pick single lattice physically |
The L-test (Padilla and Yeates, 2003) and the Britton plot are the standard diagnostics for twinning. Run them on every dataset; a 40% twinned dataset that you treat as untwinned will produce a structure that refines but is wrong in the details that matter.
Cryoprotection: The Final Variable
A crystal that diffracts to 1.8 Å at room temperature can give 3.5 Å frozen if cryoprotection introduces disorder. Strategies:
Match the cryoprotectant osmotic pressure to the mother liquor where possible
Use the precipitant as the cryoprotectant when concentrations allow (PEG ≥ 30%, MPD ≥ 25%, high-salt glycerol mixes)
Test glycerol, ethylene glycol, PEG 400, MPD, sucrose, and trehalose
Try oil cryo (Paratone-N, mineral oil) when nothing aqueous works
Anneal crystals that mosaicize on freezing (Yeh and Hol, 1998 method)
For crystals that grow in PEG 3350 / low salt, adding 20–25% ethylene glycol to the mother liquor often provides instant cryoprotection without a separate soak. The 30-second soak in fresh cryo buffer is usually safer than the "swift through a drop on the way to the loop."
When to Stop Optimizing
Resolution improvement plateaus. After three rounds of optimization that move a dataset from 4.0 Å to 2.8 Å, the fourth round will usually deliver 2.6 Å, not 2.0 Å. Stop optimizing when:
The construct is the limit (move to construct engineering)
The crystal form is the limit (try a different space group via different conditions or SER)
The dataset is good enough for the biological question
A 2.8 Å structure that answers the mechanism is more valuable than the 2.2 Å structure that does not arrive.
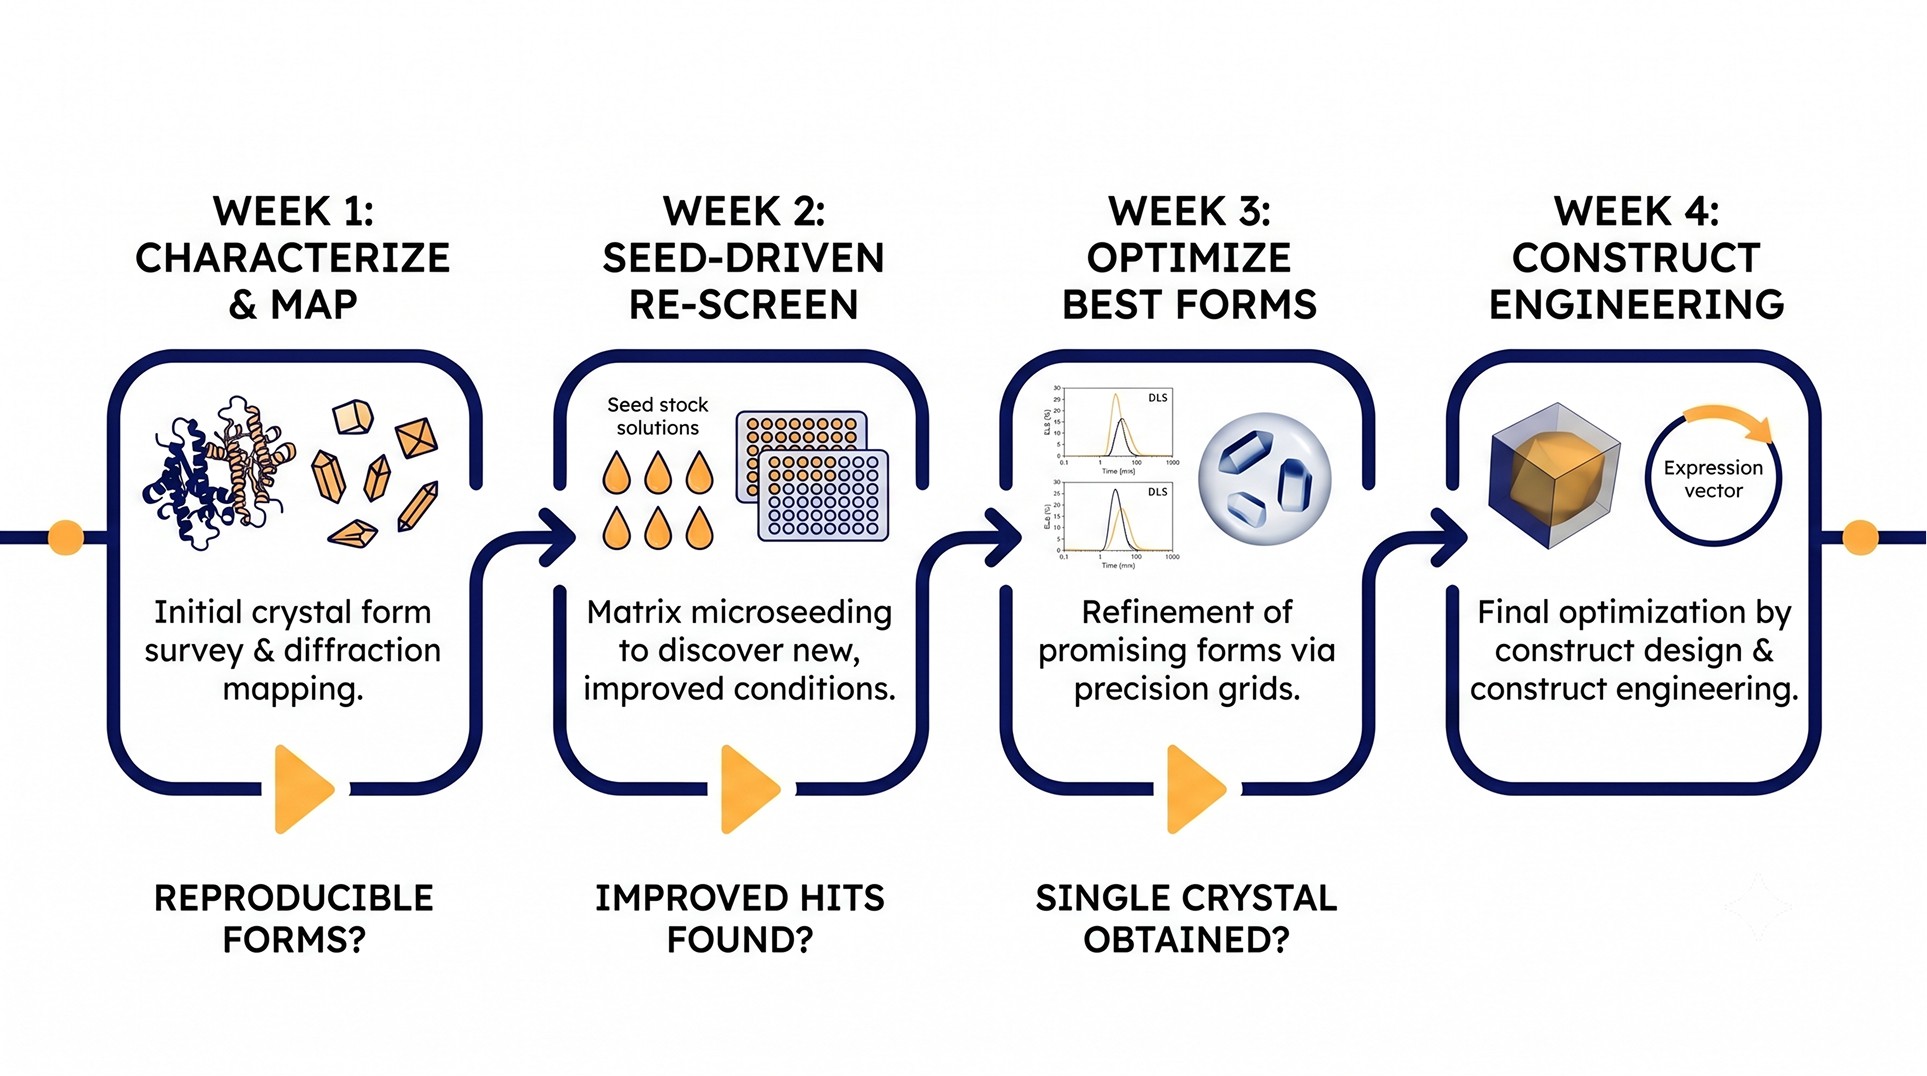
A Concrete Optimization Workflow
For a sparse matrix hit at 20% PEG 3350 / 0.2 M Na citrate / pH 6.5 / 18 °C, three needle clusters, 6 Å diffraction:
Week 1: Characterize and Map
UV imaging on the original drop: confirm protein
Shoot a needle at home source or synchrotron: confirm diffraction, get unit cell
PCT phase diagram: 8 × 8 protein × PEG grid to identify metastable zone
Run an additive screen at the original condition
Take any needle and make a seed stock (5 µL of crushed needles + 50 µL stabilization buffer + Seed Bead, vortex)
Week 2: Seed-Driven Re-Screen
MMS the seed stock into a fresh JCSG+ or PACT screen at 18 °C
MMS the seed stock into a copy of the same screens at 4 °C
Streak seed into a fine grid around the original condition at the metastable edge
Image daily for 14 days
Week 3: Optimize Best Forms
For each new crystal form from Week 2, refine condition with 24- or 48-condition grids around precipitant and pH
Test top 5 additive hits from Week 1 in concentration response
Begin cryoprotectant screening for forms that diffract usefully
Week 4: Construct Considerations
If the best crystal form is still < 3 Å with no further gain, design SER mutants
If the protein shows obvious flexible termini, design truncation constructs
Parallel-track these with chemistry optimization
This is six weeks to either a publishable dataset or a clear answer that the construct needs work. Faster than the "screen and pray" alternative.
The Bottom Line
Stage | Key Question | Decision Point |
|---|---|---|
Hit characterization | Is it protein, and does it diffract? | UV + birefringence + shoot |
Phase mapping | Where is the metastable / labile boundary? | PCT or PEG ladder |
Seeding | Can I separate nucleation from growth? | MMS on every re-screen |
Additives | What mechanism limits my crystal? | Class-by-class follow-up |
Construct | Is the molecule the limit? | SER → trimming → fusion |
Diagnostics | Is the dataset good enough? | I/σI, mosaicity, biology |
The progression is not strictly linear—chemistry and construct work in parallel for any project that lasts more than a month. But the order matters: do not invest in construct engineering before exhausting MMS, and do not run a 1000-condition additive screen before mapping your phase diagram.
Integrating Construct-Level Insight Into Crystallization Workflows
Most optimization decisions—trimming flexible termini, designing SER clusters, choosing a fusion partner, deciding whether deglycosylation is worth a month of expression work—depend on knowing exactly where flexibility, disorder, and surface entropy live in your protein. Pulling that information together by hand is slow.
Orbion's AstraUNFOLD maps predicted disorder, topology, and aggregation-prone regions across the full sequence, giving immediate candidates for terminal truncation and loop replacement. The Construct Design module translates those calls into specific construct variants—truncations, surface entropy mutants, tag and linker configurations, and fusion options for crystallization chaperones—with predicted expression suitability from AstraSUIT and stability changes from AstraDDG and AstraDTM. The Bench module then generates the parallel crystallization optimization protocols—the matrix microseeding plate layouts, the systematic additive follow-ups, the PCT phase diagram screens—so that chemistry and construct work proceed together rather than sequentially.
The crystallographer's job is still to interpret crystals, not to track 30 parallel constructs and 500 conditions. Software should carry that bookkeeping.
References
McPherson A. (1999). Crystallization of Biological Macromolecules. Cold Spring Harbor Laboratory Press. The reference textbook on macromolecular crystallization theory and practice.
D'Arcy A, Villard F, Marsh M. (2007). An automated microseed matrix-screening method for protein crystallization. Acta Crystallographica D, 63(4):550–554. DOI
Bergfors T. (2003). Seeds to crystals. Journal of Structural Biology, 142(1):66–76. DOI
Asherie N. (2004). Protein crystallization and phase diagrams. Methods, 34(3):266–272. DOI
Luft JR, DeTitta GT. (1999). A method to produce microseed stock for use in the crystallization of biological macromolecules. Acta Crystallographica D, 55(5):988–993. DOI
Derewenda ZS. (2011). It's all in the crystals... Acta Crystallographica D, 67(4):243–248. DOI
Goldschmidt L, Cooper DR, Derewenda ZS, Eisenberg D. (2007). Toward rational protein crystallization: A Web server for the design of crystallizable protein variants. Protein Science, 16(8):1569–1576. DOI
Bury CS, Brooks-Bartlett JC, Walsh SP, Garman EF. (2018). Estimate your dose: RADDOSE-3D. Protein Science, 27(1):217–228. DOI
Book a 20-Minute Demo
Sign up free for unlimited Overview runs — summary, sequence-based analysis, homology search. For the full Characterization — PTMs, binding sites, stability variants, construct design — book a demo and we'll run your target live.
