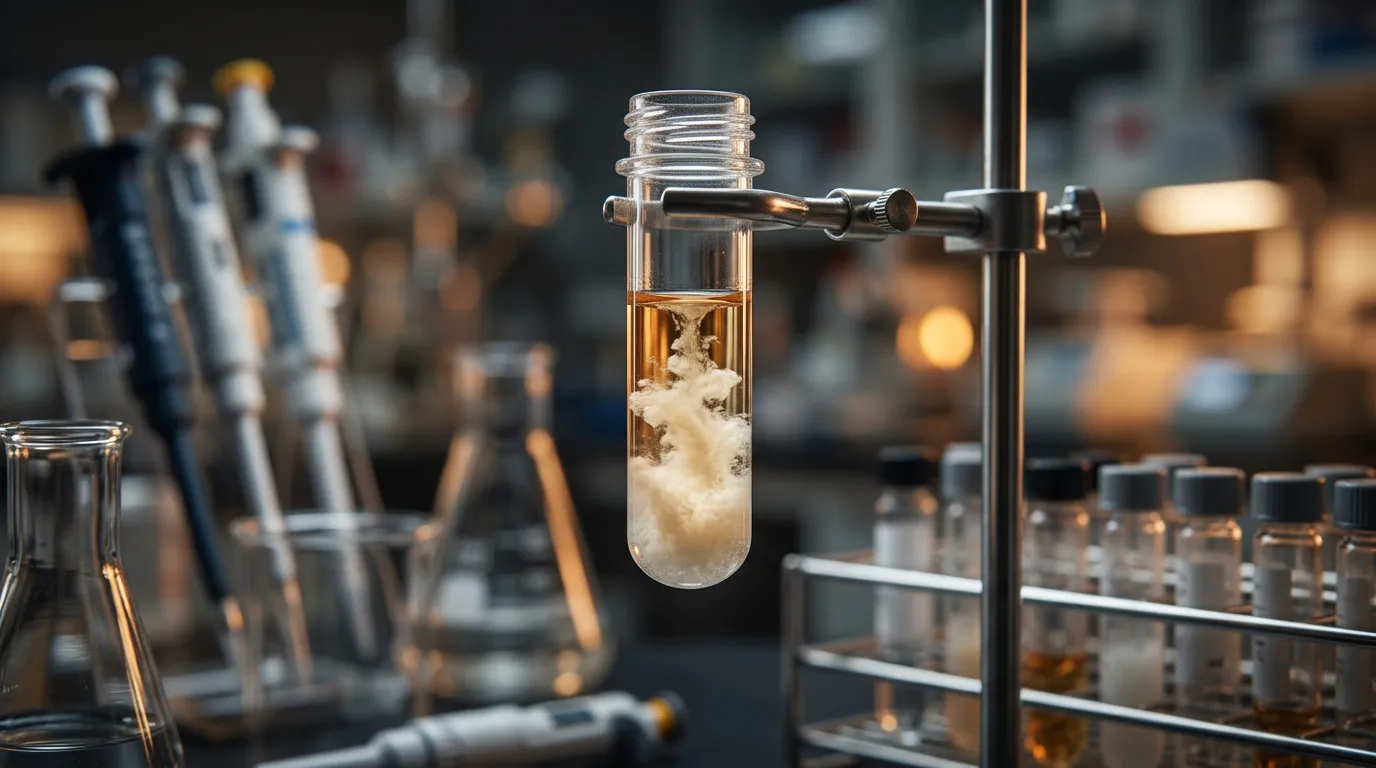
Purification went flawlessly. The SEC trace is a single symmetric peak, the A280 says you have 8 mg spread across 12 mL, and all you need is 5 mg/mL for the crystallization screen. So you load the spin concentrator, drop it in the centrifuge, and come back twenty minutes later to a haze in the retentate and a stubborn film clinging to the membrane. You measure the A280 again. Instead of climbing, your concentration has stalled, or worse, dropped. The protein you spent three weeks purifying is now on the membrane, not in solution.
Concentration failure is one of the most demoralizing steps in protein production precisely because it happens at the finish line. The protein folded. It expressed. It survived purification. And then it fell apart in the last thirty minutes, in a device that costs eight dollars. The good news: this is not bad luck. Precipitation during concentration is governed by colloidal physics you can measure, predict, and design around.
Key Takeaways
- High-concentration aggregation is a colloidal-stability problem, not a folding problem. Whether a concentrated protein stays in solution is governed largely by the sign of its second virial coefficient (B22 / A2): a negative value signals net attraction and predicts precipitation. The classic "crystallization slot" sits at a mildly negative B22 of roughly -1 to -8 x 10⁻⁴ mol·mL/g² (George & Wilson, 1994).
- The membrane surface, not the bulk, is where you lose protein. Concentration polarization builds a boundary layer at the ultrafiltration membrane that can reach local concentrations several-fold higher than the bulk, driving local supersaturation and irreversible aggregation before your average concentration ever looks high (Rosenberg et al., 2009).
- Proximity to the pI is the single most common self-inflicted cause. Near the isoelectric point, net charge approaches zero, electrostatic repulsion collapses, and solubility can drop by one to two orders of magnitude. Increased net negative surface charge correlates with increased solubility (Kramer et al., 2012).
- Ionic strength cuts both ways. Low salt can leave charged proteins under-screened and prone to specific attraction; high salt salts them out via the Hofmeister series. Both extremes precipitate; the safe zone is usually 150 to 300 mM of a well-behaved salt.
- Excipients are cheap insurance. L-arginine (50 to 500 mM) suppresses aggregation without denaturing (Baynes et al., 2005); glycerol and sugars stabilize the folded state through preferential exclusion (Timasheff, 2002).
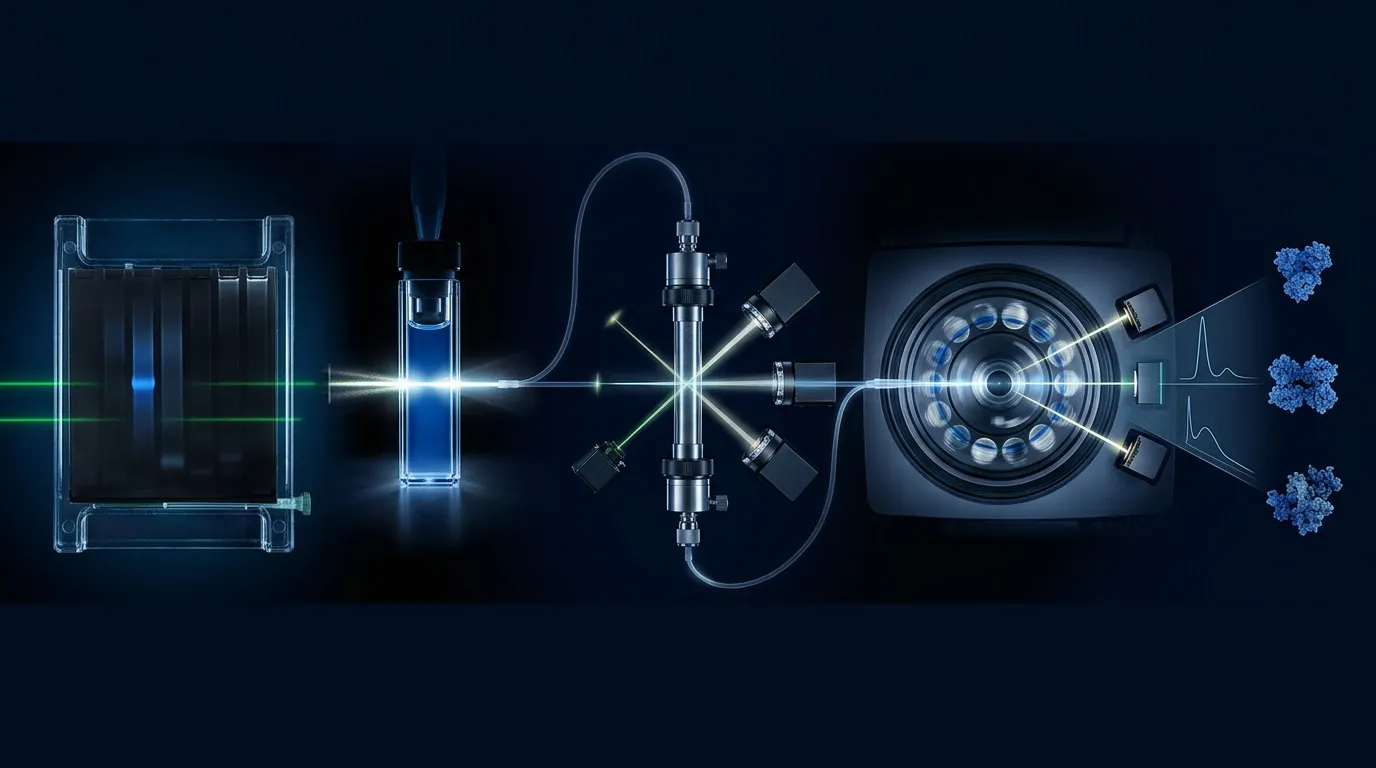
- Diagnose before you redesign. DLS reports polydispersity and early oligomerization in minutes; SEC-MALS separates monomer from soluble aggregate and gives absolute mass; A280 recovery tells you how much protein you actually lost versus how much is hiding.
Introduction
Most protein biochemistry training treats solubility as binary: a protein is either soluble or it is not. That framing works at the low concentrations of an activity assay and fails completely at the concentrations demanded by crystallography, cryo-EM grid preparation, biophysical characterization, and therapeutic formulation. A protein that is perfectly happy at 0.2 mg/mL can be metastable at 2 mg/mL and frankly self-destructive at 20 mg/mL.
The reason is that solubility is not a property of a single molecule. It is a property of a crowded population of molecules interacting with each other. As you concentrate, the average distance between molecules shrinks, weak attractive interactions that were negligible in dilute solution start to dominate, and the free energy landscape tilts toward the condensed phase: crystals if you are lucky, amorphous precipitate if you are not, and soluble oligomers on the way to both.
This article is specifically about the aggregation and precipitation that appears during concentration itself, in spin concentrators, stirred cells, and tangential-flow systems, and during high-concentration formulation. It is not about inclusion bodies during expression, precipitation triggered by buffer exchange or tag cleavage, or refolding. Those have their own failure modes. Here we stay on the concentrator, and we work through the physics of why proteins crowd themselves out of solution and, more importantly, what to do about it.
The Colloidal View: Your Protein Is a Sticky Sphere
The most useful mental model for high-concentration behavior is to stop thinking of your protein as a folded structure and start thinking of it as a colloidal particle carrying a surface of patches: some charged, some hydrophobic, some polar. Whether these particles stay dispersed or clump is a competition between repulsion (mostly electrostatic) and attraction (van der Waals, hydrophobic patch contacts, and specific dipole interactions).
Colloid science captures this balance in a single measurable number: the osmotic second virial coefficient, written B22 or A2. It quantifies the net pairwise interaction between molecules in solution.
- B22 > 0: net repulsion. Molecules prefer to stay apart. The protein tolerates concentration well.
- B22 ≈ 0: interactions cancel. Behavior is near-ideal.
- B22 < 0: net attraction. Molecules prefer to associate. This is the danger zone for aggregation and precipitation.
George and Wilson made the landmark observation that proteins crystallize reliably only within a narrow window of mildly negative B22, the "crystallization slot," roughly -1 to -8 x 10⁻⁴ mol·mL/g² (George & Wilson, 1994). Above that window, molecules are too repulsive to assemble into an ordered lattice; below it, attraction is so strong that they crash out as disordered amorphous precipitate before they can order. The molecular origins of B22, the balance of electrostatic, van der Waals, and hydration forces, were worked out in detail by Neal and colleagues (Neal et al., 1998).
The practical takeaway: your buffer conditions set B22, and B22 predicts what happens when you concentrate. You measure it by static light scattering across a dilution series (SLS), by self-interaction chromatography, or by composition-gradient multi-angle light scattering. If B22 is strongly negative, no amount of careful pipetting will save you at the concentrator. You need to change the solution, not the technique.
Concentration-Dependent Self-Association
A negative B22 tells you molecules attract, but it does not tell you the mechanism. In practice, high-concentration precipitation is usually driven by reversible self-association that becomes irreversible under stress.
At low concentration, a protein with a weak self-association tendency exists almost entirely as monomer because the equilibrium sits far to the left. As you concentrate, mass action pushes the equilibrium toward dimers, then higher oligomers. Most of the time these early oligomers are reversible: dilute the sample and they dissociate. The problem is that reversible oligomers are the on-pathway precursors to irreversible aggregates (Roberts, 2014). Each transient contact is an opportunity for a partially unfolded molecule to lock into a misfolded, aggregation-competent conformation, and once a nucleus forms it grows.
This is why the rate of concentration matters, not just the endpoint. Spending an hour parked at a metastable concentration gives the equilibrium time to sample the irreversible pathway. Reaching your target quickly and immediately diluting or freezing can preserve a sample that would have crashed if left to sit.
What to do: Concentrate in stages and check DLS between stages. If the polydispersity index climbs before you hit your target, you are watching self-association in real time. Back off, adjust the buffer, and try again rather than pushing harder.
Macromolecular Crowding and Excluded Volume
Even without specific attractions, packing molecules close together changes their thermodynamics. Macromolecular crowding is the excluded-volume effect: each molecule occupies space that others cannot, so the effective (thermodynamic) concentration of every species rises faster than its actual concentration (Minton, 2000; Ellis, 2001).
Crowding is a double-edged phenomenon. It stabilizes compact folded states relative to expanded unfolded states, which is protective. But it also dramatically favors any association reaction that reduces total excluded volume, which includes aggregation. At the tens of mg/mL concentrations common in formulation, activity coefficients can deviate from ideality by an order of magnitude or more, so a protein that "should" be soluble by its dilute-solution properties precipitates anyway (Saluja & Kalonia, 2008).
The practical consequence is that you cannot linearly extrapolate solubility. A protein stable to 5 mg/mL is not guaranteed stable to 10 mg/mL, because the interaction terms scale nonlinearly with concentration. Treat each target concentration as its own experiment.
The Membrane Surface: Where You Actually Lose the Protein
Here is the counterintuitive part. In a spin concentrator, the bulk retentate is often nowhere near saturation when precipitation starts. The precipitation happens at the membrane surface, driven by concentration polarization.
Ultrafiltration works by forcing solvent through a membrane while retaining protein. Solvent flux carries protein toward the membrane faster than back-diffusion can carry it away, so a boundary layer builds up against the membrane where local protein concentration is far higher than the bulk. In antibody ultrafiltration, wall concentrations several-fold above the bulk are routine, and this is precisely where irreversible aggregation and gel-layer formation begin (Rosenberg et al., 2009). Once a protein gel deposits on the membrane, it fouls the pores, flux collapses, and your concentration stalls, the classic "it stopped concentrating" symptom.
This mechanism explains several field observations that otherwise seem mysterious:
- The protein you lose is not evenly distributed. It concentrates as a film on the membrane, so A280 of the retentate underreports your total loss.
- Faster spinning makes it worse, not better. Higher flux thickens the boundary layer. Reducing centrifugal speed lowers flux and gives back-diffusion time to work.
- Mixing helps. Gentle resuspension of the retentate every few minutes, or a stirred cell, disrupts the boundary layer and redistributes the polarized protein back into the bulk.
What to do at the concentrator:
- Use the smallest membrane cutoff that still retains your protein (typically a molecular weight cutoff 2 to 3 times below your protein's mass) so you can run at lower flux.
- Spin at a moderate speed. Halving the g-force roughly halves flux and boundary-layer thickness at the cost of time. Time is cheaper than protein.
- Pause and gently pipette-mix the retentate every 5 to 10 minutes.
- Pre-rinse the membrane with buffer to remove glycerol/preservatives that can nucleate aggregation.
- Never let the retentate volume drop so low that the membrane runs partially dry; the exposed film is where irreversible aggregation nucleates.
pH and Proximity to the pI
The most common self-inflicted cause of concentration precipitation is buffering the protein too close to its isoelectric point. At the pI, net charge is zero, so the electrostatic repulsion that keeps molecules apart vanishes, attraction wins, and solubility drops, often by one to two orders of magnitude within a pH unit of the pI.
The corollary, established quantitatively, is that increasing net surface charge increases solubility. Kramer and colleagues showed across a panel of proteins that adding negative surface charge (or moving pH away from the pI) systematically raised solubility, with the effect traceable to specific surface residues (Kramer et al., 2012; Trevino et al., 2008).
What to do:
- Calculate or measure your protein's pI. A sequence-based estimate is a starting point, but surface-exposed residues dominate real behavior, so treat the estimate as approximate.
- Buffer at least 1 pH unit, preferably 2, away from the pI. For an acidic protein (pI 5), work at pH 7.5 to 8; for a basic protein (pI 9), work at pH 6.5 to 7.
- If your downstream assay forces you near the pI, compensate with excipients (arginine) and lower target concentrations.
- Screen pH first. A pH screen is the single highest-yield solubility experiment you can run, and it costs a few buffers and an afternoon.
Ionic Strength and the Hofmeister Series
Salt is not a monotonic knob. Its effect on solubility is biphasic and ion-specific.
At low ionic strength, charged proteins are under-screened. Long-range electrostatics dominate, which can be repulsive (good) but can also drive specific attractive dipole and patch interactions if the charge distribution is anisotropic. Many proteins are actually less soluble in pure low-salt buffer than in physiological salt because the screening is uneven.
At high ionic strength, you enter salting-out territory, governed by the Hofmeister series (Kunz et al., 2004). Kosmotropic anions (sulfate, phosphate, citrate) strongly promote precipitation by competing for water and increasing the free energy of the protein's hydration shell; chaotropic ions (thiocyanate, perchlorate) do the opposite but can destabilize the fold. The classic ranking for anions from salting-out to salting-in:
SO4^2-  >  HPO4^2-  >  citrate  >  acetate  >  Cl-  >  NO3-  >  ClO4-  >  SCN-
   (stabilize / salt out)                              (destabilize / salt in)
What to do:
- Start at 150 to 300 mM NaCl. This screens electrostatics without approaching salting-out for most proteins.
- If precipitation appears at low salt, add salt. If it appears at high salt, that is salting-out, so dilute.
- Avoid high sulfate, phosphate, and citrate in the final concentration buffer unless you are deliberately crystallizing. They are excellent precipitants, which is exactly the problem.
- If a protein needs stabilization but salt is causing trouble, switch the stabilizing burden to a non-ionic excipient (below).
Excipients: Arginine, Glycerol, Sugars, and Surfactants
When buffer optimization is not enough, additives buy you real headroom.
L-Arginine is the workhorse aggregation suppressant. It does not stabilize the folded state and does not facilitate refolding; instead it specifically suppresses protein-protein association, likely by interacting with aromatic and charged surface patches and by weakening the attractive interactions that drive clustering (Arakawa & Tsumoto, 2003; Baynes et al., 2005). Used at 50 to 500 mM, arginine (usually as arginine-HCl or arginine-glutamate) can raise achievable concentration severalfold with minimal downside. Arginine-glutamate is often gentler on activity and viscosity than the chloride salt.
Glycerol and sugars (sucrose, trehalose) work by a different mechanism: preferential exclusion. These cosolutes are excluded from the protein surface, which raises the free energy of the expanded unfolded state more than the compact folded state, shifting equilibrium toward the native, less aggregation-prone conformation (Timasheff, 2002; Kendrick et al., 1997). Glycerol at 5 to 10% and sucrose or trehalose at 5 to 10% (w/v) are standard. The cost is viscosity, which matters at the concentrator because it slows flux.
Non-ionic surfactants (polysorbate 20/80, poloxamer 188) at 0.01 to 0.05% protect against interface-induced aggregation, the air-water and membrane-water interfaces where partially unfolded molecules accumulate. These are especially valuable during the mechanical stress of ultrafiltration.
| Excipient | Typical range | Mechanism | Watch out for |
|---|---|---|---|
| L-Arginine (HCl or glutamate) | 50-500 mM | Suppresses self-association | Adds ionic strength; can lower pH |
| Glycerol | 5-10% | Preferential exclusion | Increases viscosity, slows flux |
| Sucrose / trehalose | 5-10% (w/v) | Preferential exclusion | Viscosity; hydrolysis at low pH (sucrose) |
| Polysorbate 20/80 | 0.01-0.05% | Coats interfaces | Oxidative degradation over time |
| Additional NaCl | to 150-300 mM | Screens electrostatics | Salting-out at high concentration |
Reversible vs Irreversible Aggregation
Not all aggregation is equal, and knowing which you have determines whether you can recover the material.
Reversible aggregation dissociates on dilution or with a mild change in conditions. Reversible self-association, the equilibrium oligomers discussed above, is annoying but recoverable: dilute, adjust the buffer, and reconcentrate more carefully. A clean diagnostic is that A280 recovery on dilution matches your expected total.
Irreversible aggregation does not come back. It involves conformational change, usually partial unfolding that exposes hydrophobic core, followed by intermolecular contacts that bury that core between molecules rather than within one (Chi et al., 2003; Wang, 2005). Once formed, irreversible aggregates are dead weight: you filter or spin them out and lose that protein permanently.
The bridge between the two is stress. Reversible oligomers are metastable. Give them time, an interface, a temperature excursion, or repeated freeze-thaw, and a fraction converts to the irreversible pathway on every cycle. This is why the same protein can survive one careful concentration and crash on the second attempt after sitting in the fridge overnight: the population slowly ratcheted down the irreversible pathway.
What to do: Test reversibility explicitly. Take a slightly hazy sample, dilute it 10-fold into fresh buffer, and re-read A280 and DLS. If the haze clears and monomer returns, you have a reversible problem you can engineer around. If it does not, you are past the point of no return and need to prevent it upstream next time.
Temperature and Mechanical Stress
Two operational variables quietly determine success.
Temperature affects both thermodynamics and kinetics. For most proteins, keeping everything at 4°C slows the conformational fluctuations that seed irreversible aggregation and reduces the rate of on-pathway conversion. Some proteins, however, show inverse solubility (they aggregate on cooling, cold denaturation, or precipitate at 4°C via lowered solubility of specific salts). The rule is: concentrate cold by default, but if you see cold-induced haze, test at room temperature. Chill the centrifuge rotor in advance; a rotor that warms during a long spin defeats the purpose.
Mechanical and interfacial stress during ultrafiltration is underappreciated. Every pass over the membrane, every bubble, every vortex-mix creates air-water interface where molecules partially unfold and aggregate. Minimize foaming, avoid vortexing concentrated protein, pipette gently, and use a surfactant if the protein is interface-sensitive.
Diagnosis: DLS, SEC-MALS, and A280 Recovery
You cannot fix what you cannot see. Three orthogonal measurements cover the diagnostic space.
Dynamic light scattering (DLS) is fast, low-volume, and non-destructive. It reports hydrodynamic radius and, critically, polydispersity. A monodisperse sample (PDI < 0.1, or < ~15% in size) is behaving. Rising polydispersity or a second population at larger radius is your earliest warning of oligomerization, often visible before any haze. Run DLS between concentration stages as an early-warning system.
SEC-MALS (size-exclusion chromatography with multi-angle light scattering) separates species and assigns each an absolute molar mass independent of column calibration (Some, 2013). This distinguishes true monomer from soluble dimer and higher oligomer, quantifies the aggregate fraction, and catches the soluble aggregates that DLS lumps together and that a simple A280 misses entirely. Run it before and after concentration to measure exactly what the process did to your sample.
A280 recovery is the accounting check. Compare total protein (concentration x volume) before and after concentration. A shortfall is protein lost to the membrane or to pelletable precipitate. This simple mass balance tells you whether your "low yield" is a concentration problem or was never there to begin with.
For the underlying interaction, B22 by static light scattering or self-interaction chromatography closes the loop: it tells you whether the buffer itself is the problem before you ever load the concentrator.
| Method | Reports | Volume | Speed | Best for |
|---|---|---|---|---|
| DLS | Rh, polydispersity | 2-20 µL | Minutes | Early oligomerization warning |
| SEC-MALS | Absolute mass per species, aggregate % | 50-100 µg | ~30 min | Quantifying monomer vs soluble aggregate |
| A280 recovery | Total protein mass balance | Trivial | Seconds | Measuring actual loss |
| SLS / B22 | Net pairwise interaction | Dilution series | ~1 hr | Diagnosing the buffer before concentrating |
Case Study: A 42 kDa Kinase Domain That Would Not Pass 3 mg/mL
Problem. A structural biology group needed a 42 kDa kinase domain at 10 mg/mL for a crystallization screen. Expression in E. coli was strong, IMAC and SEC gave a clean monomer, and the final SEC pool at 0.6 mg/mL looked perfect. In the spin concentrator, a haze appeared around 2.5 mg/mL, flux collapsed by 4 mg/mL, and A280 recovery showed 35% of the protein was gone. Two full preps failed the same way.
Diagnosis. DLS on the SEC pool showed monodisperse monomer, so the starting material was fine. DLS during concentration showed polydispersity climbing sharply above 2 mg/mL, with a large-radius population appearing, classic concentration-driven self-association. The final buffer was 20 mM MES pH 6.5, 50 mM NaCl. The team's own pI estimate for the construct was 6.7. They were concentrating the protein within 0.2 units of its isoelectric point in low salt: net charge near zero and electrostatics under-screened, a textbook recipe for attraction-dominated precipitation. A dilution test on the haze showed partial reversibility early but none after the sample sat, indicating the reversible oligomers were converting irreversibly over the 25-minute spin.
Solution. They made three changes at once, guided by the diagnosis. First, they moved the buffer to 25 mM HEPES pH 7.8, roughly 1.1 units above the pI, restoring net negative charge. Second, they raised NaCl to 200 mM to screen residual electrostatic attraction and added 100 mM L-arginine-glutamate to suppress self-association. Third, they changed the concentrator protocol: a 10 kDa cutoff run at reduced speed with gentle pipette-mixing every 5 minutes, at 4°C in a pre-chilled rotor.
Outcome. The protein reached 11 mg/mL with 92% A280 recovery and a monodisperse DLS profile. SEC-MALS on the concentrated sample showed 96% monomer. Crystallization screens set up from this material produced hits within two weeks. The total intervention cost a day of buffer screening and a bottle of arginine, against two lost preps of roughly three weeks each.
Practical Tools: The Concentration-Precipitation Decision Tree
Work top to bottom. Each branch is actionable.
Protein precipitates during concentration?
│
├── STEP 1: Where is the loss? (A280 recovery + DLS)
│   ├── A280 recovery high, no haze, just slow → membrane fouling / polarization
│   │      → lower spin speed, mix retentate, smaller MWCO, don't run dry  (go to STEP 5)
│   └── A280 recovery low + haze/pellet → real aggregation (continue)
│
├── STEP 2: Is it reversible? (dilute 10x, re-read A280 + DLS)
│   ├── Clears on dilution → reversible self-association
│   │      → concentrate faster to target, then dilute/freeze; add arginine (STEP 4)
│   └── Does not clear → irreversible; you can't recover THIS batch
│          → fix conditions and prevent next time (continue)
│
├── STEP 3: Fix the buffer (highest yield first)
│   ├── (a) pH: is it within 1 unit of the pI?
│   │        → move pH ≥1-2 units away from pI (acidic protein → higher pH)
│   ├── (b) Ionic strength: at very low salt?
│   │        → raise NaCl to 150-300 mM
│   │      … precipitates at HIGH salt instead?
│   │        → that's salting-out: lower salt; avoid sulfate/phosphate/citrate
│   └── Re-test concentration after each single change
│
├── STEP 4: Add excipients (if buffer alone insufficient)
│   ├── L-arginine 50-500 mM (first choice for self-association)
│   ├── Glycerol 5-10% or sucrose/trehalose 5-10% (fold stabilization)
│   └── Polysorbate 0.01-0.05% (interface / mechanical stress)
│
├── STEP 5: Fix the process (the concentrator itself)
│   ├── Lower centrifugal speed (reduce flux → thinner boundary layer)
│   ├── Pipette-mix retentate every 5-10 min
│   ├── MWCO 2-3x below protein mass; pre-rinse membrane
│   ├── Keep everything at 4°C (pre-chill rotor) unless cold-sensitive
│   └── Never let the membrane run dry; stop above 50-100 µL
│
└── STEP 6: Still failing? It's the molecule, not the method
    → the sequence has intrinsic solubility/aggregation liabilities
    → predict hotspots and redesign the construct (see Orbion, below)
Pre-concentration checklist (run this every time):
- Confirmed target concentration is actually required (do you need 10 mg/mL or will 3 do?)
- Buffer pH is ≥ 1 unit from the estimated pI
- Ionic strength is 150-300 mM (not near-zero, not salting-out)
- No high sulfate/phosphate/citrate in the final buffer
- DLS on the starting pool is monodisperse (PDI < 0.1)
- MWCO chosen 2-3x below protein mass; membrane pre-rinsed
- Rotor pre-chilled to 4°C (or RT if cold-sensitive)
- Arginine / glycerol on hand if the first attempt hazes
- Plan to mix retentate and check A280 in stages, not one long spin
The Economics of Getting It Wrong
Concentration failure is expensive in a way that hides in plain sight, because the cost is your time, not a line item.
Consider a typical structural biology or biophysics prep. A single batch of purified protein represents roughly:
- 1 week of cloning/expression setup (amortized)
- 3 to 5 days of expression and cell harvest
- 3 to 5 days of multi-step purification
- Consumables and column resin: several hundred euros per prep
Call it three weeks of scientist time per batch. When a prep dies at the concentrator, you lose the entire batch, not just the concentration step, because you cannot recover irreversibly aggregated protein. Two failed preps, the common pattern before someone stops and diagnoses, is six weeks of lost work and a delayed project milestone. At a fully loaded cost of a mid-level scientist, six weeks runs well into five figures in salary alone, before counting the opportunity cost of a stalled crystallization or grid-optimization campaign.
Now compare the cost of prevention. A pH-and-salt buffer screen is one afternoon and a handful of buffers. A DLS check between concentration stages is minutes per read. A bottle of L-arginine costs less than a single column. B22 measurement, if you have access to SLS, is an hour. The entire diagnostic and prevention toolkit costs, generously, one to two days of work and under a few hundred euros in reagents.
The asymmetry is stark: two days of characterization to avoid six weeks of repeated failure. And the leverage compounds, because a protein that precipitates at the concentrator today will precipitate again at every future concentration, in formulation, and in storage. Solving it once pays out across the entire lifetime of the construct.
The deeper economic argument is to move the decision upstream. The cheapest failed prep is the one you never run. If you can flag a high-aggregation-risk sequence before cloning and redesign the construct, you skip the expression, purification, and concentration cycles entirely.
The Bottom Line
Precipitation during concentration is predictable physics, not bad luck. A concentrated protein stays in solution when repulsion beats attraction, and you control that balance. The sign of B22 tells you which way the balance tips; pH relative to the pI, ionic strength, and excipients let you move it. The membrane surface, not the bulk, is usually where the loss happens, so process matters as much as buffer: slower flux, gentle mixing, and never running dry. Diagnose with DLS, SEC-MALS, and A280 recovery before you assume the worst, and test reversibility before you write off a batch. When the buffer and the process are both optimized and the protein still crashes, the liability is in the sequence, and the fix is construct redesign, done before you ever touch a concentrator.
How Orbion Helps You Predict This Before the Concentrator
The most expensive concentration failures are the ones you could have seen coming from the sequence. Orbion is a computational platform, so it will not run your ultrafiltration for you, but it will tell you which proteins are going to fight you before you invest three weeks in a prep.
In the Characterization module, AstraUNFOLD provides two per-residue tracks that speak directly to concentration behavior: a per-residue disorder probability and a per-residue amyloid propensity. Disordered and aggregation-prone stretches are the surface patches that drive self-association and the exposed hydrophobic segments that seed irreversible aggregation under crowding. Seeing them mapped onto your sequence tells you, in minutes, whether this protein carries intrinsic solubility liabilities, and where they are, before you decide how hard to push at the concentrator.
When a protein does carry liabilities, the Design tab lets you engineer around them instead of accepting them. It proposes constructs, solubility fusions (MBP, SUMO, NusA, TrxA, and others from the component library), and truncations that trim disordered or aggregation-prone termini, and it scores every construct on solubility, disorder, and aggregation so you can compare candidates against the wild-type reference and shortlist the ones most likely to survive concentration. These are sequence- and structure-based predictions, not guarantees, but they let you spend your bench time on the constructs with the best odds rather than discovering the problem at 3 mg/mL.
Upload your sequence, read the AstraUNFOLD tracks, and design your construct with concentration in mind. It is a great deal cheaper than losing the batch at the finish line.
References
-
George A, Wilson WW. (1994). Predicting protein crystallization from a dilute solution property. Acta Crystallographica Section D, 50(4):361-365. DOI: 10.1107/S0907444994001216
-
Neal BL, Asthagiri D, Lenhoff AM. (1998). Molecular origins of osmotic second virial coefficients of proteins. Biophysical Journal, 75(5):2469-2477. DOI: 10.1016/S0006-3495(98)77691-X
-
Chi EY, Krishnan S, Randolph TW, Carpenter JF. (2003). Physical stability of proteins in aqueous solution: mechanism and driving forces in nonnative protein aggregation. Pharmaceutical Research, 20(9):1325-1336. DOI: 10.1023/A:1025771421906
-
Wang W. (2005). Protein aggregation and its inhibition in biopharmaceutics. International Journal of Pharmaceutics, 289(1-2):1-30. DOI: 10.1016/j.ijpharm.2004.11.014
-
Shire SJ, Shahrokh Z, Liu J. (2004). Challenges in the development of high protein concentration formulations. Journal of Pharmaceutical Sciences, 93(6):1390-1402. DOI: 10.1002/jps.20079
-
Kramer RM, Shende VR, Motl N, Pace CN, Scholtz JM. (2012). Toward a molecular understanding of protein solubility: increased negative surface charge correlates with increased solubility. Biophysical Journal, 102(8):1907-1915. DOI: 10.1016/j.bpj.2012.01.060
-
Trevino SR, Scholtz JM, Pace CN. (2008). Measuring and increasing protein solubility. Journal of Pharmaceutical Sciences, 97(10):4155-4166. DOI: 10.1002/jps.21327
-
Kunz W, Henle J, Ninham BW. (2004). 'Zur Lehre von der Wirkung der Salze' (about the science of the effect of salts): Franz Hofmeister's historical papers. Current Opinion in Colloid & Interface Science, 9(1-2):19-37. DOI: 10.1016/j.cocis.2004.05.005
-
Arakawa T, Tsumoto K. (2003). The effects of arginine on refolding of aggregated proteins: not facilitate refolding, but suppress aggregation. Biochemical and Biophysical Research Communications, 304(1):148-152. DOI: 10.1016/S0006-291X(03)00578-3
-
Baynes BM, Wang DIC, Trout BL. (2005). Role of arginine in the stabilization of proteins against aggregation. Biochemistry, 44(12):4919-4925. DOI: 10.1021/bi047528r
-
Timasheff SN. (2002). Protein-solvent preferential interactions, protein hydration, and the modulation of biochemical reactions by solvent components. Proceedings of the National Academy of Sciences USA, 99(15):9721-9726. DOI: 10.1073/pnas.122225399
-
Kendrick BS, Chang BS, Arakawa T, Peterson B, Randolph TW, Manning MC, Carpenter JF. (1997). Preferential exclusion of sucrose from recombinant interleukin-1 receptor antagonist provides stabilization against aggregation and structural changes. Proceedings of the National Academy of Sciences USA, 94(22):11917-11922. DOI: 10.1073/pnas.94.22.11917
-
Minton AP. (2000). Implications of macromolecular crowding for protein assembly. Current Opinion in Structural Biology, 10(1):34-39. DOI: 10.1016/S0959-440X(99)00045-7
-
Ellis RJ. (2001). Macromolecular crowding: obvious but underappreciated. Trends in Biochemical Sciences, 26(10):597-604. DOI: 10.1016/S0968-0004(01)01938-7
-
Saluja A, Kalonia DS. (2008). Nature and consequences of protein-protein interactions in high protein concentration solutions. International Journal of Pharmaceutics, 358(1-2):1-15. DOI: 10.1016/j.ijpharm.2008.03.041
-
Rosenberg E, Hepbildikler S, Kuhne W, Winter G. (2009). Ultrafiltration concentration of monoclonal antibody solutions: development of an optimized method minimizing aggregation. Journal of Membrane Science, 342(1-2):50-59. DOI: 10.1016/j.memsci.2009.06.028
-
Roberts CJ. (2014). Therapeutic protein aggregation: mechanisms, design, and control. Trends in Biotechnology, 32(7):372-380. DOI: 10.1016/j.tibtech.2014.05.005
-
Some D. (2013). Light-scattering-based analysis of biomolecular interactions. Biophysical Reviews, 5(2):147-158. DOI: 10.1007/s12551-013-0107-1