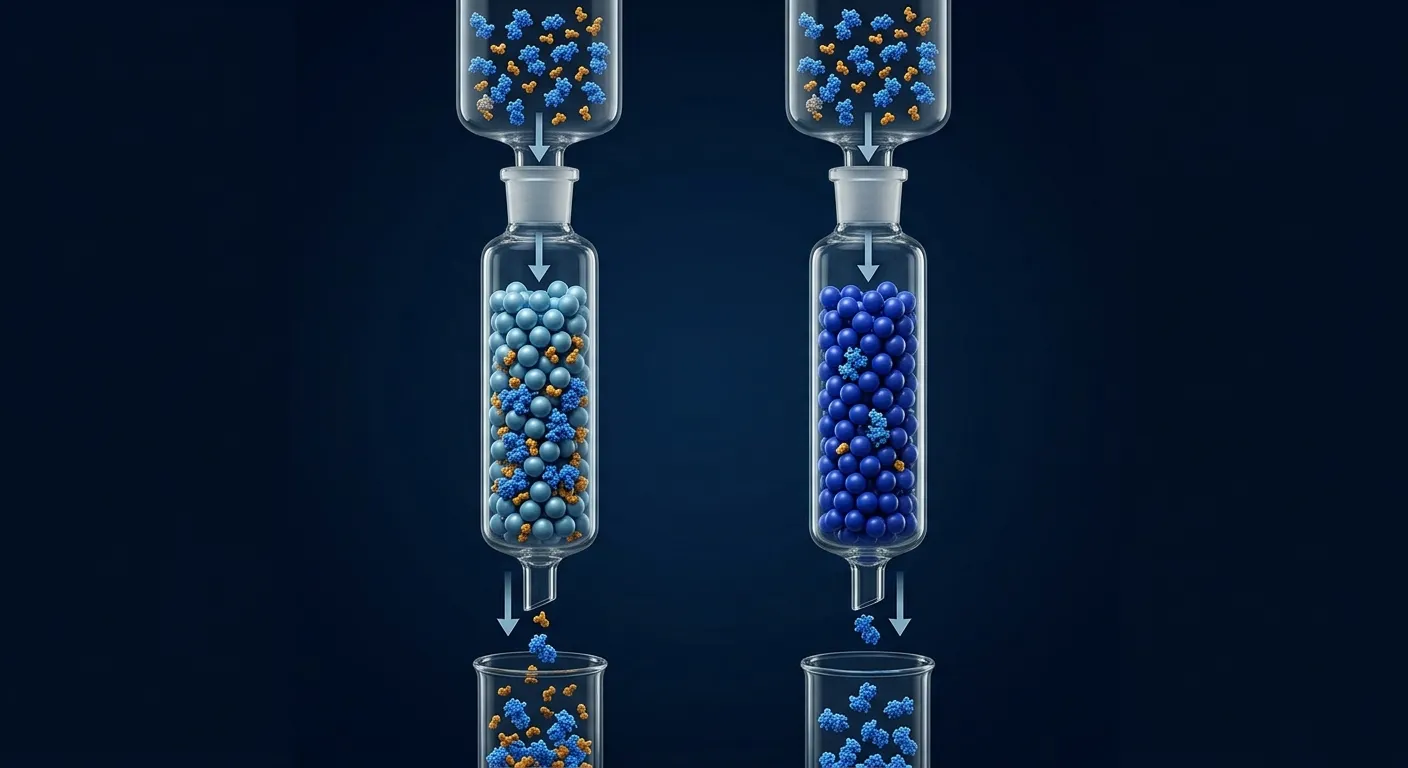
Native PAGE says dimer. DLS reports a radius too large for a dimer. SEC-MALS gives mostly monomer with a rising mass across the peak, and AUC resolves two concentration-dependent species. Which result is correct? Possibly all of them—because they observe different physical properties under different concentrations, surfaces, time scales, and models.
Oligomerization is an equilibrium, not a label. Native PAGE measures migration in a gel, DLS weights scattered light toward large particles, SEC-MALS measures molar mass during chromatographic dilution and separation, and analytical ultracentrifugation (AUC) observes sedimentation in free solution. Trust the method whose observable matches the question, then verify with an orthogonal technique.
Key Takeaways
- Native PAGE is a fast state screen, not an absolute-mass measurement. Charge, shape, dye, and detergent change migration.
- DLS is exquisitely sensitive to aggregates. A tiny mass fraction of large particles can dominate intensity and make an oligomer look enormous.
- SEC-MALS measures molar mass across a separated peak. It is powerful for stable species but can perturb fast equilibria through dilution and column interaction.
- AUC measures solution behavior without a matrix. It can resolve interacting species and estimate affinities, but requires careful models and more expertise.
- Concentration is part of the result. A monomer at 1 µM and dimer at 100 µM are not contradictory observations.
- For membrane proteins, separate protein mass from detergent/lipid mass. Otherwise the particle mass is not the oligomer mass.
Start With the Biological Question
Different questions demand different evidence:
| Question | Best first method | Why |
|---|---|---|
| Is my prep monodisperse before crystallization? | DLS or analytical SEC | fast, low-volume screen |
| What is the molar mass of the main soluble peak? | SEC-MALS | direct mass during separation |
| Are monomer and dimer in reversible equilibrium? | concentration-series AUC or SEC-MALS | resolves concentration dependence |
| Is a membrane protein assembled in detergent? | contrast-aware SEC-MALS/AUC + native PAGE | separates or controls detergent contribution |
| Does one mutation disrupt an oligomer? | matched orthogonal panel | guards against shape or stability artifacts |
| What species exists in cells? | cellular crosslinking/native MS/imaging | purified-solution methods cannot answer alone |
If the claim is “this protein is a physiological tetramer,” no single purified-sample assay is enough. Establish solution stoichiometry, concentration dependence, function, and cellular relevance.
Native PAGE: Fast, Visual, and Non-Absolute
Native PAGE retains more noncovalent structure than SDS-PAGE and separates species by a combination of charge, size, and shape. Blue native PAGE (BN-PAGE) uses Coomassie dye to confer negative charge and is especially useful for membrane-protein complexes.
What it does well
- screens many fractions or conditions quickly;
- reveals gross aggregation and discrete state changes;
- detects stable complexes;
- works with less material than many biophysical methods;
- can compare detergent conditions for membrane proteins.
BN-PAGE monodispersity has correlated with membrane-protein crystallization behavior and has reproduced known oligomeric states in useful screening settings (Loll et al., 2008).
What can mislead you
Native migration is not determined by mass alone. An elongated monomer can migrate like a compact oligomer. Bound dye, lipid, detergent, and unusual charge shift the band. Complexes can dissociate during electrophoresis or assemble at high local concentration.
Use native PAGE to say “these conditions differ” or “a discrete complex is present.” Do not derive a precise dissociation constant or absolute mass from a ladder position.
DLS: A Sensitive Alarm for Large Particles
Dynamic light scattering measures fluctuations in scattered light caused by diffusion and converts them into a hydrodynamic size. It is rapid, nondestructive, and uses little sample.
What it does well
- detects dust, aggregates, and broad heterogeneity;
- ranks buffer conditions;
- tracks changes over time or temperature;
- estimates hydrodynamic radius for a predominantly monodisperse sample.
Why a little aggregate dominates
Scattering intensity increases steeply with particle size in the Rayleigh regime. A small number of large particles can overwhelm the signal from many monomers. That makes DLS a superb aggregation warning and a poor standalone oligomer counter.
Commercial outputs may show intensity-, volume-, or number-weighted distributions. Transforming between them depends on optical and shape assumptions. Recent metrology work highlights how distribution choice and inversion methods can shift reported central values substantially (Mason et al., 2024).
Good DLS practice
- clarify by centrifugation and use clean, low-binding consumables;
- measure buffer and blank controls;
- repeat acquisitions and inspect correlation quality;
- report concentration, temperature, viscosity model, z-average, and polydispersity;
- compare samples at identical concentration;
- confirm large-size changes with SEC or microscopy.
If filtering changes the result, determine whether the filter removed aggregate, shed particles, or adsorbed the target. Filters themselves can introduce particles and protein loss (Liu et al., 2012).
SEC-MALS: Absolute Mass, With Chromatographic Caveats
Size-exclusion chromatography separates particles by hydrodynamic behavior. Multi-angle light scattering measures scattered intensity across the elution peak; combined with concentration from UV or refractive index, it yields molar mass without relying on globular SEC standards.
What it does well
- assigns molar mass across a resolved peak;
- separates aggregates before mass measurement;
- detects mass gradients across a peak;
- distinguishes an expanded monomer from a compact oligomer better than SEC alone;
- can analyze conjugates or protein–detergent complexes with appropriate multi-detector models.
What can mislead you
The sample is diluted on the column. A weak dimer may dissociate during the run and appear monomeric. Conversely, nonspecific interaction with the matrix can broaden peaks or shift apparent behavior. MALS mass depends on accurate concentration and the refractive-index increment (dn/dc); wrong extinction coefficients or mixed protein–detergent particles bias the result.
For a rapid equilibrium, inject several concentrations. A mass that changes across the peak or with load concentration contains mechanistic information rather than merely “bad chromatography.”
For membrane proteins, use a conjugate analysis that accounts for detergent or lipid separately. Studies of mechanosensitive channels demonstrate how detergent can alter measured oligomeric state and why SEC-MALS and AUC benefit from matched detergent controls (Dorwart et al., 2010).
Our article on SEC void-volume behavior covers the case where no useful main peak forms.
AUC: Free-Solution Resolution of Mass, Shape, and Interaction
Analytical ultracentrifugation measures how macromolecules sediment and diffuse under centrifugal force. Sedimentation velocity (SV-AUC) resolves distributions of sedimentation coefficients; sedimentation equilibrium (SE-AUC) can determine molar mass and association equilibria without relying on particle shape in the same way.
What it does well
- avoids a chromatography matrix;
- observes species in the actual solution buffer;
- resolves reversible self-association across concentrations;
- detects small amounts of aggregate;
- can globally fit association models and estimate dissociation constants;
- accommodates broad sizes and many complexes.
What can mislead you
Sedimentation coefficient depends on mass, shape, buoyancy, and solvent. A single peak is not automatically a single stoichiometry. Global fitting can produce precise-looking parameters for the wrong interaction model. Buffer density, viscosity, partial specific volume, and nonideality matter.
AUC reviews emphasize experimental design across rotor speeds, concentrations, and detection systems rather than treating one sedimentation trace as a mass readout (Lebowitz et al., 2002; Cole et al., 2008).
How to Reconcile Conflicting Results
Step 1: Match concentration and buffer
Record the concentration actually present during measurement, not only the stock concentration. SEC dilutes; native PAGE concentrates species in a band; DLS may use higher concentrations for signal; AUC spans a cell with possible nonideality.
Repeat at overlapping concentrations and in the same buffer.
Step 2: Separate “large particle” from “specific oligomer”
DLS sees a larger radius but cannot identify whether it is dimer, aggregate, or dust. SEC-MALS or AUC can resolve the mass distribution.
Step 3: Separate shape from mass
SEC and native PAGE respond to hydrodynamic size/shape. SEC-MALS adds absolute mass; AUC combines sedimentation and diffusion information. An elongated monomer can look “dimer-sized” by SEC.
Step 4: Test reversibility
Dilute and reconcentrate. Run a concentration series. A reversible monomer–dimer equilibrium shifts predictably; irreversible aggregate often shows hysteresis and time dependence.
Step 5: Test function
If only one fraction or state is active, couple stoichiometry to function. An oligomeric mass without functional relevance may be a purification artifact.
Step 6: Test an interface perturbation
Mutate a structurally plausible interface without destabilizing the fold. If stoichiometry and activity change together across orthogonal assays, the biological claim strengthens.
Decision Tree: Which Result to Trust?
Native PAGE shows a discrete dimer, SEC-MALS shows monomer
Check whether the complex dissociates during SEC dilution. Run SEC-MALS at multiple loads and AUC at the native-PAGE concentration. Also test whether dye or gel conditions stabilize the complex.
DLS reports a huge particle, SEC shows one main peak
Inspect raw DLS correlation data and intensity distribution. Look for a tiny aggregate population, dust, or carryover. Compare before and after gentle centrifugation; examine the SEC void fraction.
SEC-MALS mass slopes across the peak
A decreasing mass toward the dilute tail often indicates reversible association. It can also reflect mixed species or concentration-detector mismatch. Repeat at several loads and consider global AUC.
AUC resolves monomer and dimer, native PAGE shows one band
The gel may not resolve species, or exchange may occur during migration. AUC is stronger evidence for the solution equilibrium if the model and controls are sound.
All methods show different states for a membrane protein
Normalize detergent, lipid, and protein concentration. Account for bound amphiphile in mass models. The reconstitution environment may genuinely shift stoichiometry.
Crystal or AlphaFold model shows an oligomer, solution methods do not
A structural interface is a hypothesis. Crystal packing and prediction priors can create plausible contacts. Our article on solution dimers versus crystal monomers covers the evidence hierarchy.
A Minimal Orthogonal Workflow
For a soluble protein:
- analytical SEC across three load concentrations;
- DLS on the same fractions as a rapid heterogeneity check;
- SEC-MALS for absolute mass across the main peak;
- SV-AUC when association is weak, dynamic, or unresolved;
- activity and interface perturbation at matched concentrations.
For a membrane protein:
- BN-PAGE across detergent/reconstitution conditions;
- SEC profile and detergent-only blank;
- conjugate-aware SEC-MALS or density-matched AUC;
- crosslinking or native MS as an independent stoichiometry check;
- functional assay in the same amphiphile environment.
Concentration, Time, and Temperature Define the Equilibrium
For a simple monomer–dimer equilibrium, the observed fraction of dimer depends on total concentration and the dissociation constant. Every measurement therefore needs a concentration range that brackets the expected transition. A single point far below or above that range contains little affinity information.
Time matters when exchange is slow. SEC may physically separate monomer and dimer if interconversion is slower than the run; a fast equilibrium produces a concentration-dependent average mass and asymmetric peak. Native PAGE can trap states during migration. AUC can model exchange, but only if the experiment spans suitable concentrations and rotor conditions.
Temperature can change association enthalpy, viscosity, diffusion, and protein stability simultaneously. Compare methods at the same temperature or correct the physical parameters explicitly. A dimer observed cold during purification may not dominate at assay temperature.
How to Report an Oligomerization Claim
State:
- protein construct, tag state, and PTMs;
- buffer, pH, salt, cofactors, detergent/lipid, and reducing agent;
- protein concentration before and during measurement;
- temperature and incubation time;
- method-specific model and assumptions;
- measured mass or sedimentation distribution with uncertainty;
- aggregate fraction and sample handling;
- orthogonal confirmation and functional consequence.
Avoid “the protein is a dimer” when the evidence supports “the construct forms a reversible dimer in this buffer above this concentration.” The second statement is more useful and more reproducible.
Special Case: Heterogeneous Glycosylation and Conjugates
Glycans, PEG, fluorescent dyes, and bound nucleic acid change mass, refractive increment, shape, and charge. SEC-MALS can analyze conjugates when protein and modifier contributions are measured with appropriate detectors and dn/dc values. Standard protein assumptions can otherwise misassign stoichiometry.
AUC likewise needs the correct partial specific volume and solvent density. Native PAGE may resolve glycoforms as separate bands or smear them. DLS may report a broader radius without indicating whether the cause is oligomerization or chemical heterogeneity.
Confirm the chemical composition first. An “oligomeric” mass that equals one protein plus variable glycan or nucleic acid is not a self-association state.
Worked Example: Monomer, Dimer, and Aggregate in One Sample
A 45 kDa enzyme runs near 90 kDa on native PAGE. DLS gives a 12 nm radius, far too large for a compact dimer. SEC-MALS shows a 50–85 kDa mass gradient in the main peak and a small void peak.
After centrifugation, the DLS radius drops sharply but the SEC-MALS gradient remains. AUC across 2–40 µM resolves a monomer–dimer equilibrium plus trace aggregate. The native PAGE band corresponds mainly to dimer under the loading concentration; DLS was dominated by the trace aggregate; SEC-MALS captured dilution-driven dissociation.
Each method was reporting a real feature. Only the combined experiment identified which feature mattered.
The Economics of Orthogonal Measurement
| Early decision | Cheap screen | Expensive error avoided |
|---|---|---|
| aggregate vs oligomer | DLS + SEC | designing mutations against a dust-driven radius |
| shape vs mass | SEC-MALS | assigning stoichiometry from SEC standards |
| stable vs reversible complex | concentration series | publishing a concentration-specific state as universal |
| matrix artifact | AUC comparison | optimizing column behavior instead of biology |
| physiological relevance | activity + interface mutant | treating a purification assembly as functional |
Bottom Line
Trust observables, not instrument labels. Native PAGE screens discrete states, DLS detects large-particle risk, SEC-MALS measures mass in a separated and diluted peak, and AUC resolves free-solution distributions and equilibria. Match buffer and concentration, test reversibility, account for shape and amphiphile, and require at least two orthogonal lines of evidence for a stoichiometry claim.
Planning Oligomerization Experiments in Orbion
Orbion Characterize places structure confidence, predicted interfaces, disorder, topology, and sequence liabilities in one target record. Design compares interface variants and construct boundaries without assuming that a modeled assembly is proven. Bench builds a literature-grounded measurement plan with matched concentrations, orthogonal readouts, and explicit decision gates.
The best result is not the one from the most sophisticated instrument. It is the one whose physical assumptions fit the protein and the question.
References
- Loll, P. J. et al. The use of blue native PAGE in the evaluation of membrane protein aggregation states for crystallization. Journal of Applied Crystallography 41, 1115–1120 (2008). doi:10.1107/S0021889808033797
- Lebowitz, J., Lewis, M. S. and Schuck, P. Modern analytical ultracentrifugation in protein science: a tutorial review. Protein Science 11, 2067–2079 (2002). doi:10.1110/ps.0207702
- Cole, J. L., Lary, J. W., Moody, T. P. and Laue, T. M. Analytical ultracentrifugation: sedimentation velocity and sedimentation equilibrium. Methods in Cell Biology 84, 143–179 (2008). doi:10.1016/S0091-679X(07)84006-4
- Dorwart, M. R. et al. S. aureus MscL is a pentamer in vivo but of variable stoichiometries in vitro: implications for detergent-solubilized membrane proteins. PLoS Biology 8, e1000555 (2010). doi:10.1371/journal.pbio.1000555
- Liu, L. et al. Particles shed from syringe filters and their effects on agitation-induced protein aggregation. Journal of Pharmaceutical Sciences 101, 2952–2959 (2012). doi:10.1002/jps.23225
- Some, D. Light-scattering-based analysis of biomolecular interactions. Biophysical Reviews 5, 147–158 (2013). doi:10.1007/s12551-013-0107-1