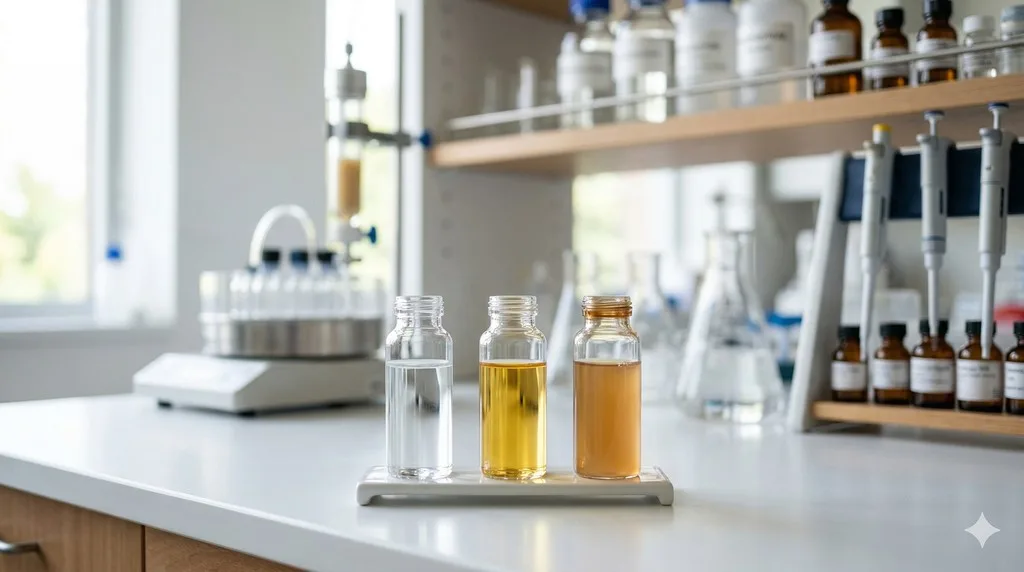
You eluted your protein off the column and it's... yellow. Or amber. Or outright brown. Your target is not a flavoprotein. It's not supposed to have a chromophore. Yet there it is, staring back at you from the collection tube like weak tea. Is this contamination? Degradation? Or something you should actually care about?
Unexpected color in purified protein is one of those observations that gets ignored 90% of the time—and matters critically the other 10%. Here's how to tell the difference.
Key Takeaways
-
Yellow/brown color usually comes from co-purifying small molecules—not from the protein itself being damaged
-
Most common culprits: nickel leaching from IMAC columns, flavins (FAD/FMN), iron-sulfur clusters, PLP, and heme fragments
-
A260/A280 ratio is your first diagnostic—ratios significantly above 0.6 suggest nucleic acid or cofactor contamination
-
Color from bound cofactors may be functionally important—removing it could kill your protein's activity
-
Color from media components or oxidation products is junk—and a sign your purification needs work
The Diagnostic Flowchart
Step 1: When Did the Color Appear?
| Timing | Most Likely Source |
|---|---|
| Already in lysate | Endogenous cofactor or media component co-expression |
| Appeared during IMAC | Nickel leaching or cofactor binding to resin |
| Appeared after elution | Oxidation of free cysteines or concentration of trace contaminant |
| Appeared after storage | Maillard reaction (if glycerol + Tris at high concentration) or oxidative degradation |
Step 2: Run a UV-Vis Absorbance Scan (250–600 nm)
This is the single most informative experiment. 50 µL of protein in a quartz cuvette, scan from 250 to 600 nm, and read off the peaks.
| Absorbance Pattern | Interpretation |
|---|---|
| Clean A280 peak, flat >300 nm | Protein is fine; color is likely in the buffer, not the protein |
| Peaks at 370 + 450 nm | Flavin (FAD/FMN) bound |
| Broad absorbance 330–460 nm | Iron-sulfur cluster |
| Peak at 420 nm | PLP or heme (Soret band is sharper for heme) |
| High baseline across visible range | Scattering from aggregates or precipitate → filter and re-scan |
| High A260 relative to A280 (ratio > 0.7) | Nucleic acid co-purification |
Step 3: Isolate the Chromophore
Once you know the spectrum, confirm whether the color is bound to the protein or just co-purifying free in solution:
| Test | What It Tells You |
|---|---|
| Buffer exchange on a desalting column | Color stays with protein → bound cofactor. Color goes to the flow-through → free small molecule |
| Boil + spin, scan supernatant | Released chromophore = non-covalent cofactor (FAD, PLP, heme b) |
| Add 1 mM EDTA | If color fades → nickel or metal contaminant |
| SDS-PAGE under denaturing conditions | Colored band in gel = covalently attached chromophore (rare: covalent FAD, phycocyanin chromophores) |
Step 4: Decide — Remove It or Keep It?
| Finding from Steps 1–3 | Action |
|---|---|
| Bound cofactor, matches known enzyme class | Keep it — supplement cofactor in buffers; report stoichiometry |
| Bound cofactor, unexpected for this protein | Investigate — may reveal new biology; check homology to cofactor-binding families |
| Free nickel / EDTA-labile | Remove with EDTA wash, then buffer exchange |
| Media junk (LB-derived) | Wash column more extensively; consider minimal media or alternative host |
| Nucleic acid | Benzonase during lysis; add anion exchange polishing step |
Common Causes and Fixes
Cause 1: Nickel Leaching from Ni-NTA Columns
The most common and most boring explanation. Nickel ions leach from IMAC resin, especially at low pH or high imidazole concentrations. Ni²⁺ in solution is green-blue; complexed with imidazole or protein, it appears yellow-brown.
-
Diagnosis: Measure absorbance at 400 nm (nickel–imidazole complex absorbs here). Add EDTA—if color disappears, it's nickel
-
Fix: Add 1–5 mM EDTA to elution buffer (after elution, not during). Or switch to cobalt resin (less leaching)
-
A280 impact: Nickel contamination inflates A280 readings → overestimated concentration
Cause 2: Bound Flavin Cofactors (FAD/FMN)
Many enzymes bind FAD or FMN without being annotated as "flavoproteins" in simple database descriptions. Flavins are bright yellow (absorbance peak ~450 nm).
-
Diagnosis: Absorbance scan shows peak at 370 nm and 450 nm. Boil the protein—if the supernatant is yellow, the cofactor was released
-
Significance: This is usually functionally important. Don't try to remove it unless you're sure it's non-specific
-
Classic examples: Oxidoreductases, monooxygenases, and many proteins of unknown function that turn out to have redox activity
Cause 3: Iron-Sulfur Clusters
Fe-S proteins are brown/amber. [2Fe-2S] clusters absorb at ~330 and 460 nm. [4Fe-4S] clusters are darker brown with broader absorbance.
-
Diagnosis: Absorbance peaks at 330/420/460 nm. Brown color fades when exposed to air (clusters are oxygen-sensitive)
-
Significance: Almost always functionally essential. Handle anaerobically if possible
-
Gotcha: Iron-sulfur clusters can be partially or fully lost during aerobic purification. Your protein may be brown but only 30% loaded—the rest is apo form
Cause 4: Pyridoxal Phosphate (PLP)
PLP-dependent enzymes are yellow (absorbance at ~420 nm for the internal aldimine form). Common in transaminases, decarboxylases, and racemases.
-
Diagnosis: Peak at 420 nm. Add excess substrate—color may shift (Schiff base chemistry changes the chromophore)
-
Significance: Functionally essential. PLP can be lost during purification; supplement with 10–100 µM PLP in buffers
Cause 5: Nucleic Acid Contamination
Co-purifying DNA or RNA contributes to absorbance at 260 nm and can give a faint yellow tinge at high concentrations.
-
Diagnosis: A260/A280 ratio > 0.7 (pure protein is typically 0.5–0.6). Run on agarose gel to check for nucleic acid bands
-
Fix: Add benzonase/DNase I during lysis. Add a polishing ion exchange step (Q column removes nucleic acids effectively)
Cause 6: Media-Derived Chromophores
LB and TB media contain caramelized sugars, melanoidins, and other brown compounds that stick to proteins, especially during IMAC.
-
Diagnosis: Protein from defined (minimal) media is colorless; same protein from LB is yellow
-
Fix: Wash column extensively (20+ CV) before elution. Or switch to a cleaner expression medium
-
Tip: Auto-induction media are particularly bad for this—the sugar mixtures caramelize and co-purify
The Spectroscopic Quick Test
| Absorbance Feature | Likely Chromophore | Action |
|---|---|---|
| Peak at 370 + 450 nm | Flavin (FAD/FMN) | Check if enzyme requires it; likely functional |
| Broad 330–460 nm | Iron-sulfur cluster | Handle anaerobically; likely functional |
| Peak at 420 nm | PLP (pyridoxal phosphate) | Supplement PLP in buffers; functional |
| Peak at 410 nm (Soret band) | Heme or heme fragment | Check for co-purifying cytochrome contamination |
| High A260/A280 (>0.7) | Nucleic acid | Add nuclease; add anion exchange polishing step |
| Featureless yellow-brown | Nickel or media junk | Add EDTA test; wash column more; try cleaner media |
When Color Matters vs. When It Doesn't
Color matters if:
-
You're doing enzyme kinetics (missing cofactor = dead enzyme)
-
You're doing structural biology (partial occupancy of cofactor sites complicates interpretation)
-
You're measuring concentration by A280 (chromophore contamination skews readings—use Bradford or BCA instead)
Color doesn't matter if:
-
You're doing binding assays with a separately labeled ligand
-
You've confirmed the color doesn't affect your functional readout
-
It's clearly nickel or media junk and you've verified purity by other means (SDS-PAGE, mass spec)
The Bottom Line
| Observation | First Test | Most Likely Cause |
|---|---|---|
| Yellow, peaks at 370 + 450 nm | Boil and check supernatant | Flavin cofactor (functional) |
| Brown, oxygen-sensitive | Anaerobic handling; 330/460 nm scan | Iron-sulfur cluster (functional) |
| Yellow, peak at 420 nm | Add PLP to buffer | PLP cofactor (functional) |
| Yellow-brown, featureless spectrum | Add EDTA; compare LB vs minimal media | Nickel leaching or media contaminant |
| Faintly yellow, high A260/A280 | Agarose gel; benzonase treatment | Nucleic acid contamination |
The one rule: Run an absorbance scan from 250–600 nm before panicking. The spectrum tells you whether your color is a contaminant to remove or a cofactor to preserve.
Predicting Cofactor Binding Before You Purify
Orbion's AstraSUIT predicts whether a protein is likely to require cofactors for proper folding and function, while AstraBIND identifies potential small-molecule binding sites. Knowing your protein binds FAD or PLP before you start purification means you can supplement cofactors in your expression and purification buffers—and interpret that yellow color as a sign of success, not contamination.
References
-
Macheroux P, Kappes B, Ealick SE. (2011). Flavogenomics — a genomic and structural view of flavin-dependent proteins. FEBS Journal, 278(15):2625-2634. Link
-
Beinert H, Holm RH, Münck E. (1997). Iron-sulfur clusters: nature's modular, multipurpose structures. Science, 277(5326):653-659. Link
-
Block H, et al. (2009). Immobilized-metal affinity chromatography (IMAC): a review. Methods in Enzymology, 463:439-473. Link
-
Eliot AC, Kirsch JF. (2004). Pyridoxal phosphate enzymes: mechanistic, structural, and evolutionary considerations. Annual Review of Biochemistry, 73:383-415. Link