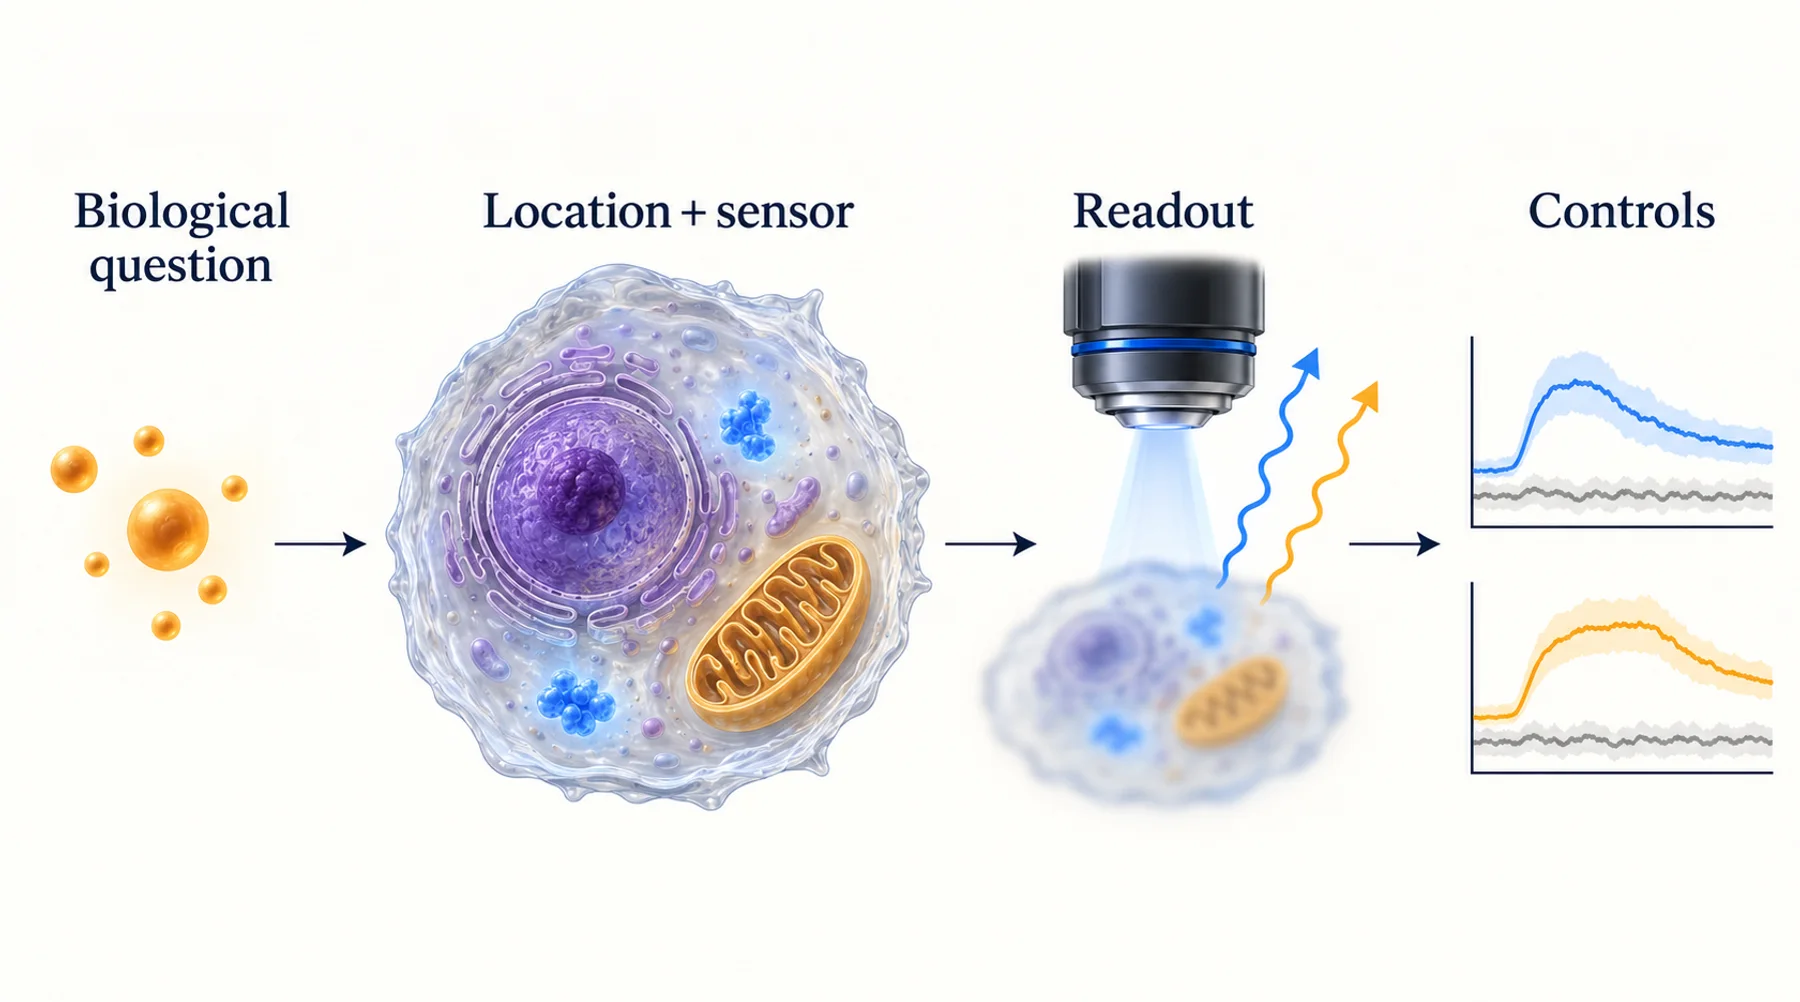
The unlabelled control glows in the same channel as your reporter. Increasing exposure makes both brighter. Subtracting a background value improves the display, but the treatment effect remains unstable from one field to another.
Autofluorescence is a source-identification problem before it is an image-processing problem. Determine which part of the sample or optical system contributes the unwanted signal, whether that contribution changes with treatment, and how it overlaps with the reporter. The appropriate intervention follows from that diagnosis.
In living samples, background is not always inert. Endogenous fluorescent molecules can change with metabolism, cell state, and illumination. A method that makes an image cleaner can also remove biological information or alter the cells being studied. This guide develops a practical workflow for distinguishing those possibilities.
Key Takeaways
- Separate fluorescence from cells, medium, matrix, and other labels using matched controls.
- Background subtraction removes an estimate of the mean; it does not remove the photon noise already collected.
- Treatment can change autofluorescence, so untreated unlabelled cells may be an inadequate control.
- Spectral separation, lifetime methods, and modulation require their own calibration and assumptions.
- Avoid transferring fixed-tissue quenching or aggressive bleaching procedures into a live-cell experiment without validating biological effects.
Define What You Mean by Background
Autofluorescence is fluorescence from components present without the intended fluorescent label. In a living culture, it can include endogenous cellular emitters and fluorescent constituents of the medium or matrix. Researchers often use “background” more broadly to include detector offset, out-of-focus reporter signal, scattered excitation, nonspecific staining, and fluorescence from another label.
These sources should not be treated as interchangeable. Detector offset is an instrument contribution. Out-of-focus fluorescence may come from the reporter itself. Cross-talk from another dye requires a channel-separation control. Autofluorescence originates in the sample and may carry spatial or biological structure.
Begin by describing the observation: diffuse signal throughout the field, bright intracellular puncta, fluorescence around the matrix, a treatment-dependent shift, or signal appearing only with a particular optical configuration. That description helps choose the next control. It is more informative than applying a single numerical threshold to everything called background.
Also distinguish the intended readout from an unwanted contribution. In a reporter assay, cellular flavin fluorescence may obscure the label. In a metabolic imaging experiment, endogenous fluorescence can be the signal of interest. A study of patient-derived organoids used NAD(P)H and FAD autofluorescence to assess treatment response. The same class of emitted light can therefore be useful or confounding depending on the question.
Build a Small Control Ladder
Acquire controls using the same objective, illumination, filters, exposure, detector settings, and analysis pipeline as the experimental sample. Where practical, compare the same culture geometry and imaging depth. A control in a thin dish of clear medium does not necessarily describe background in a thick matrix containing cells.
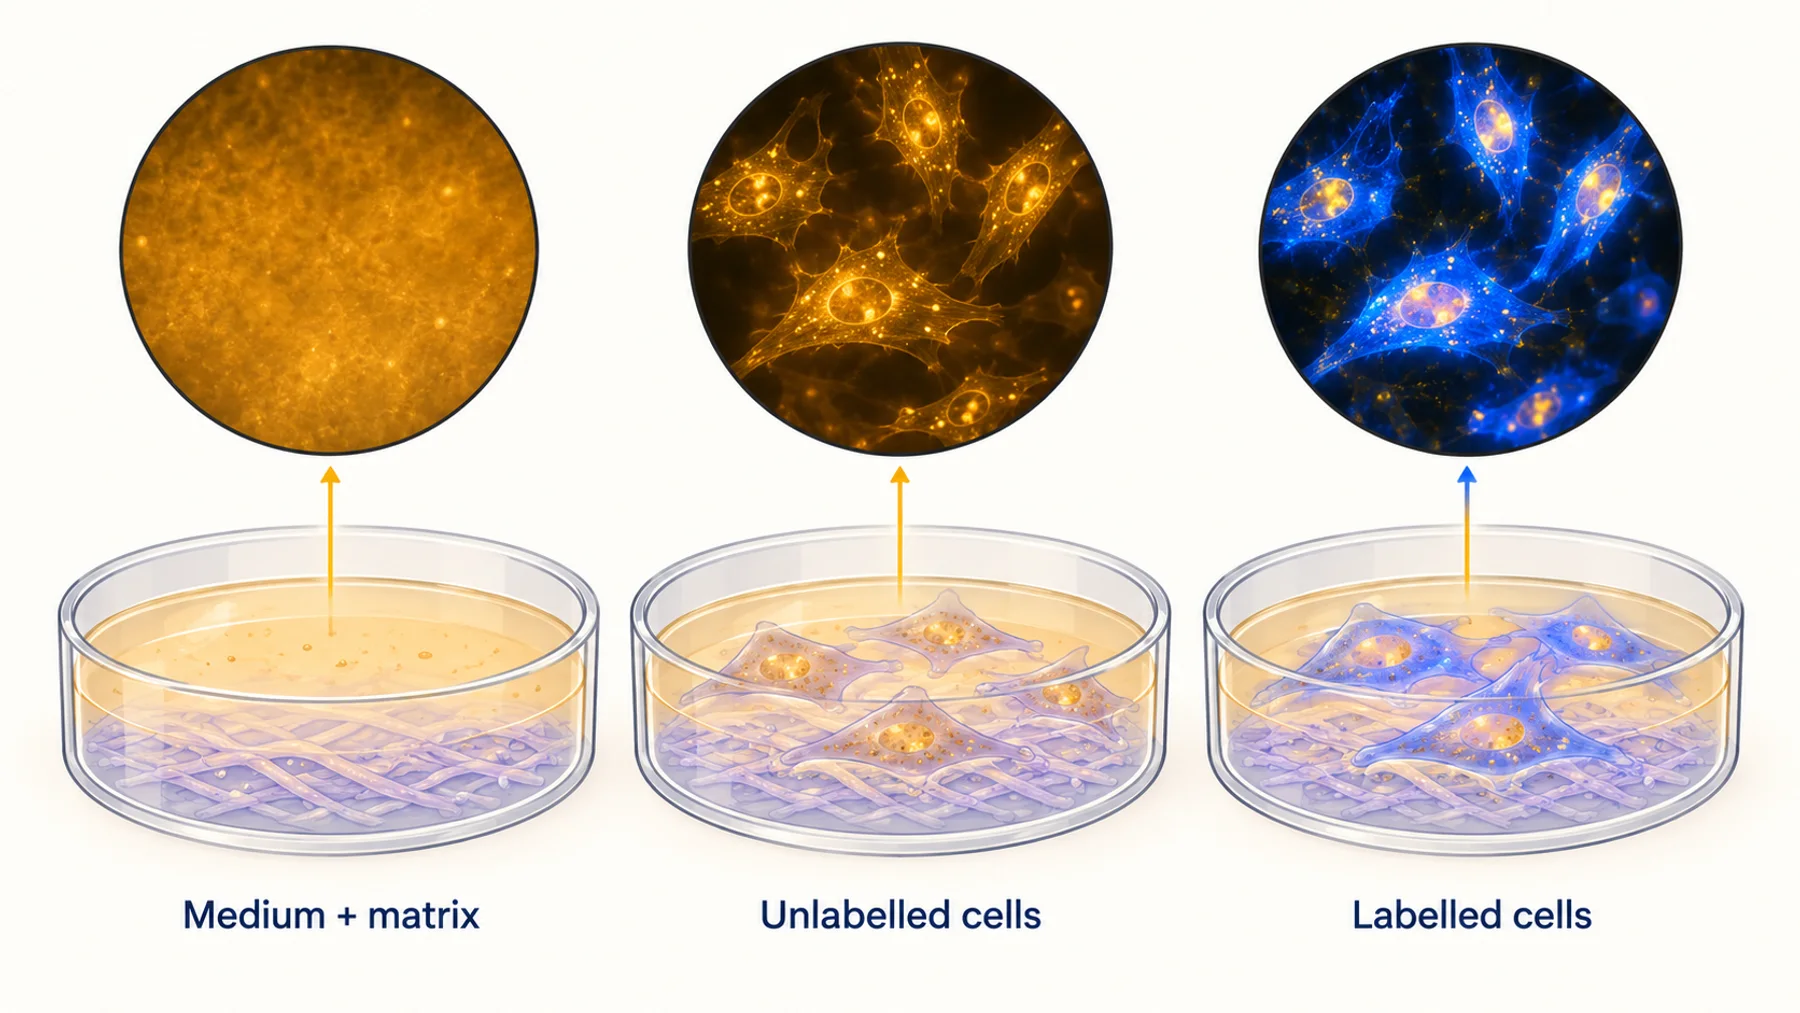
Start with an instrument baseline, then medium and substrate, matrix if used, unlabelled cells, and labelled cells. Include treatment in the unlabelled condition when treatment could alter cell state or introduce a fluorescent compound. If multiple labels are present, add single-label controls for cross-talk.
Figure 1. The control ladder localizes sources of background. Each comparison should preserve the acquisition settings and relevant sample conditions; the schematic does not imply that contributions are always independent or simply additive.
The ladder is a diagnostic sequence, not a requirement to collect every control at every time point indefinitely. Use the initial results to identify the contributors that matter, then retain the controls needed to support the actual comparison. If the signal changes with medium composition, examine that composition. If only treated unlabelled cells change, focus on biological autofluorescence or treatment-associated fluorescence.
Keep the raw images. Automatic contrast adjustment can make a weak control look as bright as a strongly labelled sample, or conceal a substantial background contribution. Use matched display ranges when comparing images, and report quantitative values from linear, unsaturated data.
Ask Whether the Background Changes With the Experiment
A common failure is to measure background once and subtract that number from all subsequent recordings. This assumes the background remains representative as treatment, temperature, cell density, medium, and illumination change.
That assumption can fail during metabolic perturbation. It can also fail when cells move, change shape, detach, accumulate material, or are replaced by a different surviving population. In three-dimensional cultures, changes in morphology can alter the amount of out-of-focus material contributing to a region even if its molecular fluorescence is unchanged.
Compare treated and untreated unlabelled samples over the relevant period. Examine the distribution, not only the average. A small population with strong endogenous fluorescence can disproportionately affect whole-field or whole-well measurements. If the reporter-positive population differs systematically in size or morphology, a single background value from a different population may not be appropriate.
The objective is not to eliminate all variability from controls. It is to estimate which variability belongs in the uncertainty of the reporter measurement. Report when the treatment-dependent background is comparable to the proposed effect. That result may justify changing the optical strategy or narrowing the claim rather than applying increasingly elaborate subtraction.
Why Subtraction Does Not Recover Lost Signal Quality
Consider a simple detector model in which a region contains reporter signal S, sample background B, and an instrument offset. After correcting the offset, subtracting an estimate of B can recover an estimate of the reporter's mean contribution. It cannot undo the random arrival of photons from B during acquisition.
For an ideal shot-noise-limited count measurement with a perfectly known mean background, a useful approximation is SNR = S / sqrt(S + B). Real measurements also include detector noise, uncertainty in the background estimate, and other effects. This expression is a teaching model, not a complete microscope noise model.
In a hypothetical region with 100 detected reporter photons and 900 background photons, the reporter contribution has an approximate SNR of 100/sqrt(1000), or 3.2. With the same reporter signal and 100 background photons, it becomes about 7.1. Subtracting 900 from the first measurement changes the mean, but does not make its uncertainty equivalent to the second measurement.
Figure 2. Equal background-corrected signals can have different precision. The numerical example assumes ideal photon counting and a known mean background; practical uncertainty is usually more complex.
An independently measured background adds its own uncertainty when subtracted. Negative corrected values can occur near the detection limit and should not automatically be clipped to zero before analysis, because clipping changes the distribution. Decide how low-signal observations will be handled before comparing conditions.
This is why preventing unwanted photons from reaching the measurement can be more valuable than making the final image appear cleaner. It is also why a denoising algorithm cannot establish that a weak structure is a real reporter-specific feature without appropriate evidence.
Improve the Sample Conditions Without Changing the Question
If medium or matrix contributes strongly, compare an imaging-compatible alternative under controlled conditions. Maintain the environmental features that matter for the cells, including buffering, temperature, osmolarity, nutrients, and gas control. A lower-background formulation is not automatically a biologically equivalent formulation.
Use a matched functional comparison to determine whether the change alters the process you intend to study. A reduced background accompanied by changed metabolism may be an unacceptable tradeoff in a metabolic assay. In a short localization experiment, the same formulation might be suitable after validation.
Check the substrate, vessel, coatings, and matrix lot where the control ladder points to them. Optical properties can differ across materials, thicknesses, and preparation methods. A blank made from the actual materials is more informative than a generic empty glass reference.
Do not assume that a quencher used for fixed sections is compatible with living cells. Likewise, photobleaching endogenous background before acquisition can change the sample. A cardiac-myocyte study found functional effects associated with endogenous flavin photobleaching even without conspicuous morphological changes. That is a reason to evaluate function rather than treating a stable-looking cell as proof of an unchanged experiment.
Choose the Optical Change That Addresses the Source
Changing excitation or detection bands can reduce overlap between the reporter and background. Evaluate the signal retained as well as the background rejected. A narrow filter may improve the signal-to-background ratio while discarding enough reporter photons to worsen precision or require more illumination.
Longer-wavelength reporters can be useful in some samples, but “red” is not a universal solution. Check the actual excitation and emission spectra, detector efficiency, sample absorption, cross-talk, and available reporters for the biological function. A spectral shift may also require a new targeting or validation workflow.
Optical sectioning can help when unwanted fluorescence comes from outside the region of interest. Whether confocal, light-sheet, or another geometry is appropriate depends on sample thickness, access, speed, and phototoxicity. It does not remove background molecules that occupy the same location and spectral channel as the reporter.
| Observation | Candidate intervention | What to verify |
|---|---|---|
| Bright medium-only control | Review medium or vessel composition | Cell function remains comparable |
| Strong cellular signal in the reporter channel | Change spectral strategy or reporter | Adequate reporter photons and retained function |
| Signal from other labelled structures | Single-label controls and channel correction | Correction remains valid across treatments |
| Out-of-focus haze in thick samples | Improve sectioning or acquisition geometry | Depth coverage, light exposure, and throughput |
| Treatment changes unlabelled cells | Treatment-matched background model or another readout | The corrected effect exceeds uncertainty |
Change one major variable at a time during troubleshooting. Otherwise, a better image does not reveal which intervention helped or whether the improvement came at a biological cost.
Use Spectral Unmixing Only With Defensible Components
Spectral unmixing estimates the contribution of components whose spectral signatures are sufficiently distinguishable. Its usefulness depends on the quality and relevance of those signatures, the number of measured channels, noise, and the model used to combine them.
Reference spectra should represent the conditions of the experiment where possible. If a treatment changes the endogenous spectral mixture, a fixed autofluorescence reference may fit poorly. If the reporter and background spectra are nearly indistinguishable, adding a complex algorithm does not create information absent from the measurement.
Inspect residuals and controls rather than judging the unmixed image by appearance alone. Run unlabelled samples through the same pipeline: a convincing reporter-shaped output in those samples is a warning. Test whether conclusions survive reasonable analysis choices, and retain the original channels so another researcher can assess the separation.
Quantitative channel handling is also relevant to ratiometric and FRET measurements. The QuanTI-FRET framework demonstrates why correcting channel contributions is part of quantitative inference. A ratio of two contaminated channels should not be treated as inherently background-free.
A Worked Troubleshooting Example
Imagine an organoid reporter that appears to increase after treatment. The labelled, treated cultures are brighter, but their morphology also changes. This is a hypothetical diagnostic sequence, not a claim about a specific reporter or organoid system.
First, acquire treated unlabelled cultures in the same channel and geometry. If they also brighten, determine whether the increase is diffuse, localized to cells, or concentrated in the matrix. Compare with treatment-containing medium without cells to check whether the compound or formulation contributes directly.
Second, inspect reporter localization and sample geometry. If the treated organoids flatten, the imaging plane may now include more labelled cells. A whole-field intensity change would then combine geometry and reporter biology. Use a validated segmentation and normalization strategy that matches the question, rather than dividing by whichever quantity makes the effect most consistent.
Third, compare the size of the corrected effect with the variation in matched controls. If the background contribution is large and uncertain, test a different detection band or a readout less affected by that contributor. If the reporter effect remains robust, confirm it with a response-specific control and, where feasible, an independent measurement.
The result may be a stronger reporter assay, or a conclusion that the original experiment cannot support the intended claim. Both outcomes are useful. The control ladder prevents a sequence of cosmetic image adjustments from being mistaken for scientific validation.
What Lifetime and Modulation Can Add
Spectral overlap is not the only possible distinction between signals. Emitters may differ in lifetime or in response to a controlled perturbation. Such differences can provide additional information for separation when the instrument and analysis support them.
Published work on magnetically responsive proteins explores modulation-based optical detection. A reporter contribution that changes reproducibly with an applied field may be distinguishable from a contribution that does not. Useful separation still depends on response size, noise, motion, drift, and whether the background is actually unmodulated under the conditions used.
This approach does not make excitation light unnecessary or guarantee imaging through arbitrary tissue depth. It introduces another discriminating variable into the measurement. Nebula investigates responsive proteins as potential research tools; application-specific improvements in living samples remain an experimental question.
Report Enough Detail to Reproduce the Correction
Describe the control samples, acquisition settings, background regions, correction formula, and handling of low or negative values. State whether subtraction used a constant, a local estimate, or a time-dependent model. Record whether the estimate came from the same image, another well, or another experiment.
Report signal and background separately where practical. A large fold change calculated from a near-zero corrected baseline can be unstable even when its plotted value looks impressive. Include distributions or uncertainty that show the underlying measurement quality.
Finally, keep image quality and biological fidelity together. Phototoxicity assessment should accompany any substantial change in illumination or acquisition duration. The objective is a trustworthy measurement of living biology, not simply a darker background.
Common Questions
Can I use an empty region beside the cells as the background?
It can estimate some medium and instrument contributions, but usually does not represent intracellular autofluorescence. Choose a background control that matches the source you need to estimate.
Will subtracting an unlabelled image remove all autofluorescence?
No. It can estimate a mean contribution when conditions are matched, but does not remove photon noise or guarantee correct treatment of spatial and temporal differences.
Should I bleach the sample before collecting data?
Only if the complete procedure has been shown compatible with the biological measurement. Bleaching can alter endogenous molecules and cell function. A prettier image is not sufficient evidence that the intervention is harmless.
Diagram note: the cover and figures are conceptual illustrations, not experimental results. Numerical examples are identified in the text.