Your cells get brighter after treatment. The microscope captured a response, but what did it measure? More analyte, more reporter, a change in pH, a shift in focus, or a different population of surviving cells can all change the image.
Choose a live-cell biosensor by defining the measurement before choosing the fluorescent protein. The useful specification connects a biological quantity to a location, a timescale, an optical readout, and a set of controls. Brightness matters because it helps collect photons. It does not establish that those photons answer the biological question.
This guide focuses on research measurements in living cells and three-dimensional cultures. A biosensor here means a recognition or response mechanism coupled to a measurable output. A fluorescent label that shows where a protein resides is useful, but it does not automatically report that protein's activity or the concentration of a nearby metabolite.
Key Takeaways
- Name the quantity and compartment you need to measure before comparing sensor specifications.
- Match the sensor's operating range and response time to the biological event, not just the instrument's capabilities.
- Treat delivery, localization, calibration, and perturbation as parts of the measurement.
- A relative fluorescence response can be informative without being an absolute concentration measurement.
- Validate the complete assay in the intended model before transferring conclusions from purified protein or another cell type.
Start With a Sentence You Could Put in the Methods
“We want to monitor metabolism” is a research interest. “We want to follow reversible changes in cytosolic ATP during a treatment and recovery period in individual cells” is a measurement objective. The second sentence specifies a quantity, a compartment, a temporal pattern, and an observational unit.
Write that sentence before searching for probes. Add the decision that the result would support. Will it distinguish an early transient response from sustained dysfunction? Identify a small subpopulation? Compare treatment order? A sensor can generate an attractive movie while failing to distinguish the alternatives that motivated the experiment.
The original ATeam study, for example, used engineered FRET indicators for ATP and demonstrated compartment-targeted measurements. Its relevance is that a defined recognition mechanism can be connected to a cellular question. It is not evidence that any fluorescent signal from a mitochondrial reporter is a direct measure of ATP production.
Concentration, production rate, transport, and total amount are different quantities. A pool can remain steady while its production and consumption both increase. A falling concentration can reflect dilution, export, or reduced production. Select the sensor for the quantity it reports, then use additional experiments to interpret the mechanism behind a change.
Map the Complete Measurement Chain
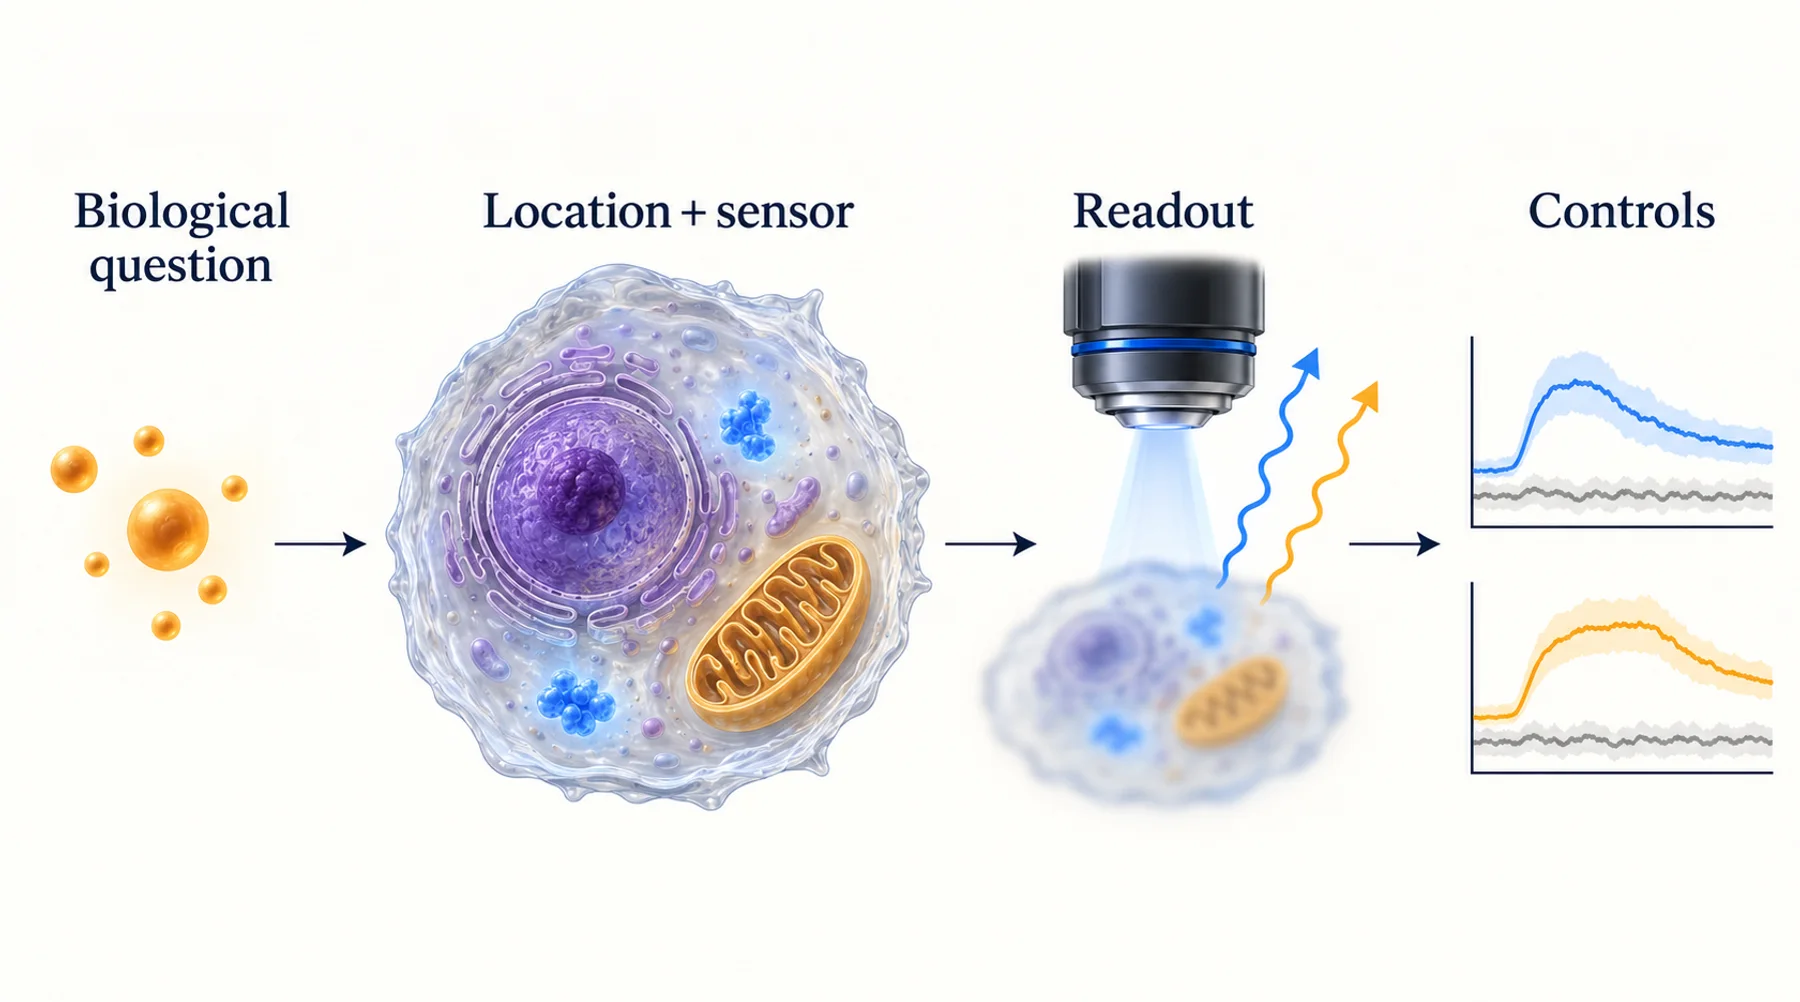
A useful chain has five links: biology changes a molecular quantity; the sensor responds; the optical system collects a signal; analysis converts images into numbers; those numbers support an inference. Each link has its own failure modes.
A sensor that binds the intended analyte may still be excluded from the relevant organelle. A well-localized sensor may be saturated. A responsive, unsaturated sensor may be imaged with insufficient temporal resolution. A technically good recording may then be analyzed using regions that drift out of the cell.
Figure 1. A biosensor measurement is a chain of experimentally testable relationships. The controls beneath each stage address different sources of uncertainty; no single positive control validates the whole chain.
Build a small failure map alongside the experiment. If fluorescence changes, what alternative explanation is most plausible at each stage? If it does not change, could that be a true biological negative, insufficient sensor response, failed delivery, or a recording problem? A null result becomes more useful when the assay can distinguish those possibilities.
Decide Whether You Need a Local or an Averaged Measurement
The relevant location may be the extracellular medium, cytosol, nucleus, an organelle lumen, a membrane surface, or a region inside a tissue. These environments can differ in analyte availability, pH, ionic composition, access to cofactors, and optical properties.
A whole-well signal averages across the reporter distribution and the cells that contribute photons. A few bright cells can dominate that average. An image resolves spatial differences only to the extent that the optical system, segmentation, and signal support them. Displaying small pixels does not guarantee that a measurement is local on the same scale.
For organoids, specify whether you need a whole-organoid average, a surface-to-interior comparison, or a cell-specific measurement. If the reporter reaches only the outer layers, a well-quantified outer-layer signal cannot establish the state of the center. Conversely, a local reporter may provide more spatial detail than the decision requires, increasing imaging and analysis costs without improving the answer.
Choose the experimental unit at the same time. Multiple cells from one organoid are not automatically independent biological replicates. Preserve the nesting of cells within organoids, wells, preparations, and donors so that precision from many image measurements is not confused with reproducibility across biological samples.
Match the Operating Window to the Expected Biology
The highest-affinity sensor is not always the most informative sensor. If most reporter molecules are already occupied at baseline, a further analyte increase may produce little additional response. If occupancy is extremely low, the response may be too small to separate from measurement noise.
For a simplified reversible, single-site binding sensor, the occupied fraction is f = C / (Kd + C), where C is free analyte concentration and Kd is the dissociation constant under the relevant conditions. This model does not describe every biosensor. It is useful for seeing why range matching matters.
In a hypothetical example, increasing C from Kd to 2Kd changes occupancy from 0.50 to about 0.67. Increasing C from 20Kd to 40Kd changes occupancy from about 0.95 to 0.98. Both are twofold concentration increases, but the latter occurs near saturation. The optical response also depends on how occupancy is coupled to fluorescence.
Figure 2. Range matching for a hypothetical single-site sensor. The curve illustrates an idealized binding model, not measured performance or a recommended affinity for a particular analyte.
Dynamic range describes how much the output can change under specified conditions. Sensitivity describes how strongly it changes with the quantity of interest in a particular region. Precision concerns measurement scatter. Selectivity concerns alternative inputs. A large maximum fluorescence change does not establish any of the other properties by itself.
Check whether published specifications come from purified protein, cultured cells, or the intended biological model. Temperature, pH, binding partners, and local chemistry may change the usable range. Treat a literature value as a starting point for assay design rather than a transferable calibration certificate.
Match the Timescale Before Increasing the Frame Rate
An observed trace combines the event itself, sensor kinetics, transport, acquisition, and analysis. A camera can record many frames per second while the reporter responds slowly. More frames then describe the reporter's lag with greater detail; they do not recover the missing biological dynamics.
Think separately about onset, recovery, and reversibility. A reporter may respond quickly to an increase but recover slowly. A reaction-based probe may accumulate product and therefore integrate exposure. Such a probe can be appropriate for detecting that an event occurred, while being unsuitable for measuring repeated rises and falls.
Set the sampling interval using the shortest event you need to distinguish, and include enough observations to describe its shape. Avoid treating a mathematical sampling rule as a complete design prescription: the event duration may be uncertain, measurements have noise, and the sensor can filter the signal before acquisition.
Use a short pilot to determine whether faster imaging changes the inferred timing. If it does, the original cadence may have missed relevant structure. If faster acquisition only increases bleaching or biological disturbance, it may reduce the usefulness of the experiment. The appropriate cadence is an experimental result, not simply the fastest setting available.
Choose a Readout You Can Calibrate and Sustain
Intensity, ratios, lifetimes, and energy-transfer measurements solve different problems. Compare the complete acquisition and analysis requirements instead of assuming one is universally superior.
| Readout | What it can help with | What still needs attention |
|---|---|---|
| Single-channel intensity | Simple acquisition and efficient photon collection | Reporter amount, illumination, focus, background, and bleaching |
| Excitation or emission ratio | Some shared multiplicative changes | Channel backgrounds, unequal bleaching, registration, pH, and denominator noise |
| FRET-based measurement | Coupling recognition or conformational change to an optical output | Donor/acceptor cross-talk, stoichiometry, fusion integrity, and calibration |
| Fluorescence or phosphorescence lifetime | Reduced dependence on some intensity variations | Photon statistics, instrument response, fitting model, and local chemistry |
A ratio is a mathematical operation, not a validation method. The QuanTI-FRET study illustrates the need for channel corrections and calibration when extracting quantitative FRET measurements. If either channel is close to background, division can amplify uncertainty and produce visually dramatic artifacts.
Before choosing a complex readout, confirm that the instrument can acquire it over the required field, depth, duration, and throughput. Consider the total experiment: autofocus, stage movement, multiple channels, controls, storage, and analysis. A method that works for one selected cell may be impractical for a multiwell longitudinal study.
Delivery and Reporter Expression Are Part of the Assay
A chemical probe must reach its target environment and remain interpretable there. A genetically encoded reporter must be expressed, fold, mature or acquire its cofactor, and localize correctly. Neither path is automatically less perturbing.
Genetic encoding offers powerful targeting options, but expression can vary across cells and alter the system. The GCaMP-X work provides a concrete example of sensor components interacting with endogenous signaling. This supports testing reporter burden; it does not mean all genetically encoded sensors produce the same effects.
Compare a practical expression range rather than choosing the brightest cells after the fact. If the inferred biological response depends strongly on reporter abundance, examine buffering, localization, saturation, and analysis bias. A signal that appears only at extreme expression deserves a different interpretation from one reproduced across a modest range.
For constructs, record the exact sequence, targeting element, linker, fusion orientation, and expression context. Our guides to tag placement and linker choice explain why apparently small changes can affect a protein's behavior.
Build Controls Around Competing Explanations
An unlabelled sample estimates signal that does not require the reporter. A responsive positive control checks whether the assay can produce the expected direction of change. A response-deficient reporter, where available and appropriately characterized, helps test whether the recognition mechanism is required. An orthogonal measurement asks whether another method supports the biological interpretation.
Those controls are complementary. An unlabelled sample does not test sensor saturation. A strong positive control does not establish selectivity. A response-deficient mutant can have different folding or localization and therefore needs its own characterization. An orthogonal assay may measure a different compartment or timescale, so apparent disagreement is not necessarily a failure of either method.
Also test pH, temperature, cell number, or other plausible nuisance variables when they could change during treatment. For peroxide research, HyPer7 is an example of a reporter engineered around a particular chemical response. Its identity matters more than a generic label such as “ROS sensor.” The control plan should follow the actual chemistry.
A Worked Selection Decision
Suppose a team wants to determine whether a treatment causes a reversible energy disturbance in a three-dimensional culture. This is a hypothetical planning example, not a validated protocol. The first decision is whether the question concerns intracellular ATP, oxygen availability, or an integrated functional outcome. These are related but non-equivalent measurements.
If the team needs ATP changes in individual cells, a compartment-targeted ATP reporter may be worth evaluating. If reporter introduction is unacceptable or tissue access is inadequate, an alternative assay may be more realistic. A bulk endpoint ATP assay could establish a population-level difference, but would not resolve a transient recovery in the same cells.
The pilot should test a limited set of questions: Does the reporter reach the relevant region? Is the baseline within the usable range? Can the assay detect a controlled response? Does the imaging schedule change cell behavior? Can the team distinguish reporter loss from a biological decrease? These tests determine whether a larger study is justified.
Predefine what would count as a useful result. For example, the assay may need to separate sustained changes from short transients across independent preparations. That is a more actionable requirement than asking for the largest possible fluorescence response. It also makes a failed pilot informative: the team can identify whether the limiting factor is biology, reporter design, optics, or throughput.
Preserve the Biology You Intend to Observe
Longitudinal imaging is valuable because it follows a system over time. It also adds repeated illumination and handling. Use matched low-light or minimally observed controls and a functional health measure appropriate to the sample. A cell that remains attached and fluorescent may already behave differently.
Laissue et al. emphasize context-specific assessment of imaging effects. The practical consequence is to validate the observation schedule alongside the reporter. A sensor cannot be considered fit for a long experiment solely because it gives a strong signal in a short recording.
Keep raw channels and acquisition metadata. Record excluded cells, lost organoids, focus failures, and changes in analysis settings. If only stable, bright objects survive the analysis pipeline, the final dataset may describe a selected population rather than the original culture.
Where Emerging Protein Sensors Fit
New sensing mechanisms are useful when they address a defined limitation in this chain. Published work on magnetically responsive fluorescent proteins provides examples of additional ways to encode and distinguish optical signals. It does not remove the need for delivery, analyte coupling, calibration, or biological controls.
Nebula is Orbion's research effort to discover responsive proteins and investigate their potential as sensing tools. Its candidates and applications require experimental validation. A productive starting point for an application discussion is a clear measurement need: what must be observed, where, how often, and what an improvement would enable.
Common Questions
Is the brightest sensor usually the best choice?
Brightness can improve photon collection, but the useful choice also depends on operating range, selectivity, kinetics, localization, and perturbation. Compare performance under matched conditions that reflect the intended experiment.
Does a fluorescence ratio give an absolute concentration?
Only with an appropriate response model and calibration. Ratios can reduce some sources of variation while retaining others. Report relative changes as relative changes when the evidence does not support concentration units.
Can a sensor validated in a cell line be used immediately in organoids?
It is a candidate, not a completed transfer. Recheck delivery, depth, localization, baseline range, optical access, and biological effects in the organoid model. Keep the unit of replication and the region actually measured explicit.
Diagram note: the cover and figures are conceptual illustrations, not experimental results. Numerical examples are identified in the text.