Two organoids share the same incubator, medium, and treatment. One maintains a well-oxygenated interior; another develops a region where oxygen supply cannot keep up with consumption. A sensor in the surrounding medium may report neither interior accurately.
The incubator setting is a boundary condition, not a measurement of oxygen inside an organoid. To choose an oxygen assay, first decide where oxygen must be measured, whether you need concentration or consumption, and how much spatial and temporal detail the experiment requires.
Existing oxygen-measurement methods already offer substantial capabilities. The challenge is selecting and validating the method that corresponds to the biological question. A new reporter becomes useful when it improves a specific measurement under the constraints of the model.
Key Takeaways
- Distinguish gas-phase oxygen, dissolved oxygen in medium, and local oxygen within tissue.
- Oxygen concentration and oxygen-consumption rate are related through transport and mass balance, but are not interchangeable.
- Sensor position, probe access, temperature, and calibration are central to interpretation.
- Lifetime-based oxygen measurements still require a validated response model and adequate photons.
- A decrease in fluorescence is not sufficient evidence of hypoxia without understanding the reporter chemistry.
Three Locations, Three Different Questions
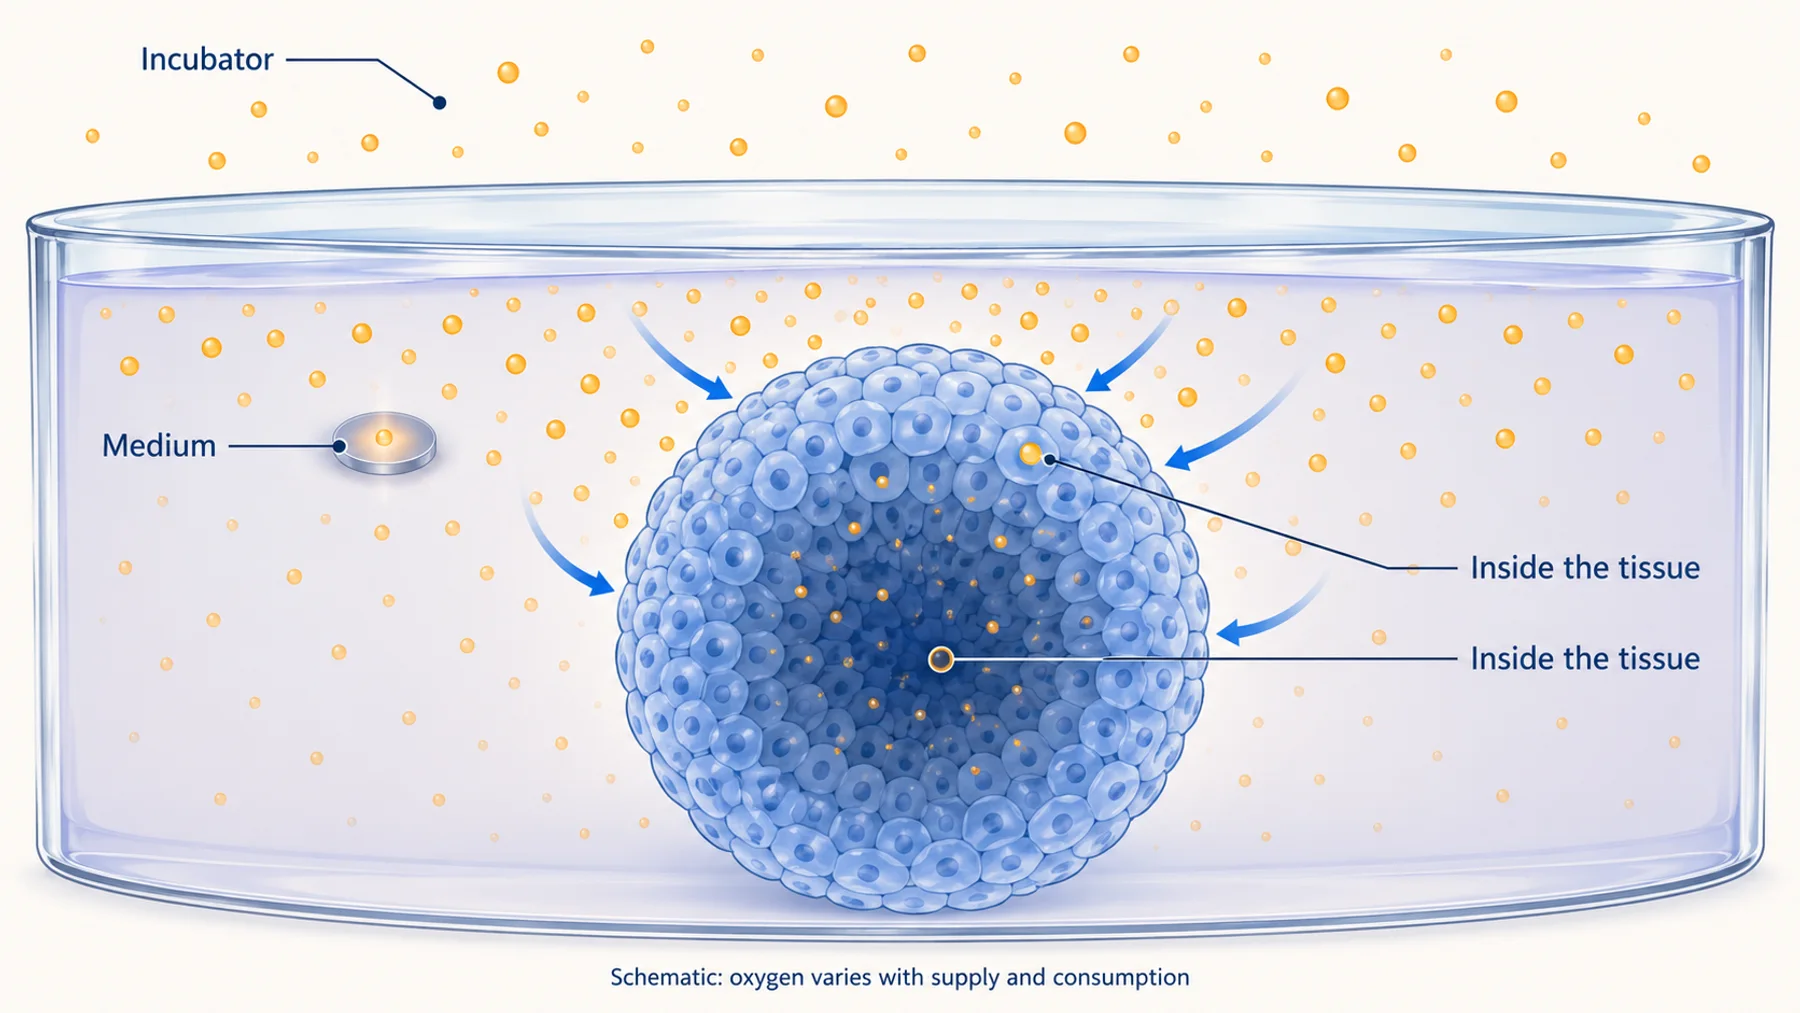
The gas above a culture helps determine oxygen exchange with the medium. The dissolved oxygen near the tissue depends on that exchange, medium geometry, mixing or perfusion, and cellular consumption. Oxygen inside the tissue additionally depends on diffusion distance, local consumption, structure, and any internal transport paths.
A gas controller answers whether the intended gas mixture is being supplied. A medium sensor answers what is present near its sensing element. An intracellular or tissue-distributed probe can answer a more local question if it reaches the intended region and remains calibrated there.
These readings can all be correct while differing. Do not interpret disagreement as instrument failure until the measurement locations and times are aligned. Opening a vessel, transferring it to a microscope, or changing perfusion can also change the boundary conditions during the measurement.
Figure 1. Oxygen measurements describe the environment sampled by the sensor. The illustrated gradient is a possible diffusion-limited case, not a universal profile for every organoid.
In Okkelman et al.'s intestinal-organoid study, phosphorescence lifetime imaging revealed heterogeneity within and between organoids. That finding supports measuring the relevant spatial distribution rather than assuming a bulk value represents every tissue region. It does not supply a universal oxygen threshold or size limit for other organoid models.
Concentration Is Not Consumption
An oxygen concentration is a state at a location and time. An oxygen-consumption rate describes how quickly oxygen is removed by a process. To infer consumption from changing concentration, account for the volume, exchange, mixing, transport, and other sources or sinks in the system.
In a closed, well-mixed hypothetical chamber with no gas exchange or other oxygen sink, the rate of concentration decrease can be related to total consumption through the chamber volume. Real culture systems often depart from those assumptions. Oxygen can enter through gas-permeable materials, arrive in perfusate, or vary spatially.
For a simple steady-flow mass balance, a candidate estimate is oxygen removal rate = flow × (inlet concentration − outlet concentration). The estimate requires appropriate units and assumptions, including a known flow, representative inlet and outlet measurements, and accounting for oxygen exchange elsewhere. It does not directly reveal the oxygen concentration at a cell in the center of the tissue.
This distinction changes the experiment. A study of respiratory response may prioritize consumption. A study of a localized hypoxic niche may require local concentration. A treatment can change both, but measuring one does not automatically establish the other.
Choose the Spatial Scale Before the Probe
Ask whether the experiment needs a medium trend, an organoid average, a surface-to-interior map, or cell-resolved oxygen measurements. The more local the question, the more important probe distribution and optical access become.
A sensor spot integrated into a vessel can provide repeated measurements without repeatedly removing medium. Its value depends on location and transport between the spot and the biology of interest. The integrated phosphorescence-based oxygen biosensor study demonstrates an established approach to oxygen monitoring in a 3D culture system; its particular geometry should not be assumed to describe all tissue interiors.
A distributed probe can potentially provide spatial information, but only where it is present and measurable. Uniform-looking brightness does not prove uniform probe concentration, especially in a scattering sample. Conversely, low intensity in the center may reflect optical attenuation rather than a lack of probe or a change in oxygen.
Report the region actually sampled. “Oxygen near the basal sensor spot” is more precise than “organoid oxygen” when only that location is measured. Precision in the description helps another team decide whether the result transfers to a different culture geometry.
Understand What Optical Oxygen Probes Respond To
Many optical oxygen measurements use luminophores whose excited states are quenched by oxygen. For a suitable probe, increased oxygen shortens the emission lifetime and can reduce emission intensity. The relationship must be established for that probe in its relevant environment.
An idealized dynamic-quenching relationship is the Stern–Volmer equation: tau0 / tau = 1 + Ksv[O2], where tau0 is the lifetime without oxygen, tau is the measured lifetime, and Ksv is a calibration-dependent constant. This simple expression is not universally adequate for probes in heterogeneous materials or biological environments.
If a probe experiences multiple microenvironments, the response may require a more complex model. A good fit over a narrow calibration range does not establish accurate extrapolation beyond it. Examine calibration residuals and uncertainty, and use the model supported by the actual probe data.
Intensity and lifetime have different vulnerabilities. Intensity depends on the amount of emitting material, illumination, collection, and detector response as well as quenching. Lifetime can reduce dependence on some of those intensity factors, but requires enough photons and an appropriate treatment of instrument response, background, and decay shape.
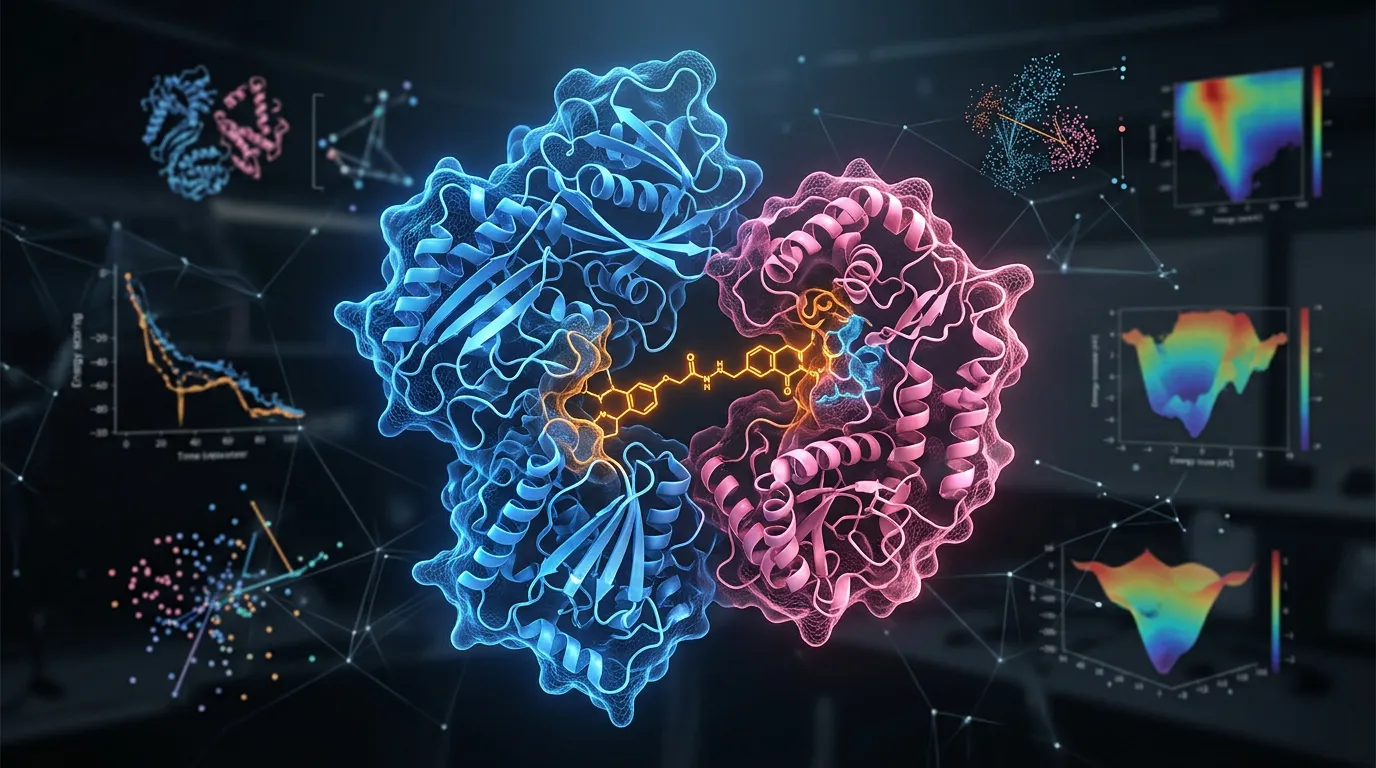
Figure 2. Calibration connects the optical response to oxygen under defined conditions. A response curve is useful only within a justified range and with relevant environmental controls.
Calibrate in Conditions That Matter
Determine which environmental factors affect the probe response. Temperature is particularly important because it can influence oxygen solubility, diffusion, and photophysics. Matrix composition, protein interactions, probe formulation, and other quenchers may also matter.
A calibration measured in a simple solution is valuable, but transfer to tissue is a separate question. Test the actual probe formulation and relevant medium or matrix where feasible. If a full in situ calibration is impractical, explain how the calibration was transferred and what uncertainty remains.
Gas percentage, partial pressure, and dissolved concentration should not be mixed without stating the conversion. A gas mixture at a specified oxygen percentage does not by itself define a dissolved concentration unless pressure, temperature, equilibration, and solution properties are accounted for. Label units consistently in figures, tables, and analysis files.
Use more than a single reference condition when the claim depends on quantitative values across a range. Check repeatability, hysteresis or recovery where relevant, and drift over the duration of the planned experiment. A probe that calibrates well initially can become unreliable if it redistributes or its environment changes later.
Do not confuse an experimental perturbation with a calibration standard. A treatment expected to reduce oxygen can establish a directional response under some conditions, but it does not assign an exact oxygen concentration to the tissue.
Probe Delivery Can Define the Apparent Gradient
Three-dimensional cultures introduce diffusion and access problems for the probe as well as for oxygen. If the reporter is excluded from the interior, the resulting map is a map of the accessible regions. If it accumulates in a particular cellular compartment, that compartment defines the measurement.
Verify distribution using an appropriate independent method or a probe-specific strategy. Consider whether the measured signal comes from cells, extracellular matrix, a lumen, or probe retained on the surface. Tissue architecture matters: an intestinal organoid with a lumen is not equivalent to a compact solid spheroid.
For genetically encoded reporters, expression heterogeneity can create additional sampling bias. A model with reporter-positive cells only at the surface cannot support a claim about the whole organoid. If expression changes differentiation or selects a subpopulation, the resulting oxygen measurement may describe a modified model.
Also evaluate whether the probe or measurement changes oxygen handling. This includes biological effects of loading and illumination, and any relevant oxygen consumption by the sensing method itself. The degree of perturbation is method-specific; it should be measured rather than assumed from labels such as “optical” or “noninvasive.”
Do Not Read Hypoxia Directly From GFP Brightness
GFP-like fluorescent proteins require oxygen during chromophore maturation. That makes oxygen availability relevant to reporter development, but does not turn a conventional GFP intensity measurement into a calibrated oxygen sensor.
Brightness can depend on reporter synthesis, maturation history, degradation, pH, illumination, and collection. Mature fluorophores and newly synthesized reporter molecules do not necessarily respond to a change in oxygen on the same timescale. A dim region therefore has multiple possible explanations.
Drepper et al. described flavin-based reporters that avoid the oxygen requirement of GFP-like chromophore formation. The distinction is useful for experiments in low-oxygen environments. Fluorescence without oxygen-dependent maturation is not the same as quantitative oxygen sensing. A sensor needs an interpretable, calibrated relationship between oxygen and output.
The same caution applies to hypoxia-responsive gene expression or endpoint markers. They can report a biological response to oxygen-related conditions, with their own timing and specificity, rather than the instantaneous dissolved oxygen at the time of imaging.
A Practical Method Comparison
| Approach | Useful question | Main interpretation check |
|---|---|---|
| Gas-phase monitoring | Is the supplied atmosphere controlled? | Gas conditions are not tissue concentrations |
| Medium sensor spot | How does oxygen change near this location? | Placement, exchange, and transport |
| Distributed optical probe with lifetime imaging | How does local oxygen vary across accessible tissue? | Probe distribution, calibration, depth, and photon counts |
| Inlet/outlet measurement | What oxygen removal can a defined flow system support? | Mass balance, leakage, mixing, and other exchange |
| Biological hypoxia marker | Has the sample activated a particular response? | Response kinetics and specificity differ from direct oxygen measurement |
The simplest method that answers the question is often the most useful starting point. If a medium sensor reveals unstable oxygen supply, resolve that problem before investing in a complex intracellular reporter. If the medium is stable but the question concerns local niches, a spatial method may add information a bulk assay cannot provide.
Integrated monitoring is already an active field. Zhang et al. demonstrated a multisensor organ-on-chip platform combining several measurement types. Use such precedents to define an appropriate comparator for a new method rather than assuming repeated monitoring is unavailable.
A Worked Organoid Experiment
Suppose a team observes a treatment-associated change in the center of a 3D culture and suspects oxygen limitation. This hypothetical example starts with two competing explanations: local oxygen supply is inadequate, or the imaging readout changes for another reason.
First, record culture geometry, medium depth, gas control, transfer time, and temperature. Compare the treatment and control in the same configuration. If one condition spends longer outside the incubator, the measurement may be confounded before probe chemistry is considered.
Second, establish a medium measurement and a spatially relevant tissue measurement if the question requires both. Check their timing: a medium value collected before transfer cannot be assumed to describe the culture during imaging. Preserve the exact position of each sensor relative to the tissue.
Third, test whether the tissue probe reaches the center and remains within its calibrated range. Inspect photon counts and fitting quality by depth. Rejecting dim regions without reporting them can preferentially remove the very regions of interest, while accepting unreliable fits can manufacture a gradient.
Finally, compare the oxygen evidence with a relevant functional or structural endpoint. A local oxygen decrease can be biologically meaningful without proving that it caused every observed treatment effect. A causal claim needs a design that manipulates or otherwise tests the oxygen explanation while accounting for other changes.
Plan the Time Series Around Transport and Recovery
Oxygen changes can reflect both rapid consumption changes and slower equilibration of the culture system. Characterize the response to a controlled environmental change in the assembled device, not only in a probe solution.
Track recovery when conditions return toward baseline. If the sensor does not recover, consider irreversible probe changes, redistribution, biological damage, or incomplete re-equilibration. These explanations require different follow-up experiments.
Repeated optical measurements add light exposure. Follow a sample-specific phototoxicity assessment and compare minimally observed controls. A monitoring method that changes respiration or viability can alter the oxygen distribution it is meant to observe.
Report the duration, cadence, environmental control, and missing measurements. A sequence of selected images is not equivalent to continuous observation. If the model moved or the focal plane changed, state how the same region was identified across time.
What a New Protein Sensor Would Need to Improve
A useful new oxygen reporter would need a defined advantage: better localization, reduced perturbation, improved access, useful response kinetics, compatibility with an existing instrument, or more reproducible measurement in a particular model. The comparator should be an established method suited to the same question.
Nebula explores responsive proteins as possible starting points for research tools. Oxygen-related applications require their own evidence for chemical response, calibration, performance in the model, and practical benefit. A magnetic response alone does not establish an oxygen measurement.
Common Questions
Does a low oxygen reading mean an organoid is unhealthy?
Not by itself. Interpretation depends on tissue type, location, duration, and the biological process. Relate oxygen to relevant functional measurements rather than applying one universal threshold.
Is lifetime imaging calibration-free?
No. It can reduce some intensity-related confounders, but the relationship between lifetime and oxygen still requires calibration and a justified model.
Can a sensor in the medium stand in for an intracellular sensor?
Only if that relationship has been established for the question and geometry. Label the measured location explicitly and avoid treating an unmeasured interior as equivalent to the surrounding medium.
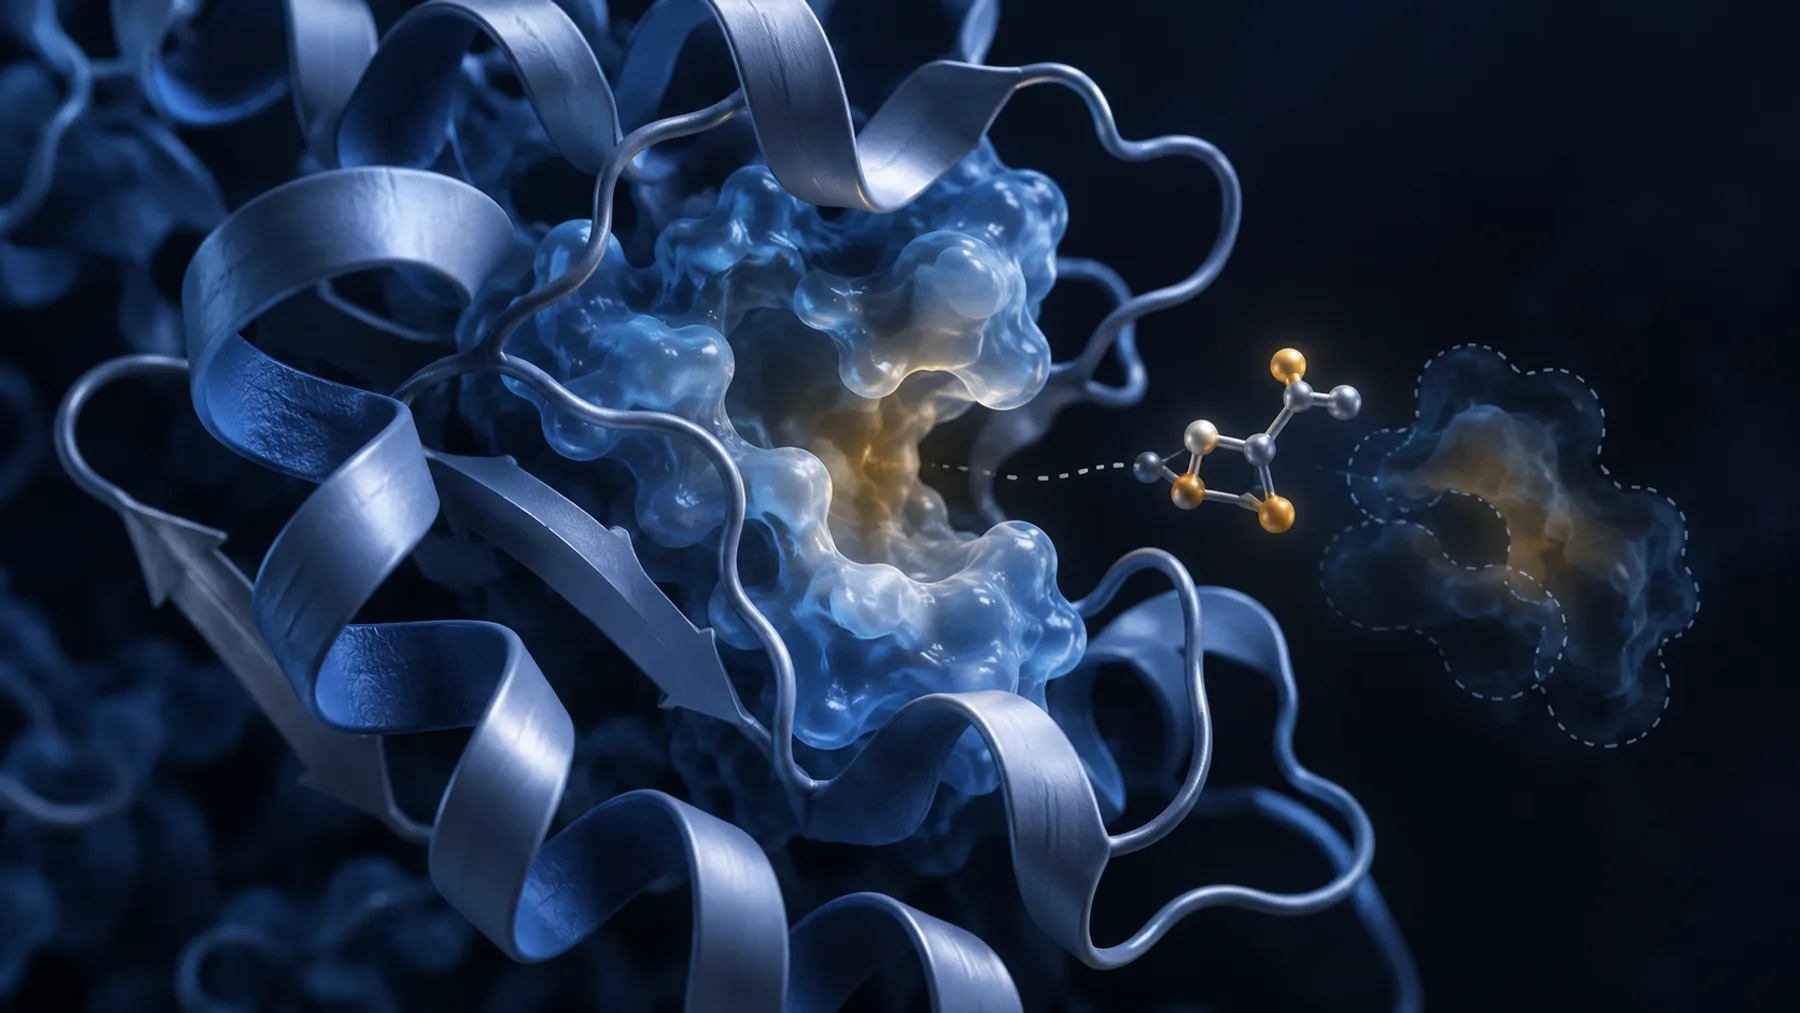
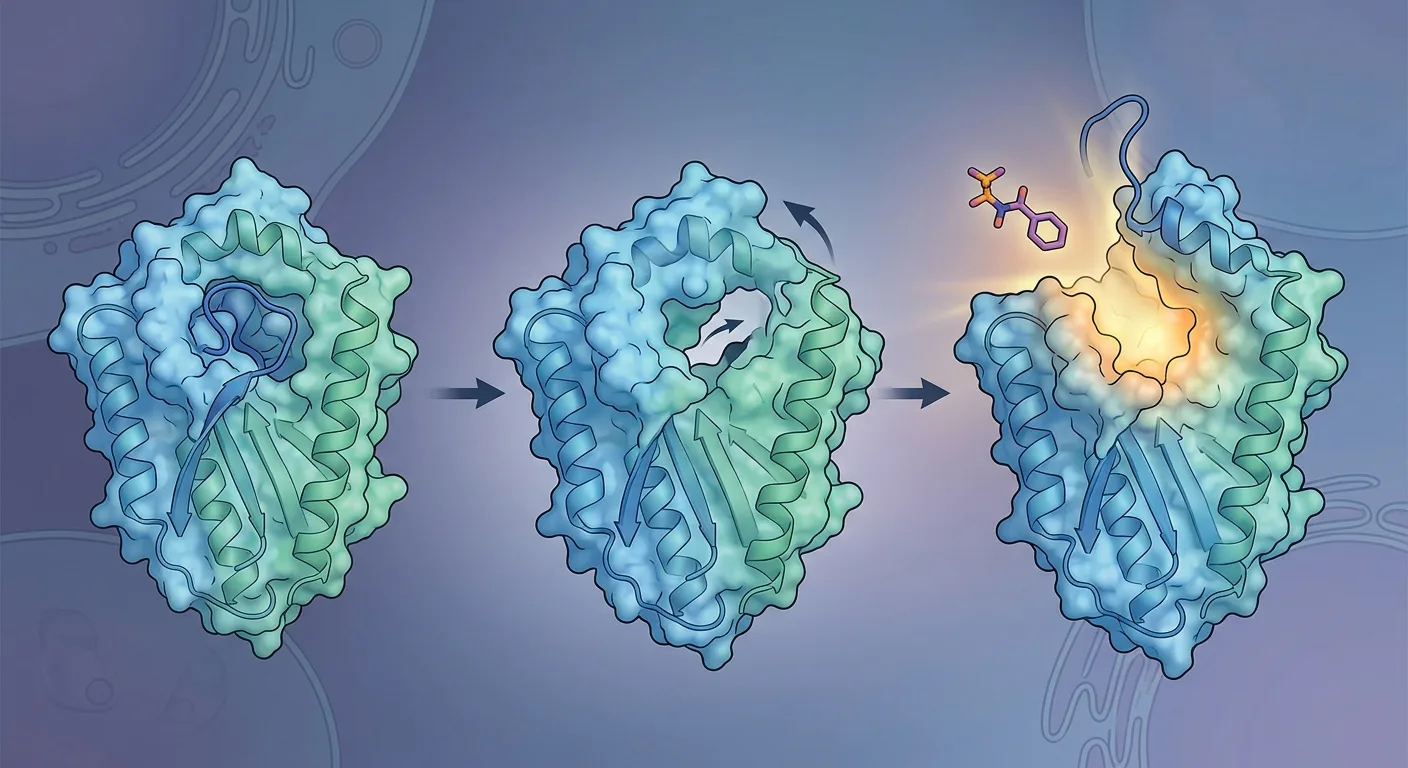
Diagram note: the cover and figures are conceptual illustrations, not experimental results. Numerical examples are identified in the text.