The fluorescence trace declines during a time-lapse experiment. You fit a bleaching correction and recover a stable baseline. Meanwhile, the cells divide more slowly, their mitochondria change shape, and the treatment response begins later than expected.
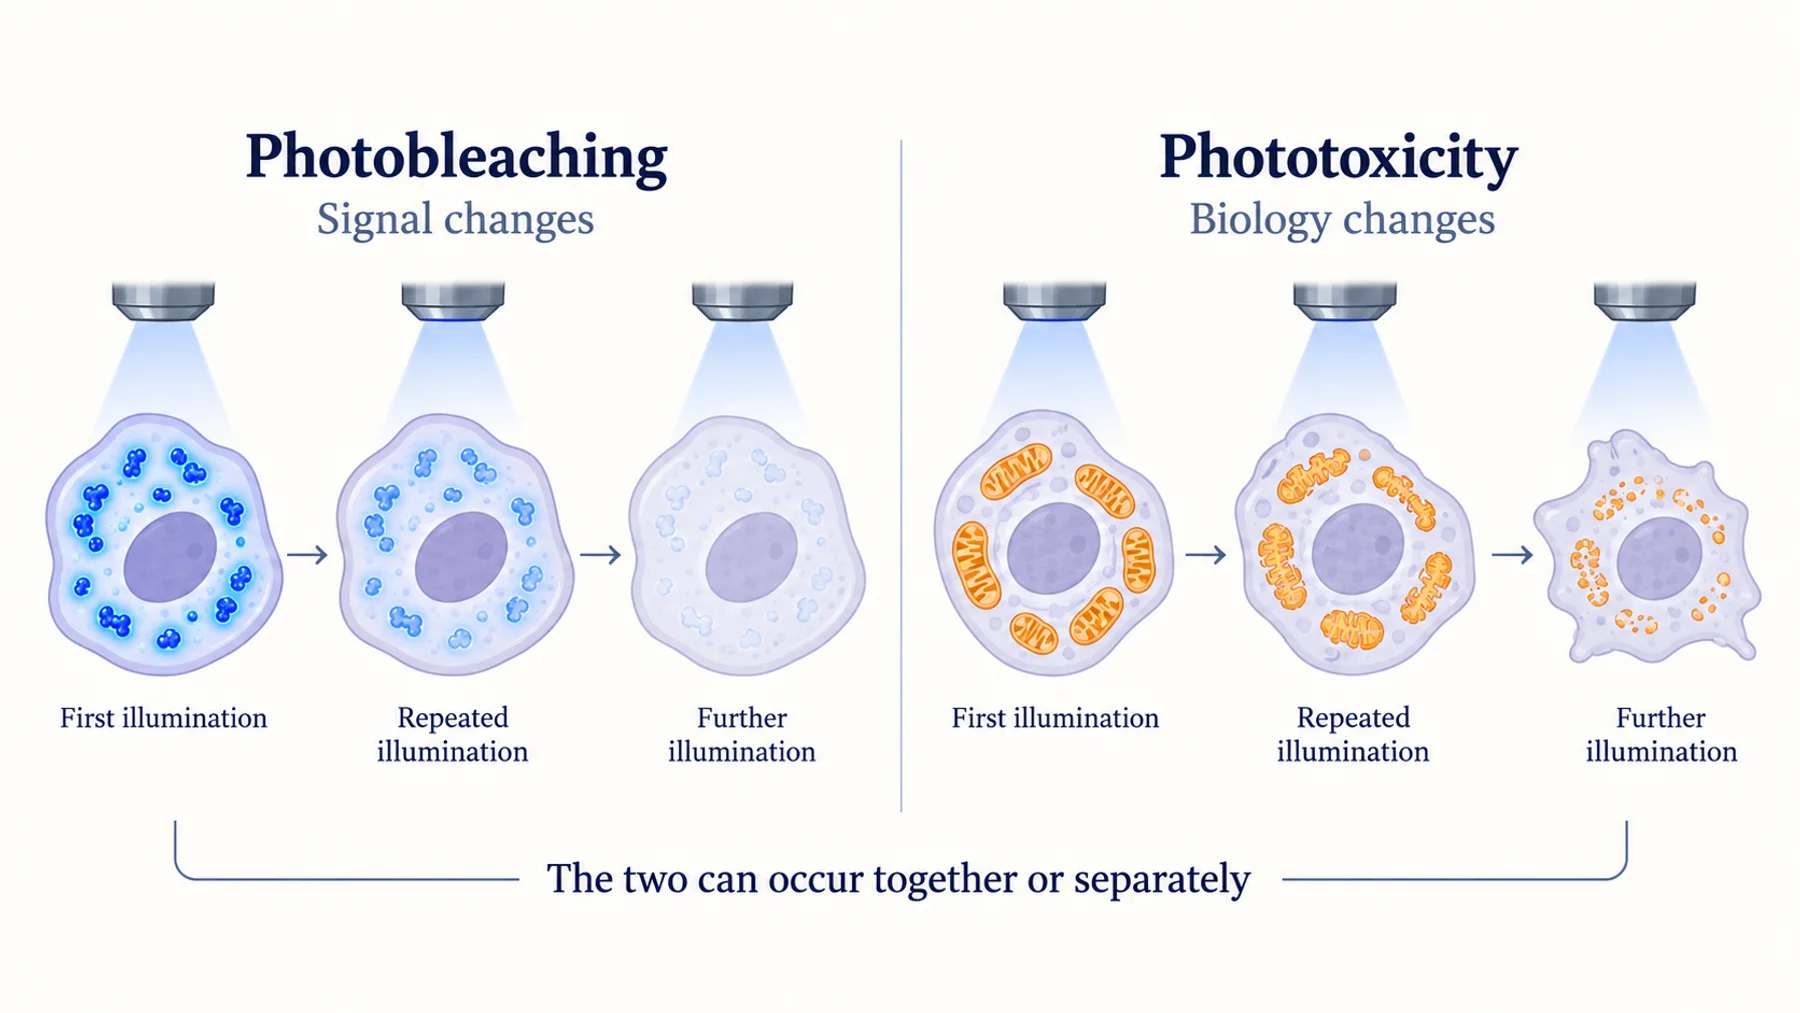
Photobleaching describes a change in the fluorescent signal; phototoxicity describes a light-induced change in the biological sample. The processes can occur together, but correcting one does not reverse the other. A stable image after numerical correction can still represent altered biology.
The useful objective is to collect enough information to answer the question while keeping the observation itself from changing the answer. That requires testing the full acquisition schedule, including exposure that does not produce a saved image.
Key Takeaways
- A fluorescent sample can be phototoxic without obvious bleaching, and can bleach without a detectable functional effect in the tested assay.
- Numerical bleaching correction cannot restore cells to an unperturbed state.
- Count illumination during focusing, channel changes, and acquisition overhead as well as recorded exposures.
- Define health using the biological function relevant to the experiment, not morphology alone.
- Optimize the complete experiment: wavelength, intensity, exposure, cadence, channels, depth, and duration.
Distinguish the Two Failure Modes
Photobleaching is a persistent loss of fluorescence caused by light-driven changes in the emitting system. Other processes can also make a sample dimmer, including movement, focus drift, reporter degradation, altered pH, or loss of labelled cells. A falling intensity trace should therefore be diagnosed before it is assigned entirely to bleaching.
Phototoxicity is a biological effect caused by illumination. It may change metabolism, signaling, motility, cell-cycle progression, or survival. The effect can occur before a cell looks damaged and can depend strongly on the sample and experimental context.
Figure 1. Signal preservation and biological fidelity are separate properties. Each combination requires its own interpretation; the diagram does not define universal acceptable thresholds.
The Laissue et al. assessment framework emphasizes practical, sample-specific evaluation of phototoxicity. A universal safe dose is not a substitute for measuring the effect on the process under study.
This distinction matters especially for biosensors. If the reporter measures redox state, metabolism, or calcium signaling, illumination can influence the very quantity the experiment intends to observe. The measurement and the perturbation can become entangled unless the controls separate them.
Map All the Light the Sample Receives
The exposure time saved in image metadata may not describe the complete illumination history. Samples can receive light during focusing, preview, autofocus, channel switching, stage movement, or delays between camera and light-source control.
Work on illumination overhead demonstrates why these intervals matter. Light reaching the sample when the detector is not collecting useful information adds exposure without adding corresponding data. Timing improvements can therefore reduce exposure while preserving the recorded measurement.
For each channel, record the illumination intensity at the sample when feasible, exposure duration, number of acquisitions, and any additional illuminated intervals. Laser percentage alone is not a portable physical dose because instruments, optical paths, and configurations differ.
Also record z-planes and repeated visits to the same region. A single time point in a multichannel z-stack may involve many exposures. A neighboring field can receive light from a broad illumination area even when it is not the current analysis region.
Figure 2. The illumination budget includes exposure that does not contribute to saved images. Timing, channels, and repeated sampling should be evaluated together.
The diagram is an accounting aid, not a rule that all light delivered at different times has equivalent biological effects. Dose rate, wavelength, recovery intervals, and sample chemistry can change the outcome even when a simple integrated exposure is the same.
Use a Dose Calculation Without Overinterpreting It
For constant irradiance I during an exposure of duration t, radiant exposure is H = I × t. If I is measured in watts per square centimeter and t in seconds, H is in joules per square centimeter. This is a physical accounting relationship, not a universal predictor of biological damage.
Consider a hypothetical widefield acquisition at 0.2 W/cm² for 50 ms per frame. Each exposure contributes 0.01 J/cm². Two hundred such exposures contribute 2 J/cm² at that irradiance, before adding other channels, focusing, or overhead. These numbers are illustrative and are not a recommended or safe imaging condition.
If the sample is also illuminated for another 50 ms around each exposure, the integrated exposure doubles without doubling the saved information. Reducing that overhead may be a better first intervention than simply lowering image quality.
For scanning systems, the relationship between reported laser power and local exposure is more complicated. Pixel dwell, scan geometry, repeated scans, and focal distribution matter. Use the instrument-specific information needed to characterize the exposure rather than applying a widefield calculation uncritically.
Measure the Function You Need to Preserve
A cell that remains attached is not necessarily behaving normally. A culture can retain a recognizable shape while changing its response to a stimulus. Choose a health endpoint sensitive to the process under study.
For a cell-division experiment, timing and completion of division may matter. For a contractile model, beating or contraction behavior may be relevant. For a metabolic experiment, a functional metabolic readout may be more informative than a terminal membrane-integrity measurement. The endpoint should help determine whether observation changes the interpretation.
A study of endogenous flavin photobleaching in cardiac myocytes reported functional changes without corresponding conspicuous morphological damage. It is a concrete example of why morphology alone can be an insensitive criterion.
Assess effects during and after the recording where feasible. Some changes may be delayed. A short recording that appears tolerated may not support a longer observation period or repeated sessions on the same sample.
Keep environmental stress separate where possible. Temperature, gas control, medium evaporation, osmolarity, and stage handling can change biology even without fluorescence excitation. A minimally illuminated control should otherwise experience comparable environmental conditions.
Build a Small Imaging-Control Experiment
Compare a few acquisition schedules that differ in a deliberate way. One condition might use the planned schedule, another a reduced exposure or cadence, and another minimal observation compatible with assessing the endpoint. The exact conditions should be chosen for the model and question.
Use the same treatment and sample preparation across these groups. If the lower-light group also spends less time outside the incubator, the comparison cannot isolate illumination. Record all major differences and avoid claiming a light-specific effect when several variables changed.
Predefine what counts as a meaningful change in biological function. The absence of a statistically significant difference in a small pilot does not prove equivalence. Consider the size of effects the experiment could detect and whether those effects would matter to the main conclusion.
| Comparison | Question it addresses |
|---|---|
| Planned versus reduced-light schedule | Does the result depend on observation intensity or cadence? |
| Labelled versus unlabelled under illumination | Does the label contribute to the effect? |
| Imaged versus minimally observed samples | Does the full observation workflow alter function? |
| Immediate versus delayed assessment | Are effects visible only after the recording? |
| Same illumination with matched environmental control | Can handling or culture conditions explain the difference? |
Treat these as complementary tests. A label-free sample that tolerates illumination does not establish that a labelled sample does, and a short-term viability result does not validate a sensitive signaling measurement.
Optimize in the Order That Preserves Information
First remove avoidable exposure. Limit prolonged fluorescence preview, use appropriate focusing strategies, and check light-source timing. These changes can preserve useful data while reducing illumination that contributes little to the answer.
Next consider whether every channel, z-plane, and time point is necessary. If the biological question concerns a slow trend, recording rapid frames may add little information. If the event is brief, fewer but longer exposures can blur it. The acquisition should follow the event's timescale rather than a habit inherited from another experiment.
Then improve photon collection where practical. Optical alignment, suitable objectives, detector settings, and an appropriate emission band can help collect useful photons efficiently. Increasing detector gain may change display or digitization but does not create missing photons; understand what the chosen setting actually changes.
Only then compare changes in excitation intensity, exposure, reporter, or imaging modality. Each intervention can affect resolution, motion blur, background, and throughput. Optimize the measurement outcome, not a single instrument setting.
Do Not Assume Equal Dose Means Equal Biology
Two schedules with the same integrated radiant exposure can differ in peak intensity, dark intervals, and duration. Photochemical pathways and cellular recovery can respond differently to those patterns. A convenient dose total is not enough to declare two schedules equivalent.
Similarly, changing wavelength changes more than photon energy. It changes which molecules absorb light, how strongly the sample attenuates it, which fluorophores are excited, and how much useful emission is detected. A longer wavelength can be beneficial in a particular setup without being universally harmless.
Test the candidate schedule in the actual reporter and model. If the intended experiment includes a treatment that sensitizes cells to light, assess the combined condition. A schedule tolerated by untreated cells may not be tolerated after a metabolic or redox perturbation.
Avoid treating protective additives as neutral fixes. Antioxidants, scavengers, or altered media can change the biology under study. In a redox or metabolism experiment, those changes may directly interfere with the scientific question. Their use requires a matched comparison and an explicit interpretation.
Bleaching Correction Has a Limited Job
A bleaching model can help estimate a trend in fluorescence unrelated to the intended signal, when its assumptions are justified. It cannot determine automatically which portion of a declining trace is bleaching and which portion is biology.
Fitting a decay to a treated sample can remove a real sustained biological decrease. Applying a decay from an untreated control assumes the same photophysics and reporter behavior under treatment. Both approaches require evidence that the correction is appropriate.
Inspect raw traces alongside corrected traces. Report the model, fitting interval, controls used, and whether the conclusion depends on the correction. If a result appears only after a strong model-dependent adjustment, that dependence is part of the uncertainty.
Ratiometric measurements can reduce some shared changes but remain vulnerable to unequal bleaching or channel-specific background. A stable ratio can also conceal loss of photons in both channels, with increasing uncertainty. Keep the raw channels and examine their signal quality over time.
A Worked Time-Lapse Redesign
Suppose a team records a fluorescent sensor every few seconds over several hours. Late in the experiment, the baseline drifts and the cells respond less strongly to a control stimulus. This hypothetical case has at least three possibilities: reporter bleaching, biological adaptation, or imaging-induced dysfunction.
Begin with a shortened diagnostic recording and a reduced-light schedule, keeping treatment and environmental conditions matched. Measure the control response in samples that experienced minimal prior illumination. If those samples retain responsiveness while extensively imaged samples do not, the observation history becomes a plausible contributor.
Next inspect how much light is delivered outside recorded exposures. If preview or overhead is substantial, correct that before changing the scientific sampling plan. Then test a lower cadence during periods where rapid dynamics are not required, while preserving adequate sampling around the event of interest.
Compare raw signal, response uncertainty, and the functional health endpoint. A redesigned schedule that produces slightly noisier images but preserves the response may be preferable. If neither schedule preserves biology, a different reporter, modality, or endpoint design may be needed.
The final acquisition should include the evidence used to choose it. That makes the experiment reproducible and prevents later operators from restoring a more visually impressive but biologically disruptive setting.
Redox and Metabolic Reporters Need Particular Care
When the measurement concerns redox chemistry or metabolism, illumination can affect both the reporter and the endogenous system. A peroxide-responsive reporter such as HyPer7 provides a defined chemical readout, but the assay still needs to distinguish treatment-associated changes from observation-associated changes.
Endogenous fluorescence is also biologically informative. Organoid metabolic imaging demonstrates the usefulness of such signals. It also motivates preserving the state that produces them: changes induced by the measurement can be mistaken for the biological response being sought.
For an emerging sensor, improved contrast or a new modulation mechanism does not exempt it from this assessment. Nebula investigates new protein-based research tools; any practical live-imaging application must demonstrate performance under an observation schedule compatible with the sample.
Report the Acquisition as an Experimental Intervention
Document wavelength bands, exposure, cadence, total duration, channels, z-planes, objective, detector, illumination timing, and relevant environmental control. Include irradiance or another justified physical description when available, rather than relying solely on instrument percentages.
Describe the biological endpoint used to assess imaging effects and the controls supporting the chosen schedule. State the limits: a result validated for one cell type, reporter level, and duration should not be presented as universally non-phototoxic.
Preserve missing or excluded time points and explain why they were removed. If heavily affected cells disappear from analysis, the surviving dataset can underestimate the effect of illumination. A transparent account of attrition is part of the measurement.
Common Questions
If my fluorescence does not bleach, can I assume the cells are fine?
No. Signal stability and biological function are different endpoints. Assess a relevant function under the complete acquisition schedule.
Can software correct phototoxicity?
Software can improve acquisition efficiency or model some signal changes. It cannot undo a biological perturbation that occurred during observation.
Should I always lower laser power and increase exposure time?
Not automatically. That changes timing, motion blur, dose rate, and possibly total exposure. Compare schedules using both measurement quality and biological effects in the intended experiment.
Diagram note: the cover and figures are conceptual illustrations, not experimental results. Numerical examples are identified in the text.