Five AlphaFold-Multimer models put the same two proteins together in five different ways. Model 1 has the highest ranking confidence. Model 3 has the cleanest interface PAE. Model 5 is the only one consistent with your cross-links. Which one do you take to the bench?
The answer cannot come from pLDDT alone. For complexes, the consequential scores are pTM, which estimates the accuracy of the overall arrangement, and ipTM, which focuses on the relative placement of interacting chains. AlphaFold-Multimer combines them as 0.2 × pTM + 0.8 × ipTM for its default ranking confidence. That weighting is useful, but it is not a verdict on biological assembly.
Key Takeaways
- pLDDT asks whether local geometry looks credible. It does not certify the orientation, stoichiometry, or even the existence of an interface.
- pTM estimates global fold and assembly accuracy. A low value often signals uncertain domain or chain placement even when local structures look excellent.
- ipTM emphasizes the interface. It is usually the better first ranking signal for a complex, but false interfaces can still score well.
- Read inter-chain PAE with ipTM. A compact low-error block at a biologically plausible interface is more informative than one composite number.
- Rank across hypotheses, not only models. Test plausible stoichiometries, constructs, conformational states, seeds, and MSA pairings.
- Experimental constraints outrank model confidence. A cross-link violation, impossible membrane geometry, or contradictory oligomeric mass is a reason to reject a high-scoring pose.
Four Confidence Outputs, Four Different Questions
AlphaFold confidence metrics are easiest to use when each is treated as an answer to a narrow question.
| Output | The question it addresses | Common misuse |
|---|---|---|
| pLDDT | Is the local environment around each residue likely to be modeled accurately? | “Both chains are high confidence, so they must bind this way.” |
| PAE | How uncertain is the position of residue x when the model is aligned on residue y? | Looking only at the diagonal blocks and ignoring inter-chain uncertainty. |
| pTM | Is the global arrangement of the modeled system likely to resemble the true arrangement? | Treating it as a direct interaction score. |
| ipTM | Is the relative placement of chains at the interface likely to be accurate? | Treating a high value as proof that the interaction occurs in cells. |
The metrics are related because they are derived from the model’s predicted error distributions, but they are not interchangeable. A protein can have two beautifully folded chains with pLDDT above 90 and still show uncertain relative placement. Conversely, a small interface can be internally consistent while flexible distal domains depress the global pTM.
AlphaFold-Multimer was designed specifically to improve complex prediction over the monomer system, and its authors used the interface-focused score to rank predictions (Evans et al., 2022). Subsequent benchmarks found that the system can recover many heteromeric interfaces, while also documenting important failures on difficult and weakly supported complexes (Bryant et al., 2022).
What pTM Tells You
pTM is a predicted version of TM-score, a length-normalized measure of global structural similarity. In a multichain model, it responds to errors in the arrangement of domains and chains, not just the quality of a single local patch.
A high pTM supports a coherent overall model. A low pTM may mean:
- one or more chains are poorly modeled;
- flexible domains have no stable relative orientation;
- long disordered segments dominate uncertainty;
- the chains are folded but assembled inconsistently;
- the requested stoichiometry is not well supported.
Do not interpret pTM as binding probability. AlphaFold is answering, “If this is the system I should model, how credible is the global geometry?” It is not directly answering, “Do these molecules form this complex under your assay conditions?”
What ipTM Adds
ipTM focuses the scoring calculation on inter-chain relationships. It is therefore sensitive to the part of a multimer prediction most bench scientists care about: which surfaces meet, in what orientation, and with what confidence.
As a working heuristic, models with higher ipTM deserve inspection before models with lower ipTM. But three caveats matter.
First, calibration changes with target class, implementation, version, chain length, and sampling protocol. A threshold that works for stable enzyme complexes may fail for antibody–antigen or peptide interactions.
Second, ipTM is conditional on the input. If you submitted a dimer but the protein is a tetramer, a confident dimer interface can still answer the wrong question.
Third, a geometrically credible interface does not establish biological relevance. Crystal contacts, transient encounters, membrane-forbidden poses, and competing partners can all complicate the interpretation.
Why the Default Ranking Can Pick the Wrong Model
AlphaFold-Multimer’s default ranking confidence gives four times as much weight to ipTM as pTM. That is reasonable when the primary goal is interface recovery. It can still mis-rank the model you need.
A small good interface on a bad global arrangement
Two chains may contact through a locally confident patch while a large domain is placed incorrectly. ipTM can keep the composite score high enough to win, even though the full assembly conflicts with SAXS or cryo-EM density.
A real interface obscured by flexible regions
Long tails and mobile domains can reduce pTM. A biologically correct core interface may rank below a more compact but incorrect arrangement. Trimming clearly disordered regions and re-running the same biological hypothesis can clarify the result.
Alternative interfaces with similar scores
When the top five models form two or three geometrically distinct clusters, a difference of a few hundredths in ranking confidence should not be treated as decisive. Cluster consistency across seeds and input perturbations often matters more.
Confident answer to the wrong stoichiometry
The model does not independently infer how many copies belong in the assembly. An A2 prediction and an A4 prediction are separate hypotheses. Comparing only the five A2 outputs never tests the tetramer.
Inter-Chain PAE: The View You Should Open Next
The PAE matrix contains one block for every chain-to-chain relationship. Diagonal blocks describe confidence within chains. Off-diagonal blocks describe confidence in the relative placement of different chains.
For a two-chain complex, a convincing interface often produces a localized low-PAE region in both off-diagonal blocks. The pattern should correspond to the residues that meet in the three-dimensional model.
Three patterns are especially useful:
- Broad low inter-chain PAE. The relative orientation is well determined across much of both chains. This is common for rigid, obligate complexes.
- A compact low-PAE island. One interface is supported, while distal regions remain mobile. This may be perfectly reasonable for a tethered or flexible assembly.
- Diffuse high inter-chain PAE. The chains may be individually folded, but their relative placement is not supported. A visually pleasing interface here is not enough.
PAE is directional: uncertainty for residue x aligned on residue y need not equal the reverse entry. For practical triage, inspect both off-diagonal blocks and map the low-error patch back to the structure.
A Ranking Workflow That Survives Contact With the Bench
1. Verify the biological prompt
Before comparing scores, check:
- sequences and isoforms;
- signal peptides and propeptides;
- missing cofactors or nucleic acids;
- plausible stoichiometries;
- relevant conformational state;
- membrane topology;
- whether the interaction is obligate, transient, or conditional.
2. Separate local folding from assembly
Inspect per-chain pLDDT and intra-chain PAE first. If a chain is poorly modeled, interface ranking inherits that uncertainty. If both chains are sound, focus on ipTM and off-diagonal PAE.
3. Cluster poses before ranking them
Group outputs by interface rather than by score. Ten nearly identical models are one hypothesis, not ten independent confirmations. A second pose that recurs across seeds may deserve testing even if it ranks slightly lower.
4. Perturb the run
Repeat with multiple seeds, MSA pairings, templates, and—where justified—construct boundaries. Genuine signal tends to recur. Prior-driven guesses often move.
5. Test stoichiometry explicitly
Run A, A2, A3, and A4 for a suspected homooligomer, subject to compute limits and biological plausibility. For heteromers, test the small set of stoichiometries supported by biochemistry rather than an unrestricted combinatorial search.
6. Apply hard physical constraints
Reject poses that violate:
- known cross-links;
- membrane sidedness or bilayer geometry;
- catalytic-site access;
- conserved disulfides;
- measured oligomeric mass;
- steric compatibility with known partners;
- mutational evidence that preserves folding but disrupts binding.
7. Rank the surviving hypotheses
A useful internal rubric is:
| Evidence | Strong support | Warning sign |
|---|---|---|
| ipTM | high relative to alternative poses and stable across reruns | high only in one seed |
| inter-chain PAE | coherent low-error patch at the proposed interface | diffuse or inconsistent patches |
| pTM | global assembly compatible with other data | distal domains or chains placed implausibly |
| pose consensus | same interface across seeds and perturbations | top models occupy unrelated surfaces |
| biology | stoichiometry, localization, and state make sense | input omits a required state or partner |
| experiment | orthogonal constraints agree | one hard contradiction |
Worked Example: Ranking a Regulatory Heterodimer
Suppose five models of chains A and B produce these outputs:
| Model | pTM | ipTM | Default ranking | Observation |
|---|---|---|---|---|
| 1 | 0.72 | 0.81 | 0.79 | violates two cross-links |
| 2 | 0.79 | 0.75 | 0.76 | broad low inter-chain PAE, one steric clash |
| 3 | 0.76 | 0.78 | 0.78 | satisfies all cross-links; same pose in four seeds |
| 4 | 0.68 | 0.80 | 0.78 | interface blocks known catalytic access |
| 5 | 0.82 | 0.67 | 0.70 | chains fold well but relative placement varies |
Model 1 wins the default ranking. Model 3 is the stronger experimental hypothesis. Its small score disadvantage is outweighed by reproducibility and independent constraints.
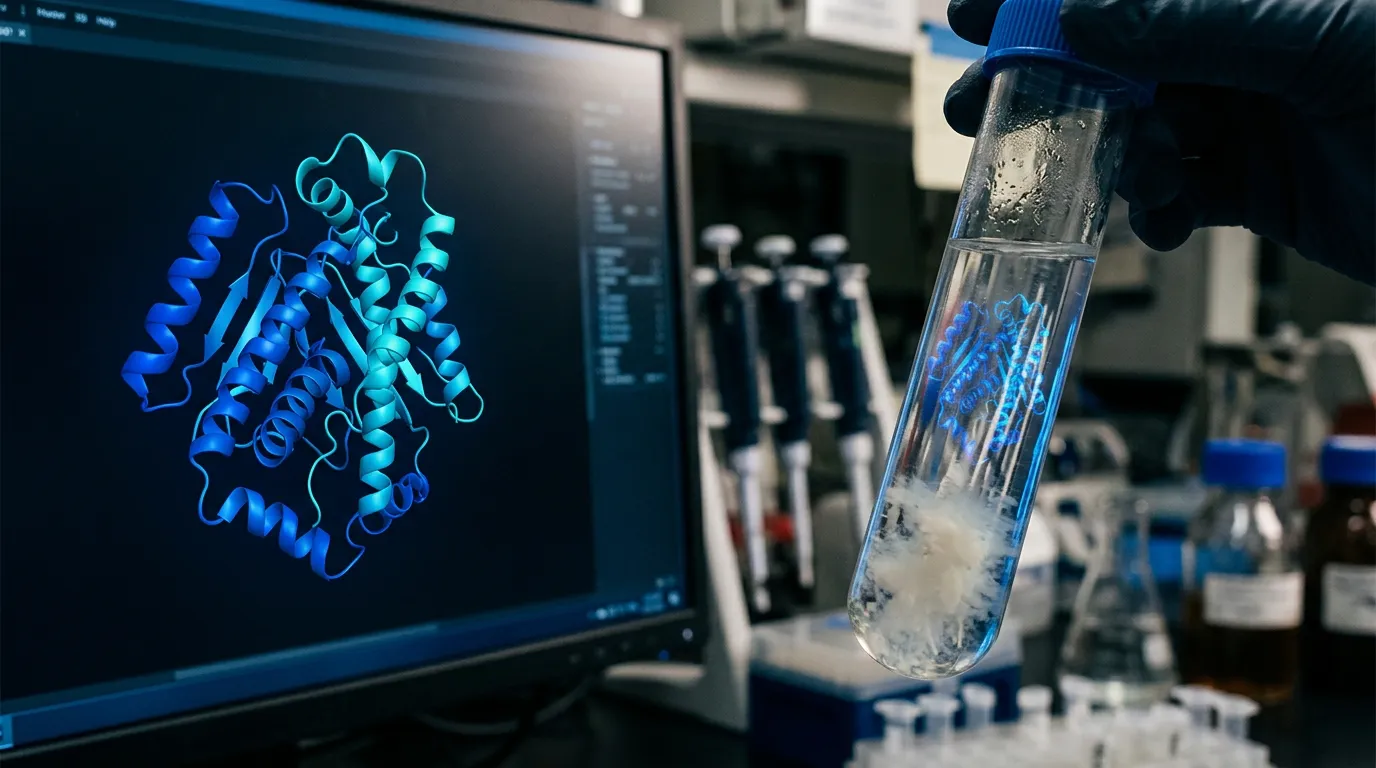
The correct decision is not to declare model 3 true. It is to use model 3 to design the next discriminating experiment—perhaps two interface substitutions that retain fold, or a cross-link unique to that pose.
Which Experiment Should Follow the Ranking?
Match the experiment to the uncertainty:
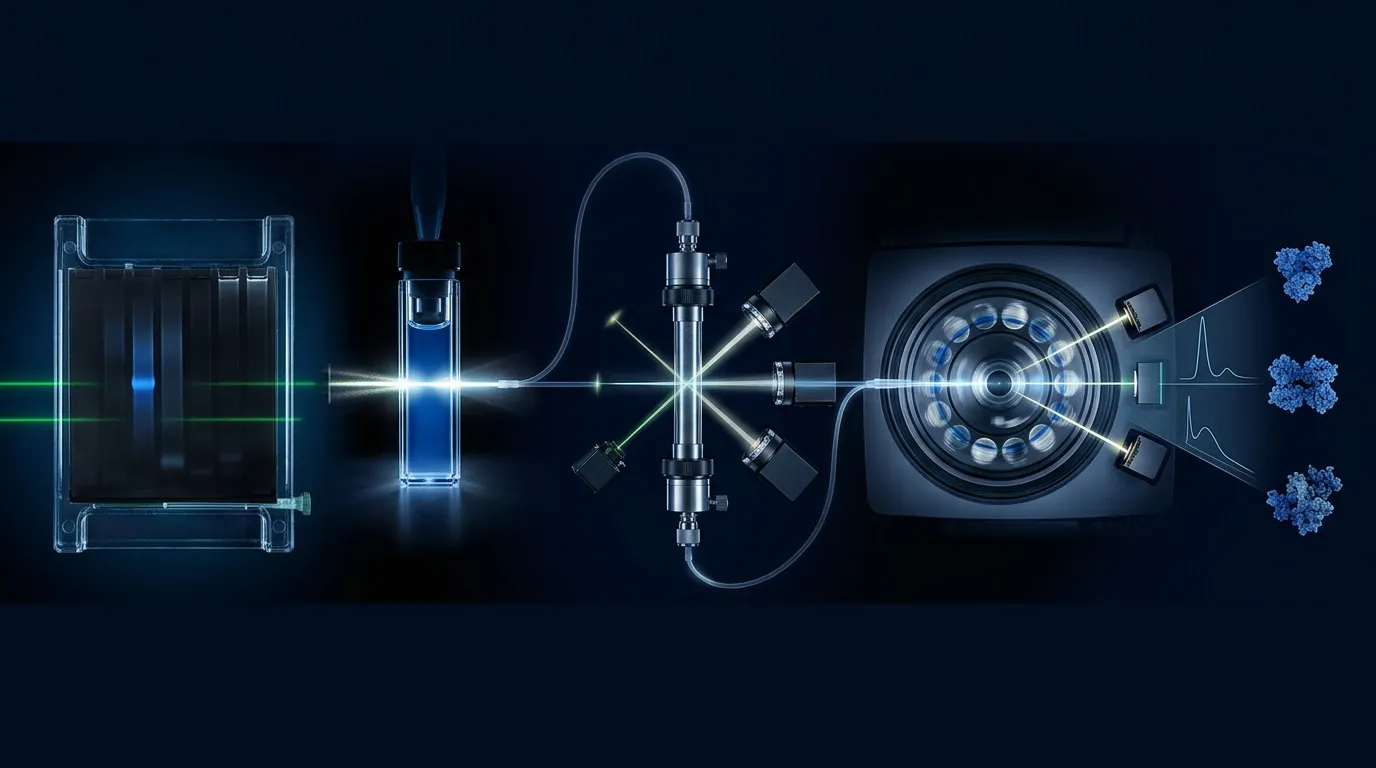
- Stoichiometry uncertain: SEC-MALS, analytical ultracentrifugation, native MS, or mass photometry.
- Interface location uncertain: HDX-MS, cross-linking MS, NMR chemical-shift perturbation, or carefully controlled mutagenesis.
- Affinity uncertain: SPR, BLI, MST, or ITC with controls for nonspecific association.
- Global arrangement uncertain: SAXS, negative-stain EM, or cryo-EM.
- Membrane geometry uncertain: reconstitution, accessibility measurements, or structural work in an appropriate membrane mimic.
A Better Way to Review Complex Predictions
Orbion’s PAE Insight Engine makes predicted-error patterns easier to translate into structural hypotheses, including domain relationships and inter-chain uncertainty. For complex work, combine that view with AlphaFold-Multimer outputs, interface contacts, buried surface area, and alternative stoichiometries. The point is not to manufacture a single certainty score. It is to expose why one model deserves the next experiment and why another does not.
If you want the broader failure-mode checklist, read When AlphaFold-Multimer Gets Protein Complexes Wrong. For the local-versus-relative confidence distinction, see The 6 Cases Where pLDDT Confidence Misleads You.
Bottom Line
pTM and ipTM are not obscure extras. They are the confidence outputs that turn a multimer model from a pretty picture into a rankable hypothesis. Use ipTM to focus on the interface, pTM to check the global arrangement, and inter-chain PAE to see where the confidence actually lives. Then force the model to compete against alternative stoichiometries, seeds, constructs, and experimental constraints.
The highest score is a starting point. The best complex model is the one that survives the most attempts to falsify it.
References
- Evans R, et al. Protein complex prediction with AlphaFold-Multimer. bioRxiv. 2022. doi:10.1101/2021.10.04.463034
- Jumper J, et al. Highly accurate protein structure prediction with AlphaFold. Nature. 2021. doi:10.1038/s41586-021-03819-2
- Bryant P, Pozzati G, Elofsson A. Improved prediction of protein-protein interactions using AlphaFold2. Nature Communications. 2022. doi:10.1038/s41467-022-28865-w
- Mirdita M, et al. ColabFold: making protein folding accessible to all. Nature Methods. 2022. doi:10.1038/s41592-022-01488-1
- Abramson J, et al. Accurate structure prediction of biomolecular interactions with AlphaFold 3. Nature. 2024. doi:10.1038/s41586-024-07487-w