An organ-on-chip experiment can record pump pressure every second while measuring tissue function only at a few selected time points. Both datasets are useful, but they answer different questions. The frequency of instrument telemetry does not establish the frequency of biological observation.
Choose a monitoring strategy by defining the biological event, its location, and the timing needed to resolve it. Then compare sampling, imaging, electrical measurements, and integrated chemical sensors against that requirement. “Real time” should describe a useful temporal relationship to the biology, not simply a fast data stream.
Existing research already demonstrates integrated monitoring in organ-on-chip systems. The practical challenge is choosing a combination that remains calibrated, interpretable, and compatible with the model throughout the experiment.
Key Takeaways
- Separate device function, culture environment, and tissue function in the monitoring plan.
- A sensor near the inlet, a local image, and an outlet assay sample different locations and histories.
- Transport delay, mixing, sensor kinetics, and assay duration all affect apparent timing.
- Repeated measurements do not create independent biological replicates.
- More frequent data are valuable when they change a biological inference or experimental decision.
Define the Event You Need to Resolve
Start with a specific question: when does barrier function change, how quickly does a secreted marker rise, does a metabolic response recover, or which tissue region changes first? These questions require different measurements.
Write the expected timescale and the timing uncertainty you can tolerate. A study of an early transient event may need local, rapid observation. A study comparing sustained functional states may be served by a slower, robust assay. The fastest available sensor is not automatically the most appropriate.
Also specify whether the objective is observation or intervention. A monitoring system that triggers a change in perfusion or dosing needs a reliable decision rule and an understood delay. A descriptive experiment may tolerate offline analysis, provided the timestamps and measurement windows are preserved.
Define the smallest event that would matter before selecting thresholds. Otherwise, a highly sampled but noisy trace can encourage post hoc interpretation of fluctuations that have no established biological significance.
Separate Three Kinds of Information
Device telemetry describes the operation of pumps, valves, pressure control, temperature control, or other hardware. Environmental sensing describes conditions such as oxygen or pH near a sensor. Functional measurements concern properties of the tissue, such as barrier behavior, electrical activity, secretion, or a reporter response.
The categories interact but are not equivalent. A stable pump does not establish stable tissue function. A change in outlet pH may reflect metabolism, buffering, flow, or gas exchange. An electrical signal can be a direct functional readout for one model while being irrelevant to another.
Keep the categories explicit in dashboards and analysis files. That makes it easier to distinguish a biological event from a device event and to locate the appropriate follow-up measurement. It also prevents an instrument's operating specification from becoming an unsupported claim about biological sensitivity.
Published precedents show that several modalities can be combined. Zhang et al. demonstrated a modular platform integrating physical, biochemical, and optical sensing with organ-on-chip systems. The result establishes a particular implementation, not a universal capability or limitation of every commercial platform.
Place Each Measurement on the Fluidic Map
Draw the culture chamber, inlet, outlet, reservoirs, tubing, sampling points, and sensor positions. Mark recirculating and single-pass flow separately. Then identify the environment each measurement actually samples.
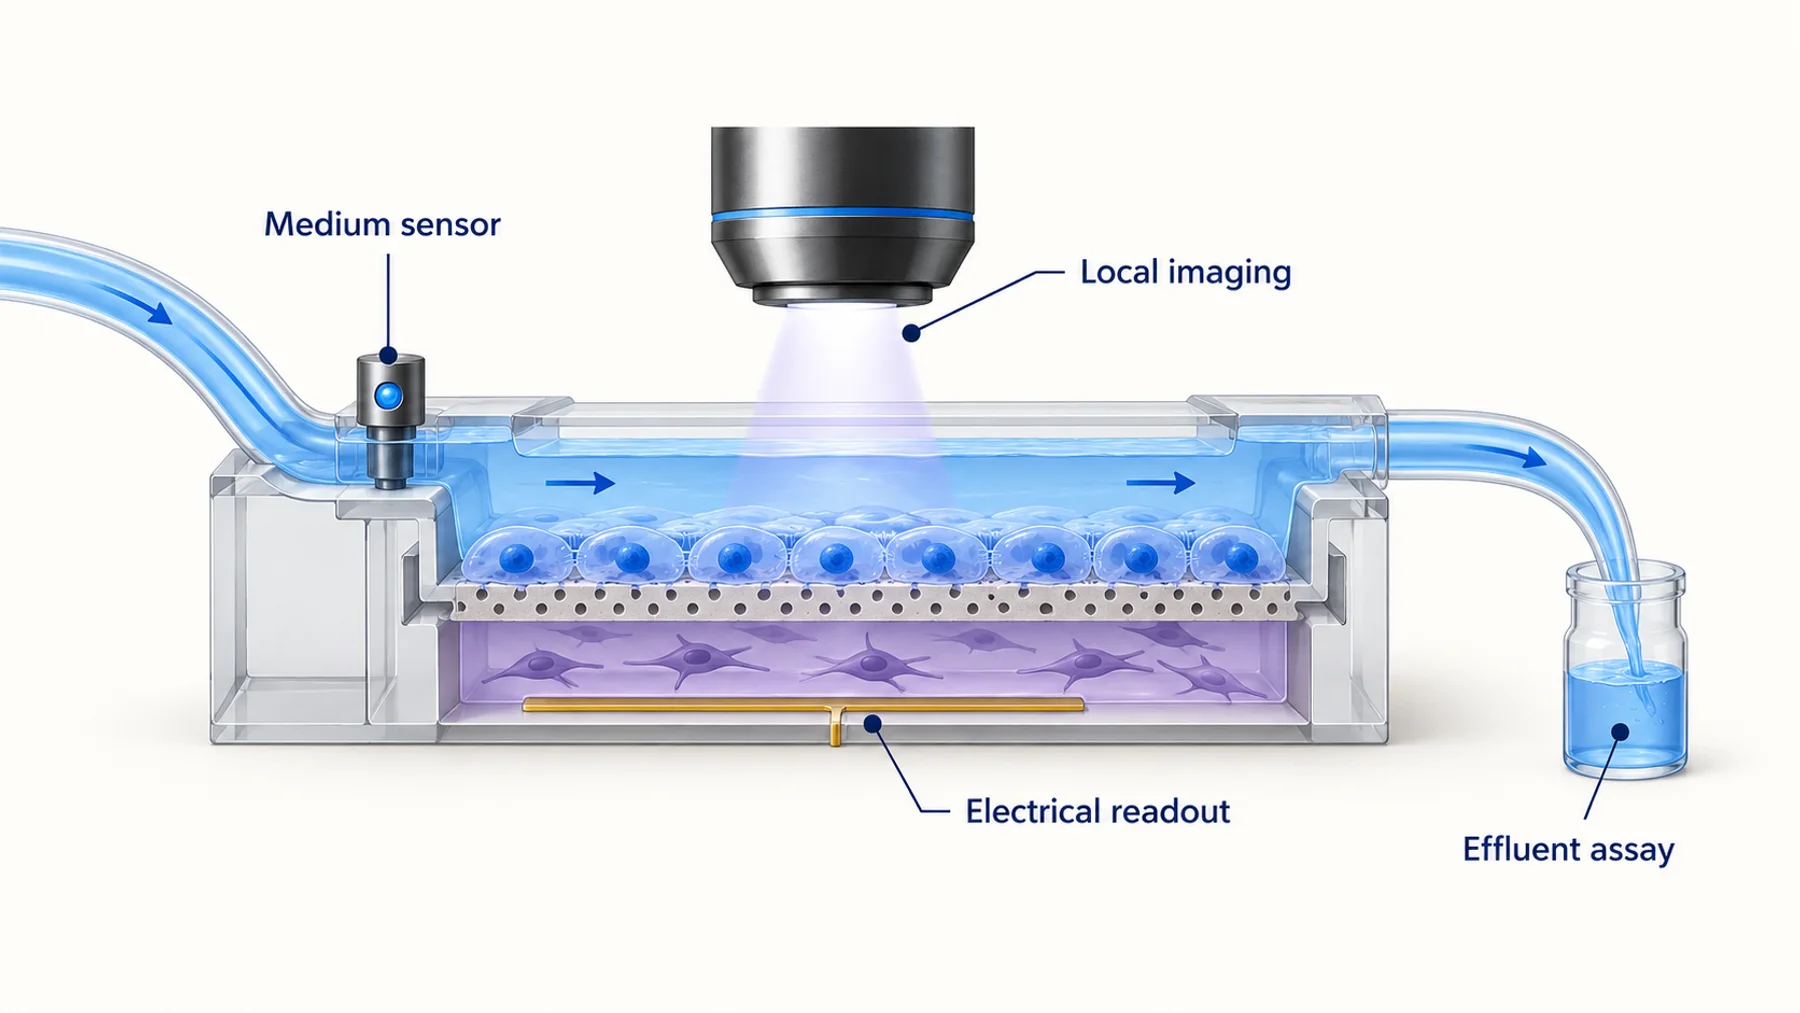
An inlet measurement can characterize what arrives at the device. An outlet measurement combines material leaving the tissue with transport through the downstream path. A local image may resolve a particular cell region. A sensor embedded near the tissue measures its immediate environment, which may differ from the interior of a thick construct.
Figure 1. Measurement location determines what part of the system is observed. The diagram represents a generic layout rather than a specific commercial instrument or validated combined assay.
If the experimental question concerns a spatial gradient, an averaged outlet concentration may be insufficient even when measured frequently. If the question concerns total secretion over an interval, a local image may add complexity without replacing the needed mass measurement.
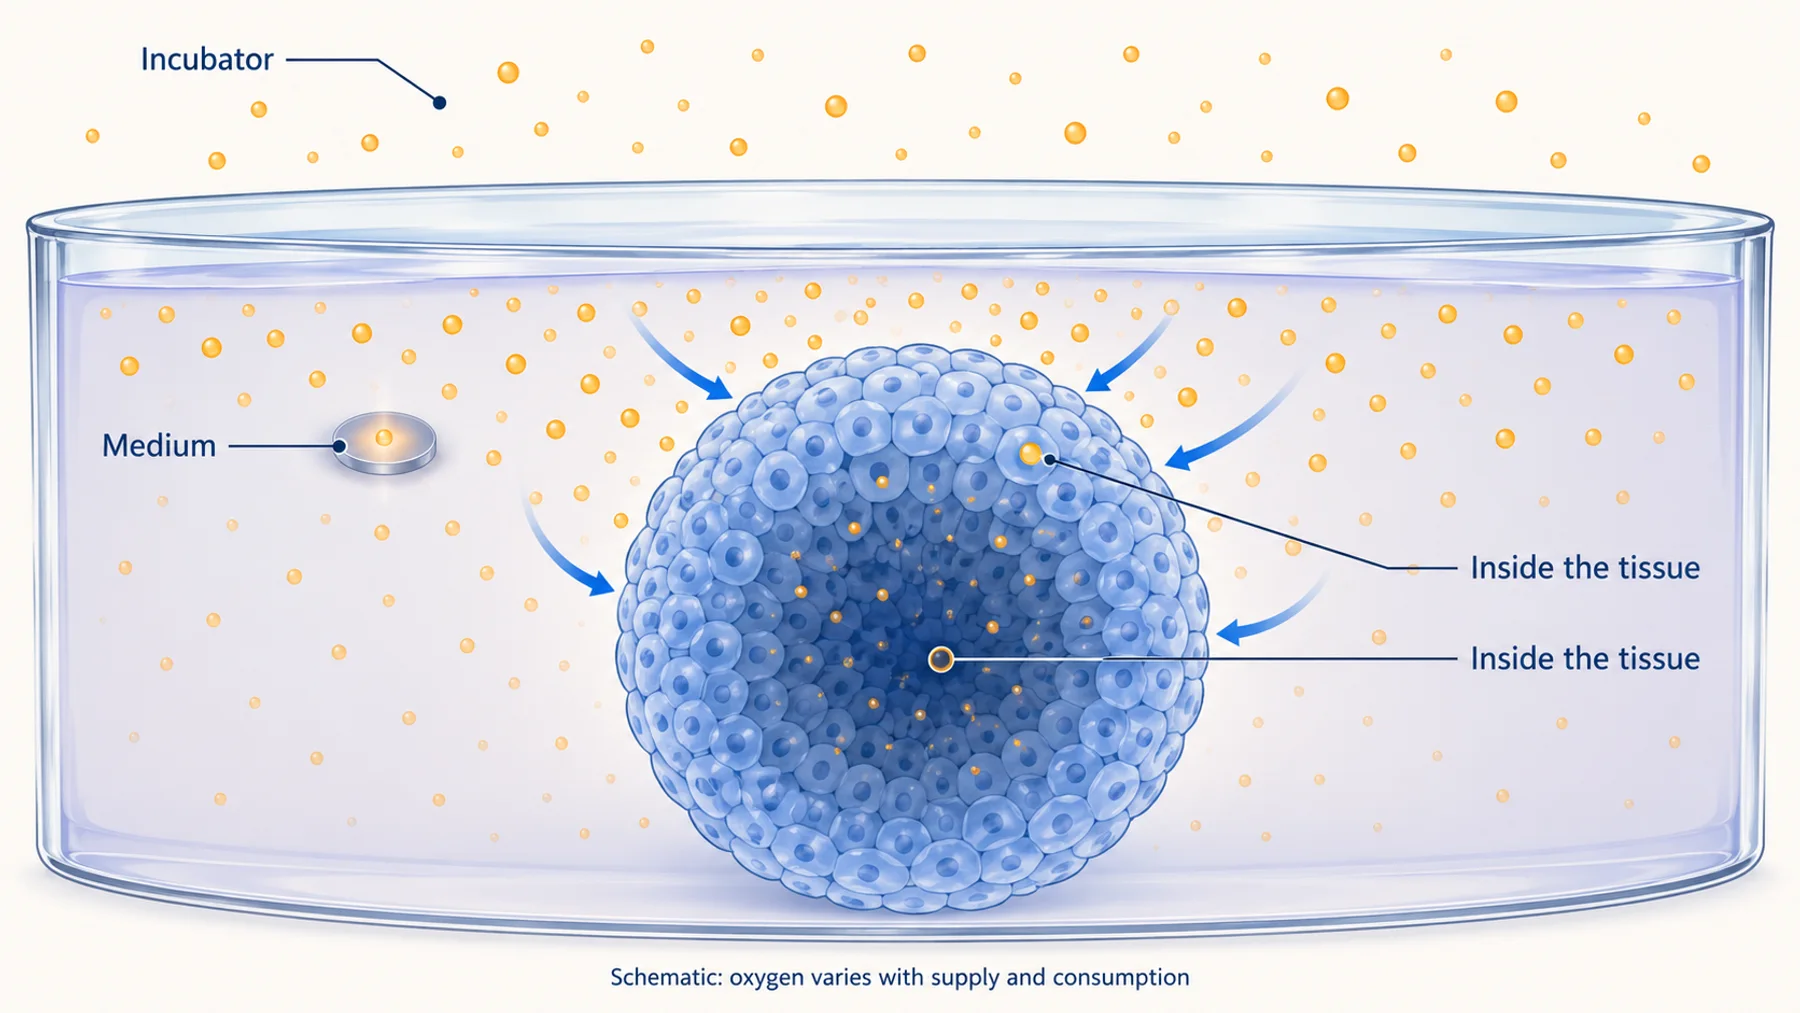
Oxygen provides a clear example. Local organoid oxygen imaging and integrated oxygen sensing in 3D culture address related but different measurement geometries. Compare their sampling locations before treating their outputs as interchangeable.
Account for Transport Delay Before Interpreting Timing
For an idealized plug-flow path, the average transit time is approximately t = V / Q, where V is the fluid volume between the event and the measurement point and Q is the flow rate. This is a first estimate, not a complete description of a real microfluidic system.
In a hypothetical example, 60 microliters of downstream volume at 10 microliters per minute gives a nominal transit time of six minutes. A sensor reading every few seconds still observes a transported signal. Mixing, dispersion, adsorption, and dead volumes can broaden or distort it further.
Figure 2. Fast acquisition does not remove transport delay. The traces are schematic, and the six-minute example is calculated from an idealized volume-to-flow ratio rather than measured device data.
Calibrate timing with an appropriate tracer or controlled change when the interpretation depends on onset or event order. The relevant test should reflect the assembled flow path and, where needed, the analyte's interactions with it. A tracer that moves freely may not describe a protein that binds to surfaces.
Separate the time the treatment is commanded, the time it reaches the tissue, the time the tissue responds, and the time the response reaches the detector. These distinctions become essential when comparing two channels or claiming that one biological event precedes another.
Sampling Can Be the Right Answer
Off-chip assays can offer established analytical specificity, flexible assay selection, and access to measurements that are difficult to integrate. Automation can improve consistency and reduce manual workload. Those advantages should be compared fairly with integrated sensing.
Sampling also changes the system. Removing fluid can change volume, concentrations, and the history of secreted factors. Replacement medium can dilute analytes or introduce a new environmental condition. Record withdrawn and replaced volumes and use a mass-balance model appropriate to the flow configuration.
In a simple closed-volume example, removing 10% of the well volume and replacing it with analyte-free medium would immediately reduce the remaining analyte concentration to 90% of its prior value, assuming complete mixing and no other changes. This illustrative calculation is not a model for a perfused or recirculating system without further accounting.
The time assigned to an assay result should also be clear. A sample may represent an instantaneous withdrawal, a pooled collection over an interval, or an accumulated reservoir. The subsequent assay completion time is not the biological sampling time.
Imaging Adds Location and Cell-Level Context
Imaging can reveal where a response occurs and whether a population average hides different cell behaviors. It can also connect a functional reporter to morphology, movement, or tissue structure when the acquisition and analysis support those comparisons.
Integration constraints include working distance, optical path, plate geometry, materials, focus stability, and access under ongoing flow. A platform compatible with endpoint imaging is not necessarily compatible with repeated observation in its operating configuration.
Reporter introduction is another constraint. A primary-cell model without a validated reporter may require a different strategy from a stable reporter line. Delivery and expression can alter the model, and an imaging assay must distinguish those effects from the treatment response.
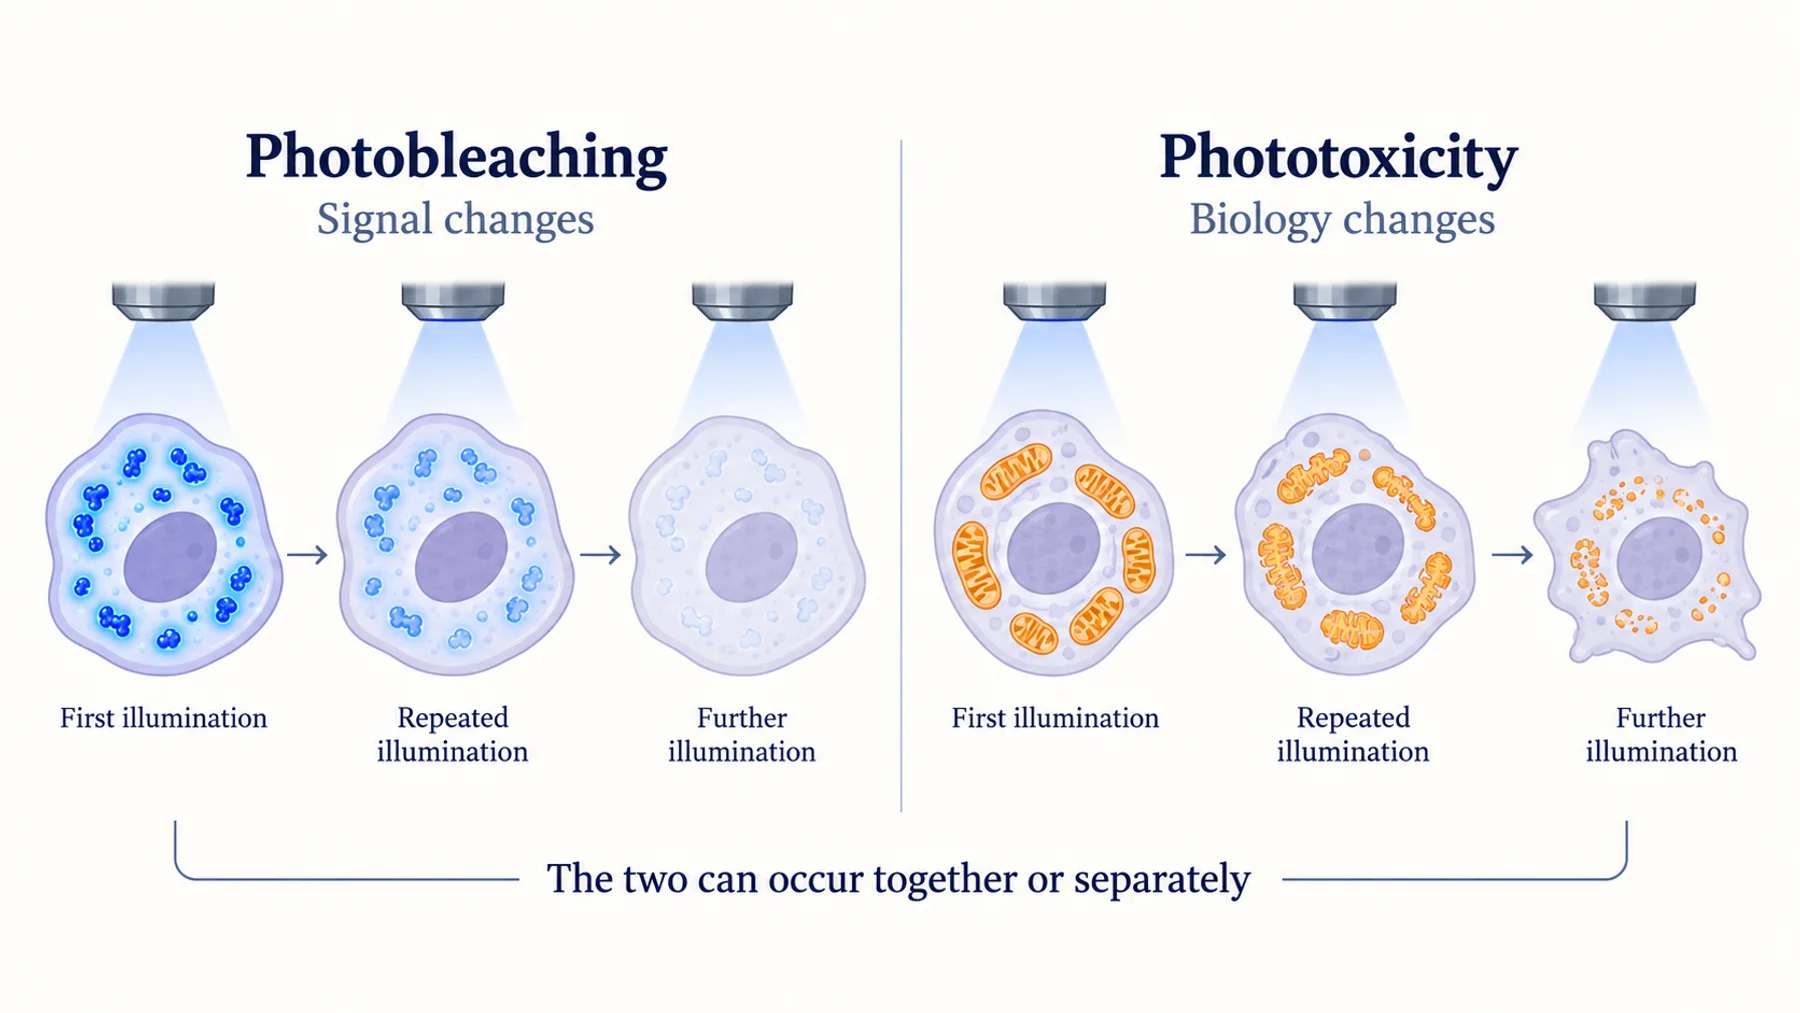
Repeated imaging should be evaluated for phototoxicity under the complete schedule. Reduced handling does not automatically mean reduced perturbation if the system receives substantially more illumination.
Integrated Sensors Reduce Some Burdens and Add Others
An integrated sensor can provide repeated access to an environmental or biological quantity without removing each sample. Its practical value depends on stability, calibration, fouling, replacement, and compatibility with the culture.
Consider how sensor response changes over the experiment. Adsorbed proteins or cells can alter access to the sensing surface. Drift can resemble a slow biological trend. A sensor that cannot be recalibrated in place may require reference measurements or a justified strategy for detecting loss of validity.
Electrical readouts are another established option. Maoz et al. combined multi-electrode arrays and barrier-resistance measurements in an organ-chip implementation. Such readouts can provide functional information, but their interpretation depends on geometry, cell coverage, medium properties, and the biological process.
For barrier studies, distinguish electrical resistance from the permeability of a particular molecule. They can be complementary measurements, not numerical substitutes. For secreted biomarkers, distinguish concentration near a sensor from total production by the tissue.
Compare Methods Against the Same Decision
| Strategy | Useful strength | Main integration question |
|---|---|---|
| Repeated sampling | Established downstream assays and flexible analytes | Volume changes, timing, handling, and assay delay |
| Local imaging | Spatial information and cell-resolved behavior | Optical access, reporters, phototoxicity, and analysis |
| Integrated chemical sensing | Repeated local environmental or analyte measurement | Calibration, drift, fouling, and selectivity |
| Electrical measurement | Continuous access to suitable functional properties | Geometry, cell coverage, and interpretation of the electrical quantity |
Avoid comparing a high-resolution local method with a bulk method using only sampling frequency. They may answer different questions. State which improvement would matter: earlier event detection, more reliable recovery measurement, lower sample use, or better separation of heterogeneous responses.
A combination can be more informative than a replacement. Local imaging may establish where a change occurs while periodic sampling supplies an orthogonal marker. An integrated environmental sensor may explain a fluctuation in a functional readout. Plan those relationships in advance so the combined dataset has a clear purpose.
A Worked Monitoring Plan
Imagine a study asking whether a treatment causes an early reversible change before a sustained loss of function. This hypothetical example could apply to several tissue models, but the actual markers and controls must be selected for the biology.
First, identify a functional readout with a response time capable of resolving the early change. Determine whether it can be observed locally or must be sampled downstream. If downstream, characterize transport and assay timing before interpreting event order.
Second, select a slower orthogonal endpoint that tests the sustained functional state. The two methods need not agree point by point if they report different quantities. Their role is to test a defined sequence of biological interpretations.
Third, monitor the device and environment sufficiently to identify interruptions, bubbles, temperature changes, or flow anomalies. Preserve those events in the analysis rather than deleting affected intervals without explanation.
Finally, define the recovery window, criteria for a usable sample, and the unit of replication. If multiple tissues share a recirculating circuit, they may not be independent. If a chip produces thousands of time points, those are repeated observations of the same experimental unit, not thousands of separate biological experiments.
Validate the Whole Monitoring Loop
Bench calibration of a sensor is only one stage. Test the sensor in the assembled flow path, then in the culture environment, then under the relevant treatment and duration. Each transition can introduce a new source of error.
Use controls that identify whether a change is biological, fluidic, or instrumental. A blank device helps characterize materials and transport. A culture without the reporter helps characterize optical background. A controlled input can test timing and response capacity. An independent assay can support the biological interpretation.
Keep raw data, timestamps, calibration versions, and analysis settings together. If the sensor is replaced or the tubing configuration changes, record that event. Otherwise, an apparent biological discontinuity may simply reflect a different measurement system.
Predetermine how missing intervals will be handled. Interpolation can be useful for display, but it should not create evidence for an event during a gap. Report the actual observation coverage when claiming continuous monitoring.
Where New Protein Reporters Could Add Value
A new protein-based reporter could be useful if it enables a specific local measurement, improves signal separation, or supports a practical repeated assay. The advantage must survive integration with the tissue model, optics, flow, and analysis.
Nebula investigates responsive proteins as potential sensing tools. A meaningful application brief would specify the biological quantity, compartment, useful cadence, acceptable perturbation, and established comparator. Those requirements turn a broad interest in “real-time sensing” into an experiment that can test value.
The first useful milestone may be a modest but reliable improvement in one readout. A narrower validated measurement is more actionable than an ambitious dashboard whose channels have uncertain biological meaning.
Common Questions
Does real-time monitoring require measurements every second?
No. The useful cadence depends on the event and decision. A slower reliable measurement may answer a question better than a faster readout dominated by transport delay or drift.
Can outlet concentration be interpreted as secretion rate?
Only with an appropriate mass balance and assumptions about flow, mixing, loss, accumulation, and exchange. Concentration alone is not a rate.
Does integrating a sensor remove the need for sampling?
Not necessarily. Periodic sampling can provide calibration checks or orthogonal evidence. The right combination depends on the quantities and uncertainty that matter to the study.
Diagram note: the cover and figures are conceptual illustrations, not experimental results. Numerical examples are identified in the text.