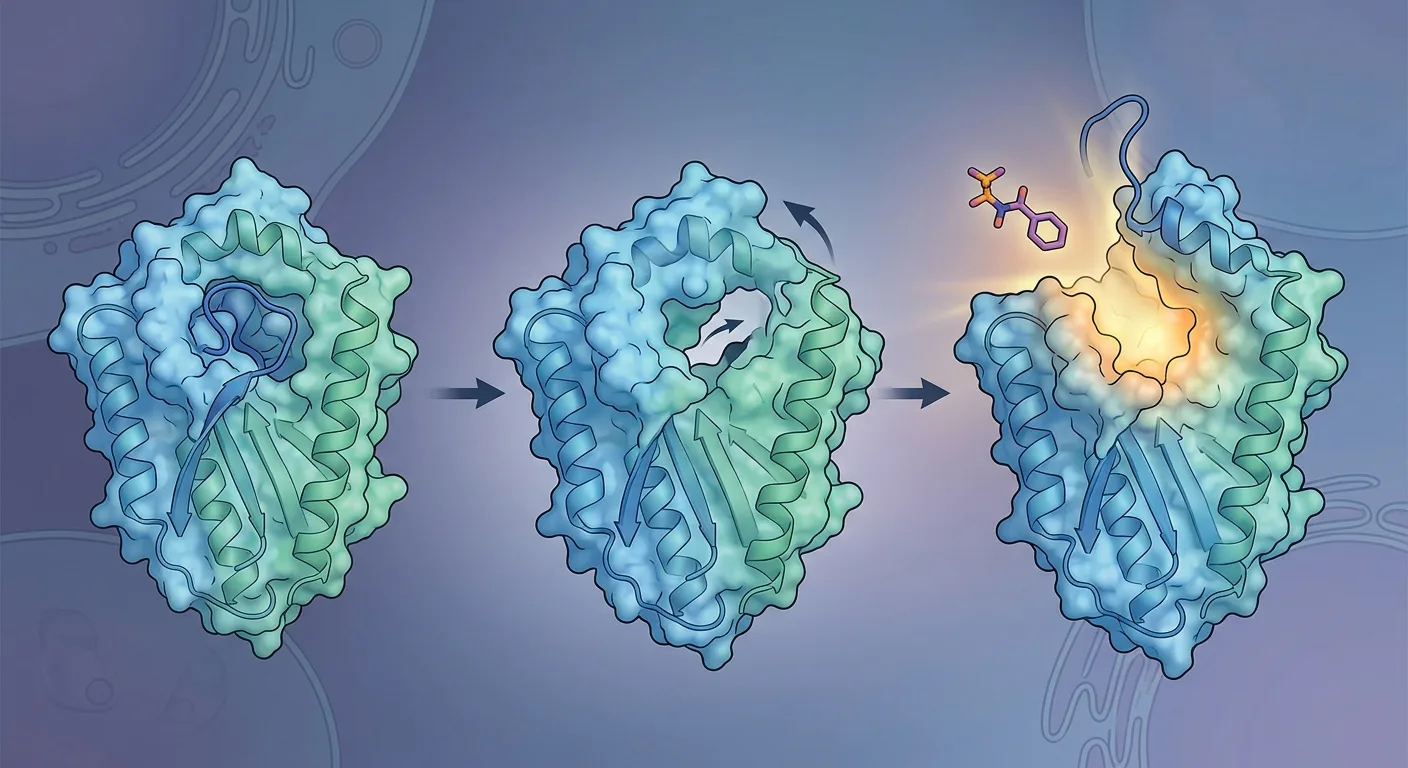
You want to compare detergents, ligands, or stabilizing mutations. A thermal-shift assay seems like the obvious first screen, but the baseline is high, the curves are irregular, or the most stable-looking sample is inactive.
Choose a membrane-protein stability assay by its signal mechanism and compatibility with your sample. DSF, nanoDSF, and CPM can report useful changes during heating, but they observe different events. Their apparent melting temperatures are not interchangeable measures of native-state stability.
The first question is therefore not “which instrument gives the best Tm?” It is “what change in this sample will generate the signal, and can I distinguish it from background or aggregation?”
Key takeaways
- Choose the assay from its reporter chemistry and compatibility with the sample.
- Separate a fluorescence transition from aggregation, chemical labeling, and retained function.
- Report uninterpretable curves separately from valid measurements showing no change.
Three assays, three observation channels
| Approach | Typical signal | Main question before screening |
|---|---|---|
| Dye-based DSF | A dye responds to exposed hydrophobic environments | Will detergent or another component generate background or alter the dye response? |
| nanoDSF | Intrinsic fluorescence changes during heating, often using a wavelength ratio | Does this protein have a measurable, interpretable fluorescence change in this formulation? |
| CPM | A thiol-reactive fluorescent probe responds as accessible cysteines react | Are informative cysteines present, and is the chemistry compatible with the buffer? |
The table describes common implementations, not every instrument or reagent formulation. Check the method you actually use. A screen that works for one membrane protein can fail for another because reporter residues, detergent binding, redox state, and aggregation behavior differ.
Figure 1. Dye-based DSF, intrinsic fluorescence and thiol-sensitive probes observe different molecular environments. The artwork is conceptual; it does not specify an assay outcome or transition temperature.
Dye-based DSF: establish the background first
Hydrophobic dyes are attractive because they can turn structural changes into a plate-based readout. Membrane-protein formulations also contain hydrophobic environments that are unrelated to protein unfolding. Detergent micelles, lipids, and exposed surfaces can complicate both baseline and temperature-dependent signal.
Run formulation-plus-dye blanks through the full temperature program. Include the relevant detergent or lipid concentration, additives, and ligand solvent. A room-temperature blank alone will not reveal a background that changes during heating.
Inspect raw curves before fitting a transition. A high baseline, multiple features, or a signal dominated by the blank may make a numerical Tm uninformative. Subtracting background is useful only when its behavior is sufficiently reproducible and the corrected signal remains interpretable.
A dye-based assay can still be valuable if these checks succeed. The point is to validate the observation channel before spending the full sample budget on a matrix of conditions.
Why the same protein can give different transition temperatures
A fluorescence experiment does not count folded molecules directly. It measures a signal whose relationship to conformation depends on the reporter. A hydrophobic dye may become brighter as binding environments become accessible; intrinsic fluorescence can change as aromatic residues experience different surroundings; a thiol-reactive probe reports accessible reactive sites. The onset and midpoint of these events need not coincide.
For a simple reversible two-state transition, a suitable observable may be related to a folded/unfolded population balance. Many practical membrane-protein screens do not establish those assumptions. Multiple domains, aggregation, chemical labeling, or irreversible changes can contribute. Calling the fitted result an apparent transition temperature preserves its usefulness without implying an equilibrium thermodynamic measurement.
The original dye-based approach described by Niesen, Berglund and Vedadi (2007) used fluorescence changes to detect ligand-associated stabilization. Its value as a screening method does not imply that a single temperature shift can identify affinity independently of the experimental system. Ligand concentration, accessible binding states, and the measured unfolding process all affect interpretation.
This distinction becomes practical when two readouts disagree. If intrinsic fluorescence changes first and scattering rises later, those may be separable events in the sample's response to heating. If the order reverses, the fluorescence feature may occur after substantial aggregation. Neither trace should be reduced to one “stability number” without retaining that sequence of observations.
Across variants, the reporter itself may also change. A mutation near an aromatic residue can alter fluorescence sensitivity; a cysteine substitution changes the chemical opportunities available to CPM. A difference in signal amplitude is therefore not automatically a proportional difference in the amount of folded protein. Compare the physical claim made by each curve before comparing its fitted parameter.
nanoDSF: no extrinsic dye does not mean no interference
nanoDSF follows intrinsic fluorescence associated principally with aromatic residues. It can avoid some problems caused by an added hydrophobic dye, but signal quality still depends on protein concentration, reporter environment, formulation, and instrument configuration.
Inspect the individual fluorescence channels as well as the ratio and derivative. A ratio can look smooth while one channel is weak or changing for an unrelated reason. Fluorescent ligands, absorbance, scattering, and aggregation may complicate interpretation.
Kotov and colleagues used intrinsic fluorescence and light scattering in a membrane-protein detergent-screening study. Their work demonstrates the value of observing more than one aspect of sample behavior. It does not establish that every detergent–protein combination will produce a simple unfolding transition.
If the instrument also reports aggregation onset, keep that result separate from the fluorescence transition. The two observations may occur in different orders and answer different questions.
CPM: confirm that thiol exposure is informative
CPM-based assays use a thiol-reactive probe. Their interpretation depends on the target's cysteines, accessibility, redox state, and the kinetics of the reaction during the temperature program.
An absence of signal could mean that the protein lacks suitable reporter cysteines, not that it never unfolds. A large early signal could reflect already accessible thiols. Reducing agents and other thiol-containing components can compete with or interfere with the intended chemistry, so use the validated protocol's compatibility guidance.
The microscale membrane-protein assay developed by Alexandrov and colleagues established an influential application of this approach. A later qPCR and plate-reader protocol describes practical implementations and considerations.
CPM needs particular care in mutant comparisons. Introducing or removing a cysteine can change the reporter system itself. A changed curve may then reflect altered labeling opportunities as well as a change in the protein's behavior. Design an orthogonal check before interpreting the shift as improved stability.
Build a compatibility pilot before the full screen
Use a small pilot to determine whether the assay can answer the intended question. Include a sample-free formulation blank, the reference protein preparation, relevant solvent controls, and independent repeats where sample allows.
Test a modest concentration range within the method's guidance. Check whether the curve shape and estimated transition remain interpretable. Concentration dependence may reflect signal limitations, aggregation, or a coupled process; it should not be hidden by selecting only the most attractive trace.
Keep the heating rate, temperature range, equilibration, sealing, and analysis method consistent. A thermal transition can depend on the time spent at temperature, especially when unfolding and aggregation are irreversible. Comparisons across different protocols therefore require more care than subtracting two reported Tm values.
Treat curve acceptance as part of the experiment
Decide what makes a curve interpretable before ranking the conditions. A useful criterion might require a measurable protein-dependent feature, sufficient signal throughout the relevant region, reproducibility, and a transition that falls within the observed range. The precise rule depends on the method; the essential point is that a fit should follow an observable feature rather than create one.
Three outcomes deserve separate labels. No resolvable transition means the assay did not provide a defensible transition estimate. No detected shift means an interpretable transition was comparable to the reference within the experiment's resolution. A shift outside the measured range is a bounded observation if the underlying interpretation is supported; it is not a precisely measured higher temperature. Combining these outcomes into one spreadsheet column of zeros discards useful information.
For curves with more than one feature, avoid automatically selecting the highest-temperature derivative peak. The first event may reflect a domain important for function, while a later event describes a different part of the protein or an aggregate. Review the raw signal and assign only the interpretation the evidence supports. A reproducible multiphasic curve may be informative even when a single-transition fit is inappropriate.
A small uncertainty on a fitted midpoint describes the selected mathematical model and data. It does not necessarily include preparation-to-preparation variation, baseline choice, or uncertainty about which physical event generated the signal. Report replicate behavior and the analysis rule alongside the value. Additional decimal places do not repair an uncertain signal assignment.
The same principle applies to blanks. A formulation control can identify background, but subtraction assumes that the relevant background contribution behaves comparably with and without protein. If adding protein changes dye partitioning or aggregation, simple subtraction may not isolate an unfolding signal. When that assumption is doubtful, another observation channel can be more useful than increasingly elaborate curve fitting.
What an apparent Tm does and does not establish
An apparent Tm is an operational feature of a measured transition under stated conditions. It can be useful for ranking samples in a validated assay. It is not automatically an equilibrium folding free energy, a shelf-life prediction, or evidence that a receptor remains functional.
A ligand-associated shift supports a change in sample behavior. It does not, by itself, provide a binding constant or establish the desired mechanism. Optical interference, aggregation, and formulation effects need consideration. A negative shift can also be biologically meaningful; it should not be discarded merely because the screen expected stabilization.
Our guide to why a thermal-shift assay may not predict real stability covers this distinction in more depth. Lipid effects can be highly target specific, as illustrated by an engineered thermal-shift screen for membrane-protein lipid preferences.
Figure 2. A fluorescence transition and aggregation describe different events. Neither alone establishes retained function or stability during routine handling. Conceptual illustration.
Choose the next assay from the remaining uncertainty
Suppose a hypothetical formulation raises the nanoDSF transition but causes earlier scattering and reduces activity. That result does not support calling it the best formulation. It suggests that one fluorescence feature improved while other properties became worse.
Conversely, a condition with a modest transition shift may preserve monodispersity and activity throughout a relevant incubation. For a purification or binding experiment, those properties may matter more than the highest apparent Tm.
Follow up with measurements that match the intended use: SEC or FSEC for chromatographic behavior, a defined hold-time study for handling stability, and a binding or activity assay for function. Select combinations that resolve different uncertainties rather than repeatedly measuring the same optical event.
Worked example: the highest apparent Tm is not the best formulation
Imagine three formulations for the same purified receptor, all measured using the same preparation and analysis rules. The numbers below are hypothetical and do not define recommended thresholds.
| Formulation | Fluorescence transition | Scattering behavior | Function after relevant handling |
|---|---|---|---|
| Reference | Apparent midpoint 48 °C | Rises after the main fluorescence feature | Retained |
| A | Apparent midpoint 54 °C | Rises before the main fluorescence feature | Reduced |
| B | Apparent midpoint 50 °C | Similar to reference | Retained, with improved recovered material |
Ranking only by the fluorescence midpoint selects A. The broader evidence instead makes B a plausible candidate for follow-up and A a question to investigate. A may stabilize one reporter environment while promoting an undesirable process elsewhere. Alternatively, its fluorescence feature may be affected by the formulation. The table does not identify the mechanism, but it makes the unsupported conclusion visible.
The next measurement should address that uncertainty. If the project needs a functional binding reagent after storage, evaluate that endpoint under the relevant handling conditions. If the main concern is aggregation during concentration, examine the recovered population after that transition. Repeating another thermal curve may demonstrate reproducibility while leaving the practical question unanswered.
The combined fluorescence and scattering study by Kotov et al. (2019) supports observing more than one aspect of detergent-solubilized protein behavior. The decision table above is an editorial example, not a reproduction of their data. Its purpose is to show how distinct readouts can prevent a single favorable number from dominating a formulation decision.
A useful final report therefore names the assay, formulation, observable, analysis rule, and functional context. “Formulation B improved recovered functional material under the tested handling conditions” is a stronger project conclusion than “B is more stable” when only part of stability has been examined.
Keep prediction and measurement connected
If you use Orbion Stabilize to prioritize mutation candidates, retain the exact variant, predicted endpoint, experimental assay, and formulation with each result. A mutation that improves one assay can still compromise expression, binding, or another property. The experimental record should preserve that tradeoff.
For each accepted curve, save raw data, analysis settings, replicate variation, blanks, and reasons for excluding uninterpretable wells. Record “no interpretable transition” separately from “no change.” That distinction prevents a failed readout from becoming a misleading stability label in the next design round.
Common questions
Which assay should I try first?
Choose from the target's reporter chemistry and the formulation's compatibility. Run a small pilot with controls before committing to a larger screen. There is no universally best assay for membrane proteins.
Can I compare Tm values from different methods?
Treat them as method-specific observations unless you have established how the transitions relate for your system. They may report different structural or chemical events.
Does no transition mean the protein is exceptionally stable?
No. The signal may be too weak, already saturated, incompatible with the formulation, or unrelated to the relevant structural change. Check the raw data and use another observation channel.
References
- Niesen FH, Berglund H, Vedadi M. The use of differential scanning fluorimetry to detect ligand interactions that promote protein stability. Nature Protocols. 2007. doi:10.1038/nprot.2007.321
- Alexandrov AI, et al. Microscale fluorescent thermal stability assay for membrane proteins. Structure. 2008. doi:10.1016/j.str.2008.02.004
- Tomasiak TM, et al. General qPCR and plate reader methods for rapid optimization of membrane protein purification and crystallization using thermostability assays. Current Protocols in Protein Science. 2014. doi:10.1002/0471140864.ps2911s77
- Kotov V, et al. High-throughput stability screening for detergent-solubilized membrane proteins. Scientific Reports. 2019. doi:10.1038/s41598-019-46686-8
- Nji E, et al. An engineered thermal-shift screen reveals specific lipid preferences of eukaryotic and prokaryotic membrane proteins. Nature Communications. 2018. doi:10.1038/s41467-018-06702-3