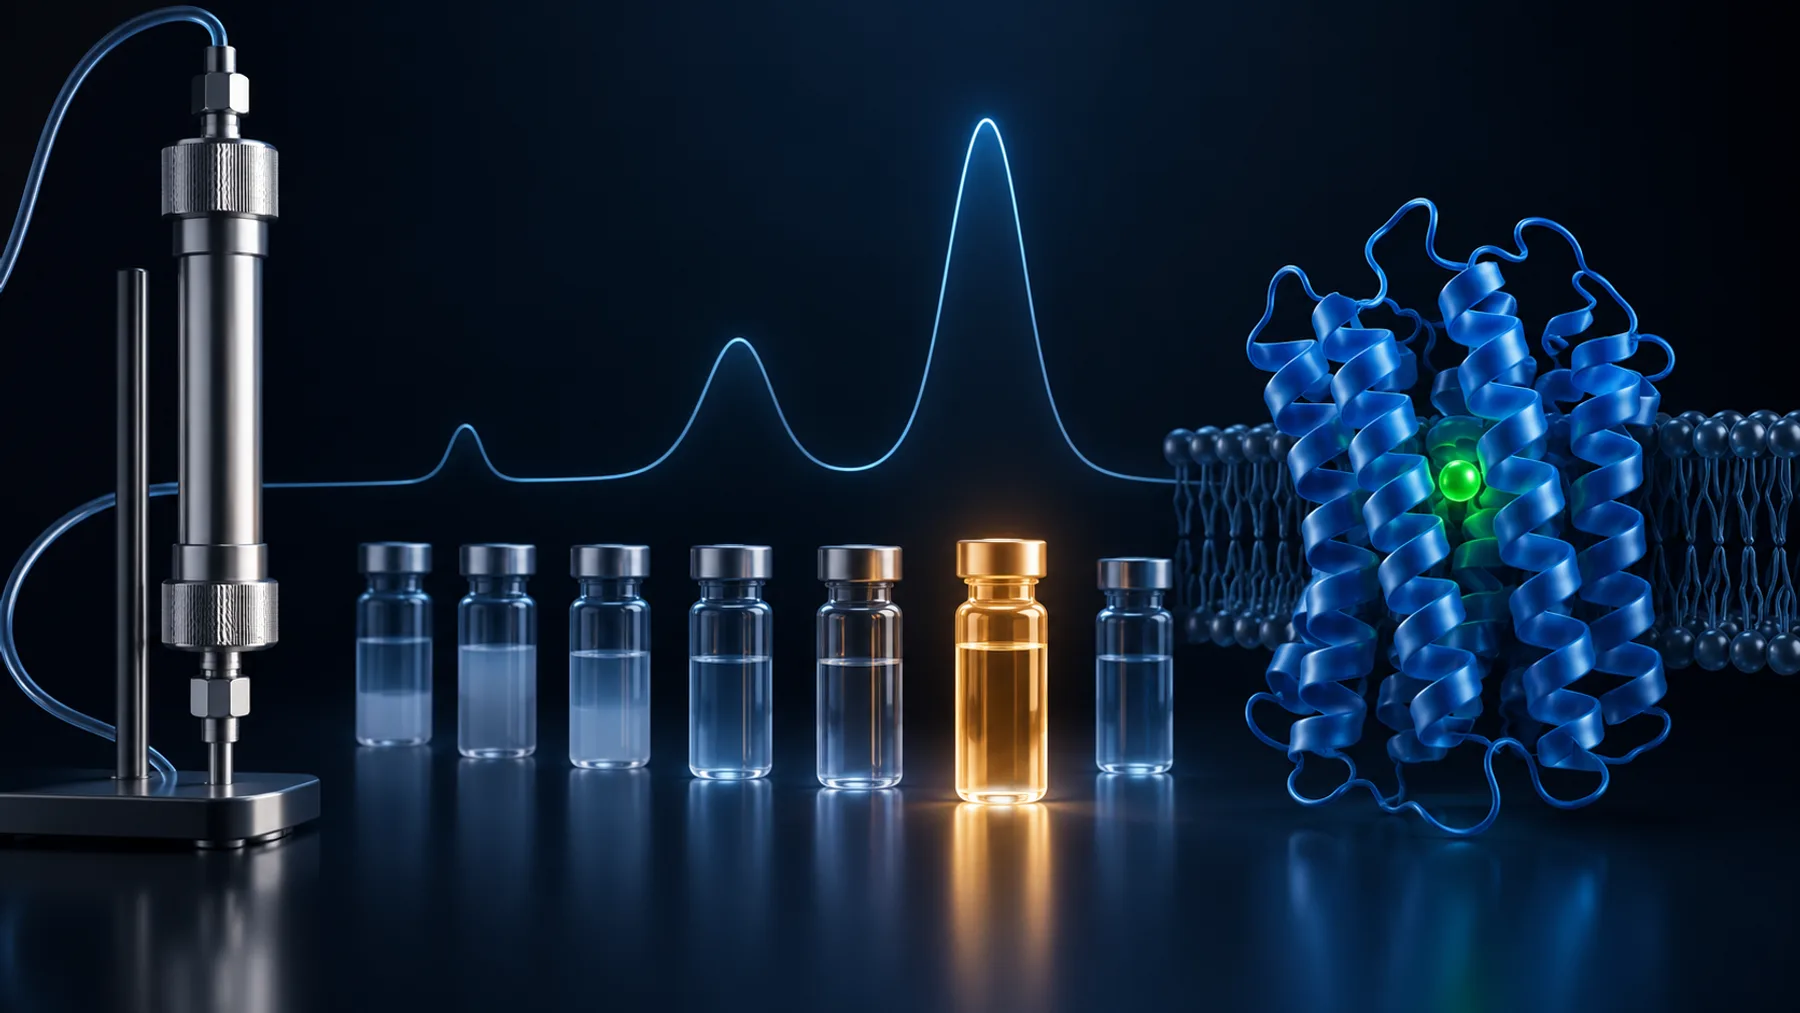
The SEC chromatogram has a clean peak, but the pooled sample contains far less protein than you loaded. Did the column absorb it? Did it aggregate? Or did a normal separation simply dilute it below the concentration you expected?
Start with a mass balance across the actual injection and collected fractions. Low peak concentration and low recovered mass are different problems. A narrow pooling window, sample left in the vial, delayed collection, or inconsistent quantification can look like protein loss before the column chemistry is involved.
Define recovery before troubleshooting it. Are you measuring total protein, the intact target, or the monodisperse target population you intend to use? Those denominators and endpoints can lead to different, equally valid percentages.
Key takeaways
- Calculate recovery from the actual injected mass and measured fraction volumes.
- Separate chromatographic recovery, pooling choices, and losses during subsequent handling.
- Interpret yield alongside measurement uncertainty and the quality required for the next experiment.
Step 1: Measure the mass that actually entered the system
For a concentration C and volume V, protein mass is M = C × V, with compatible units. Use the actual injected volume, not the volume originally prepared for the run.
In a hypothetical example, 0.50 mL at 2.0 mg/mL contains 1.0 mg. If only 0.40 mL was injected, the relevant load is 0.80 mg. Recovering 0.64 mg would then be 80% of the injected mass, not 64%. These numbers illustrate accounting; they are not a recommended recovery threshold.
Check the autosampler or manual injection procedure, loop configuration, remaining vial volume, and any pre-injection filtration or clarification. Material removed before injection cannot be assigned to the column. If the sample precipitated during the wait, a concentration measured hours earlier may no longer describe the injected aliquot.
Step 2: Separate dilution from missing mass
SEC often spreads a concentrated injection across a larger elution volume. A pool with one-tenth the starting concentration can still contain most of the injected mass if its volume is correspondingly larger.
Measure both pool concentration and volume. Calculate the mass in individual fractions or in carefully defined pools. Correct for sample removed for analysis, and record any dilution introduced by the measurement method.
Make the analytical method comparable before and after the run. A280 measurements depend on the blank and extinction coefficient; colorimetric assays depend on their standards and matrix. A buffer change between the load and the eluate can change measurement bias. If the target is impure before SEC, total protein in the load is not equivalent to target protein in the final pool.
The Cytiva SEC handbook describes separation, sample considerations, and operational factors that should inform the system-specific review.
Figure 1. Dilution lowers concentration without necessarily implying the same loss of total protein. Recovery must be assessed from both concentration and volume; the vessels are illustrative.
Put each recovery percentage beside its denominator
Three percentages can describe the same run. Chromatographic recovery compares the target collected across the run with the target actually injected. Pooling recovery compares the selected pool with the target recovered across those fractions. Final recovery compares the material available after pooling and subsequent handling with the original injected target. Naming the denominator prevents a purification decision from becoming an unexplained loss.
Consider this hypothetical accounting example. Concentrations are assumed to represent comparable target-specific measurements; if they are total-protein estimates, that limitation must remain explicit.
| Location | Volume | Target concentration | Calculated target mass |
|---|---|---|---|
| Actual injection | 0.40 mL | 2.00 mg/mL | 0.80 mg |
| All target-containing fractions | 4.00 mL | 0.18 mg/mL on average | 0.72 mg |
| Selected central pool | 2.00 mL | 0.24 mg/mL | 0.48 mg |
| Final concentrated material | 0.20 mL | 1.80 mg/mL | 0.36 mg |
The run recovered 90% of the injected target across the fractions. Pool selection retained about 67% of that recovered target, or 60% of the injected amount. Subsequent handling retained 75% of the selected pool, leaving a final recovery of 45% of the injection. Calling this a “45% SEC recovery” would obscure where most of the reduction occurred.
The next decision follows from the accounting. If flanking fractions meet the required quality standard, broader pooling may help. If those fractions contain unacceptable contaminants or assemblies, the central pool may be the right choice despite lower yield. If the largest avoidable loss occurs during concentration, changing the SEC resin may not address it.
Use an actual sum of fraction masses when concentrations vary. Multiplying total volume by an unweighted mean concentration is valid only when it represents the appropriate volume-weighted average. Keep samples removed for analysis in the accounting, and avoid counting the same material both as an individual fraction and as part of the pool.
Step 3: Look beyond the fractions you intended to keep
Inspect the complete chromatogram and collection record. Your target may appear in early material, the shoulders of the main peak, later fractions, or a region excluded by the collection threshold.
Confirm fraction identity with an appropriate method. UV absorbance alone cannot show that a peak contains intact target. A gel, Western blot, activity measurement, or another target-sensitive assay may be needed, depending on the sample.
Check the detector-to-collector delay and collection settings for your system. A fraction label based on pump volume may not correspond exactly to the material passing the detector at that moment. A narrow peak combined with an incorrect delay can put much of the target outside the intended tubes.
Distinguish chromatographic recovery from pooling recovery. If most target mass is present across the fractions but you keep only the center of the peak, the low final yield may be a deliberate purity or homogeneity tradeoff. That is different from unexplained disappearance.
Figure 2. A selected pool may contain only part of the recovered target. Review relevant flanking fractions before attributing a low final yield to the column. Conceptual illustration.
Step 4: Investigate precipitation and aggregation
Compare the sample before injection, after any holding period, and after the separation. Look for visible material, increased scattering, early-eluting target, or a change in chromatographic shape. Retain pellets or filter-associated material when practical if their analysis will help locate the loss.
SEC changes concentration and exposes the protein to a particular buffer for a defined time. A protein that depended on an additive in the load may become unstable as that additive separates or dilutes. Conversely, very concentrated injection conditions can promote aggregation before the run even starts.
For membrane proteins, confirm that the mobile phase supports the intended detergent or lipid environment throughout the experiment. A formulation that worked during affinity purification may not transfer unchanged to SEC. Follow the column and formulation guidance rather than applying a universal detergent concentration.
Our articles on SEC void-volume elution and precipitation during concentration help distinguish these related failure points.
Check whether the apparent loss is larger than measurement uncertainty
Small differences in recovery can be overwhelmed by concentration bias, volume estimates, or the distinction between target and total protein. A loaded sample and a post-SEC pool often have different impurity and buffer compositions. Even if the same instrument reports both values, they may not be directly comparable measurements of the same material.
For A280, verify that the extinction coefficient and molecular mass describe the product being quantified. A fusion tag, cleavage event, or changed sequence can alter the appropriate conversion. Pace et al. (1995) established how aromatic residues and cystine contribute to protein absorbance and evaluated prediction of absorption coefficients. A generic conversion from absorbance to mg/mL is therefore an assumption that should be checked for the construct.
As a simple illustration, suppose both load and pool masses have independent relative standard uncertainties of 10%. First-order propagation gives a relative uncertainty of approximately 14% for their ratio: the square root of 0.10² + 0.10². A calculated recovery of 80% would then carry about 11 percentage points of standard uncertainty from those two inputs alone. This is not a universal error estimate; it shows why 80% and 85% may be indistinguishable in one experiment.
Systematic errors behave differently. An incorrect extinction coefficient used for the same pure protein before and after SEC may partly cancel in a ratio. Matrix changes, impurity removal, or tag cleavage can prevent that cancellation. Repeated measurements of the same biased sample can be precise without becoming accurate.
Recovery above 100% is consequently a diagnostic clue, not evidence that the column created protein. Consider changed background, a different analytical response, incorrect volumes, or a denominator that omitted part of the load. Resolve the measurement model before optimizing a small apparent improvement in recovery.
Step 5: Test adsorption and other interactions systematically
Unexpected retention, broad tailing, or incomplete recovery may suggest interactions with the stationary phase or flow path. These observations are not proof of adsorption, but they justify a controlled investigation.
Review pH, ionic strength, sample composition, matrix compatibility, and column condition. Change one relevant parameter at a time within the manufacturer's limits. A buffer change may reduce nonspecific interaction while also affecting the protein itself, so assess recovery and sample quality together.
Where supported by the instrument procedure, an appropriate flow-path or bypass comparison can help locate losses outside the column. Include the same tubing, sample handling, and analytical method where possible. Do not improvise cleaning solvents or pressure conditions, and do not add a carrier protein casually: it can contaminate the preparation and obscure target-specific recovery.
The Cytiva protein-purification troubleshooting guide is a useful starting point for operational checks. Use the instructions for the particular column and system when selecting a corrective action.
A compact diagnostic experiment
For the next run, save small, labeled samples of the pre-injection preparation, any clarified supernatant, representative early fractions, the main peak, late material, and the final pool. Record volumes and use a consistent quantitative method. Include identity testing at the locations most likely to explain the missing target.
Then ask three questions in order:
- Does the actual injection account for the expected starting mass?
- Does the complete set of collected fractions account for the injected target?
- Does the chosen pool account for the target present in the useful fractions?
This sequence localizes the problem before you change the entire purification. If the missing mass is mostly outside the pool, optimize collection or accept the purity–yield tradeoff. If it is lost before injection, work on handling and formulation. If it remains unaccounted for after the column, investigate recovery and interactions under controlled conditions.
Separate recovery of mass from recovery of function
The material may be present but no longer useful. Conversely, removal of an inhibitor can increase measured activity without increasing protein mass. The Cytiva troubleshooting guide distinguishes abnormal recovery from changes in activity and assay conditions. Keep those outcomes separate in the run record.
For an enzyme, total activity and specific activity are different quantities. A smaller pool can have higher activity per unit mass because contaminants were removed, yet contain less total activity than the load. For a binding reagent, a larger measured protein mass can still contain a smaller active fraction. Neither purity nor recovery alone defines the amount suitable for the next experiment.
A practical comparison should therefore report at least the relevant mass endpoint and a quality endpoint. That quality measure might concern identity, functional activity, assembly, or homogeneity. Choose it from the intended use rather than from whichever assay gives the most favorable number. If the target cannot be quantified independently of contaminants in the starting sample, label the mass balance as an estimate instead of presenting false precision.
This also changes the interpretation of broader pooling. Adding a shoulder may increase recovered mass while reducing the fraction that behaves reproducibly. If the next assay requires a well-defined population, the apparent yield improvement can become a downstream cost. Record what was excluded and why so that a later project can revisit the decision with different requirements.
Finally, distinguish a known tradeoff from an unresolved mechanism. “We discarded target-containing shoulder fractions to meet the homogeneity requirement” is a documented choice. “The missing target adsorbed to the column” remains a hypothesis until the evidence locates it there. That distinction makes the next experiment smaller: account for the missing material first, then test the most plausible remaining explanation.
Connect recovery to the construct decision
A single final yield number can hide several independent weaknesses. One construct may express well but precipitate during concentration; another may express modestly but survive every purification step. Keep stepwise recovery and functional quality with the exact sequence and formulation.
Orbion Bench can support the construct-planning side of that comparison. The experiment establishes where a construct succeeds or fails. That distinction helps you decide whether the next intervention belongs in the sequence, formulation, loading procedure, or collection method.
Common questions
Is low peak height evidence that protein stuck to the column?
No. Peak height also depends on dilution, peak width, detector response, and the amount injected. Calculate recovered mass and examine the full run before attributing loss to adsorption.
Should I pool more broadly to improve recovery?
Only if the added fractions meet the quality requirements of the next experiment. Report the resulting purity and heterogeneity tradeoff instead of optimizing yield in isolation.
Can a clean SEC peak still contain poor-quality protein?
Yes. SEC behavior alone does not establish activity, correct folding, or identity. Use an appropriate functional or structural check for the intended application.
References
- Cytiva. Size Exclusion Chromatography: Principles and Methods. Official handbook. Accessed October 2026.
- Cytiva. Protein purification troubleshooting guide. Official guide. Accessed October 2026.
- Pace CN, et al. How to measure and predict the molar absorption coefficient of a protein. Protein Science. 1995. doi:10.1002/pro.5560041120